MTF Stochastic ScannerThis Stochastic scanner can be use to identify overbought and oversold of 10 symbols over multiple timeframes
it will give you a quick overview which pair is more overbough or more oversold and also signals tops and bottoms in the AVG row
light red/green cell = weak bearish (Stoch = 30-20) / bullish (Stoch = 70-80)
medium red/green cell = bearish (Stoch = 20-10) / bullish (Stoch = 80-90)
dark red/green cell = strong bearish (Stoch <= 10) / bullish (Stoch >= 90)
gray cell = neutral (Stoch = 30-70)
Usage
If AVG (average of all 4 timeframes) falls below 20, the cell will get green, indicating a good time to enter long (buy)
If AVG (average of all 4 timeframes) rises above 80, the cell will get red, indicating a good time to enter short (sell)
Use the "MTF Stochastic Scanner" in combination with the " MTF RSI Scanner "
to find tops (RSI MTF avg >=70 AND Stochastic MTF avg >= 80)
or bottoms (RSI MTF avg <= 30 AND Stochastic MTF avg <= 20)
Here is how the two MTF scanners looked on Nov 08 2021 (ATH) »
and here how the MTF scanners looked on June 21 2022
use TradingViews Replay function to check how it would have worked in the past and when not.
As always… there NOT a single indicator that can show to the top & bottom 100% every single time. So use with caution, with other indicators and/or deeper understanding of technicals analysis ☝️☝️☝️
Settings
You can change the timeframes, symbols, Stochastic settings, overbought/oversold levels and colors to your liking
Drag the table onto the price chart, if you want to use it as an overlay.
NOTE:
Because of the 4x10 security requests, it can take up to 1 minute for changed settings to take effect! Please be patient 🙃
If you have any idea on how to optimise the code, please feel free to share 🙏
*** Inspired by "Binance CHOP Dashboard" from @Cazimiro and "RSI MTF Table" from @mobester16 ***
RSI Estocástico (STOCH RSI)

Indicator Direction Table With Bullish & Bearish LabelsINDICATOR DIRECTION TABLE WITH BULLISH AND BEARISH LABELS
This is a table that shows the bullish, bearish or neutral trend for nine different popular indicators. Each indicator label will change color in real time to make you aware of each change in direction. This way you don’t have to read and analyze a bunch of different indicators constantly and you can focus on price action instead.
Look for the entire table to turn green or red before taking positions.
You can also set alerts for when the entire table of indicators is bullish or bearish.
The indicator settings allow customization of indicator lengths & values, table position and turning the indicator table on or off.
The length and other values for each indicator can be customized to suit your preferences, but by default all of them are set to the normal default settings that Tradingview supplies the indicators with. Typically 14 as the length.
The indicators used in this table are as follows:
MACD - Moving Average Convergence Divergence
Stochastic RSI - Stochastic Relative Strength Index
Vortex - Vortex Indicator
Momentum - Momentum Indicator
RSI - Relative Strength Index
PSAR - Parabolic Stop & Reverse
DMI - Directional Movement Index
MFI - Money Flow Index
Fisher - Fisher Transform Price Action
***MARKETS***
This indicator can be used as a signal on all markets, including stocks, crypto, futures and forex.
***TIMEFRAMES***
This indicator table can be used on all timeframes.
***TIPS***
Try using numerous indicators of ours on your chart so you can instantly see the bullish or bearish trend of multiple indicators in real time without having to analyze the data. Some of our favorites are our Auto Fibonacci, Directional Movement Index + Fisher Price Action, Volume Profile With Buy & Sell Pressure, Auto Support And Resistance and Money Flow Index in combination with this indicator direction table. They all have unique features to help you make better and faster trading decisions.

Market SniperWelcome to Market Sniper!
This indicator attempts to catch market tops and bottoms based on the market being extremely extended in its respectful direction. It combines a Triple Stochastic RSI as well as MACD convergences to strengthen the signal. A standard RSI can also be shown if needed.
Highlighted green means that you are moving towards a potential bottom.
Highlighted red means that you are moving towards a potential top.
An arrow will signify that the direction of momentum has changed.
If you see the same colored bar below the highlighted area, price is converging; strengthening the original signal.
This indicator is extremely user-configurable. Just take a look at the settings as they are self explanatory.

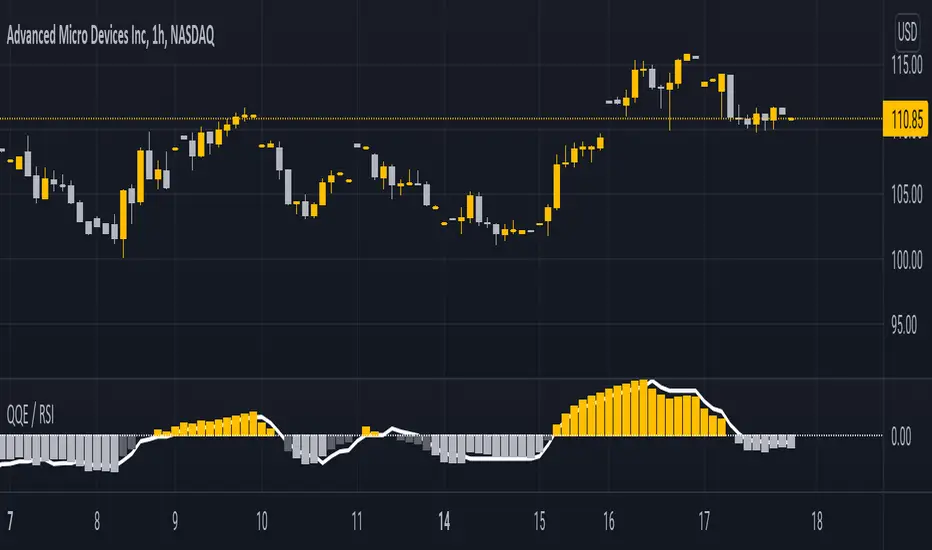
QQE / RSIA indicator which combines the QQE indicator, which is a momentum based indicator to determine trend and sideways.
The Qualitative Quantitative Estimation (QQE) indicator works like a smoother version of the popular Relative Strength Index ( RSI ) indicator. QQE expands on RSI by adding two volatility based trailing stop lines. These trailing stop lines are composed of a fast and a slow moving Average True Range (ATR). These ATR lines are smoothed making this indicator less susceptible to short term volatility .
Along with it, i integrated the RSI indicator so both can be monitored simultaneously on one indicator.
This script had been inspired by Mihkel00 so go check him out.
The indicator is shown on the chart as columns, and the other "hidden" in the background which also has a 50 MA bollinger band acting as a zero line.
When both of them agree - you get a bullish or bearish bar
Relative Strength Index - Divergences, Stoch, Reverse StochThis is aggregation of RSI indicators - RSI, Divergences, Reverse & Stochastic RSI
Thanks to ©JayTradingCharts and ©mohanee for the RSI Divergences code
Thanks to BApig - Motgench, balipour and Wugamlo for the reverse stoch code
Changes:
1. Add option to calc divs based on close or wicks or both (RSI is close based)
2. Add pivots (marking local high/low)
3. Update to Pine v5
4. Cleanup of unused code

KINSKI Multi RSI DivergenceThis extremely useful indicator combines several RSI variants (can be displayed simultaneously or alone) with many setting options. The RSI variants can also be displayed as an extra histogram, which provides additional valuable information. Furthermore, it is possible to set smoothing types, volume and stochastic based calculations for each variant.
Relative Strength Index (RSI)
The Relative Strength Index ( RSI ) is a momentum indicator that measures the extent of recent price changes to analyse overbought or oversold conditions. RSI values range from 0 to 100. In general, RSI divergence means that the RSI indicator is moving in the opposite direction compared to the price. So while the price is moving, the RSI is telling us in advance that we can expect a change in direction.
RSX Indicator
The RSX is the noise-free version of the more familiar RSI oscillator. Normally, any indicator can be smoothed by applying a moving average. However, a major disadvantage of such a method is that there is a time lag between the indicator and the price. The RSX indicator tries to do this without signal delay.
Money Flow Indicator (MFI)
The MFI is essentially the RSI with the added aspect of volume . Because of its close similarity to the RSI , the MFI can be used in very similar ways.
RSI Laguerre
The RSI Laguerre works in the same way as the classic RSI , but is more sensitive to recent prices. When it crosses the signal line at the value of 0.15 from the bottom to the top, a buy signal is created, while overbought markets have values of 0.75 or higher
Detection of divergences
The detection of divergences in the RSI is one of the most important functions of this indicator. The reason is that an divergence is a more reliable signal than the overbought and oversold indicators themselves. You get overbought and oversold signals all the time. However, the divergence is a rare event.
In general, divergence means that the RSI indicator is moving in the opposite direction compared to the price. So while the price is moving, the RSI is telling us in advance that we can expect a change in direction.
Positive divergence
A positive divergence is when the price trend has lower lows and lower highs, while the indicator does the opposite - higher highs and higher lows. The price continues to fall while the RSI indicator begins to rise.
Negative divergence
Negative divergence is the opposite of positive divergence. It applies to uptrends where the price reaches higher highs and higher lows. However, the RSI shows lower highs and lower lows - the price goes up but the RSI goes down. The price closes with higher highs and higher lows, while the indicator shows the opposite - lower lows and lower highs, confirming a negative divergence. As a result, there is a sharp decline in the price.
Have fun using and trying out this flexible indicator!

CA - Indicators ColorsThe following indicator help to have an idea of the current state of the MACD and FullStochastic in 1 hour and 1 day. If you are a trader that is regularly using stochastics and macd indicator and don't have enough space in you screen this might help to increase the space in your screen.
Parameters used on MACD: 12, 26,9
Parameters used on Stochastics: 14,5,5
The whole idea of the indicator is if you see an entry for a long position, you can confirm that a higher timeframe its aligned by both indicators and if you are seeing an entry for a short position you can confirm with a higher timeframe.
This indicator doesn't provide an entry or exit signal, but lets you verify where is the trend going in those timeframes so it helps you decide to make the trade.
Stochastic
Green: going up
Red: going down
Macd
Green: going up
Light Green: previous was green and going down.
Red: going down
Light Red: previous was red and going up
Keep in mind, the colors are going to get updated as long as the market is active.
Any feedback its appreciated.

ETH Bottom FinderThis indicator is a 3 step process for confirming a short term bottom on ETH. Using the setting that are preset, there is are 1, 2 hour and 4 hour alerts. Going top down, if the 4H alert fires and a 1 or 2 hour signal is plotted, the long signal is confirmed. This will only plot on these timeframes and the "ETH 2H Bottom" and "ETH 4H Bottom" will only plot and signal for the ETHUSD ticker. The HigherTimeKLimit is for limiting the 2H slowstoch(21,3) k value for the 1H signal. Used on different pairs, I set it customized with target/stop loss percentages as follows:
upper K STB T:SL
CRV 11 2 3:4.5
LINK 13 2 4:2.2
ATOM 15 1 4:2.8
AVAX 11 1 5:5
AXS 9 2 3:4
STORJ 11 1 4:2.8
XTZ 11 2 no
VET 13 2 4:2.8
UNI 17 2 no
SOL 13 2 4:2.8
ONE 16 2 5:2
FTM 20 1 7:2
ADA 10 2 3:2.2
MATIC 11 1 5:2
HBAR 2H 17 1 5:5
ATOM 2H 1 5:5
LTC
ETH 17 2 no
The STB 1 or 2 refer to showatomstb or showonestb (just a name).

SAR+RSI+EMAs SignalsNOTE:
Indicator based strategies may expire and begin to work again. There are various ways to check the expiration of these strategies but I suggest equity curve trading (EC trading) as the best one.
Please check every single indicator based strategy to see if it’s still profitable or it has been expired to avoid losses.
Principles:
I personally believe every profitable indicator-based setup need 3 factors. Actually I analyze indicator-based set up in this way!
1- Trend detector: a tool that detect the “trend”.
2- Oscillators (Discount finder): a tool that detects “discounts” in the direction of the trend.
3- Stimulus: A tool that indicates the Initiation of a movement.
There may be profitable strategies that do not use all three, because other factors are strong enough to lead us to profit, but they are rare and sometimes they hide the other forgotten factor in the main two ones.
Elements:
(Since most of traders here, are familiar with these famous indicators I will not take your time to write about their uses and formula)
SAR: As a Trend detector, regarding position of close and SAR
EMA 7 and EMA 21: As trend detectors, regarding position of EMA 7 as fast “moving average” and EMA 21 as slow one. Also we need another confirmation for trend regarding EMA 7 and closing price of the signal candle.
RSI: In this strategy RSI is used both as a discount finder and a stimulus.
For RSI being over/under 50, regarding the trend, a possible discount may have been occurred. Imagine these conditions: close>EMA7, EMA7>EMA21, close>SAR and simultaneously RSI being under 50 is really a sign of powerful uptrend which it’s RSI decreasing might be a sign of corrective move, which will be following a bullish impulsive move.
The other use of RSI is to stimulate a buy signal by “crossing” over 50 or 30 (50 as balanced point of momentum and 30 as a sign of ending an oversold) or stimulate a sell signal by “crossing” under 50 or 70 (50 as balanced point of momentum and 70 as a sign of ending an overbought).
Entry point: you can use one of the followings.
1- Open of the next candle
2- EMA 7
3- Open of the signal candle
(Totally optional but “open of the next candle” is suggested by me.)
SL: Use one of the followings.
1- SAR or some pips (regarding ATR Or your experience of this trading instrument’s fluctuations in this time frame) below the SAR
2- Fixed amount (regarding ATR Or your experience of this trading instrument’s fluctuations in this time frame)
3- Use EMA21 as dynamic SL (if a candle far enough from the initiative candle close over (for sell) below ( for buy)
Again number 1 is suggested by me.
TP: Use one of the followings.
1- Use static levels or zones of support and resistance as TP.
2- Use dynamic levels for instance band of BB or moving averages (Moving the SL is possible).
3- Use fixed R to R
And I believe static zones of support and resistance work better.
Examples:
I indicate a buy signal on the chart!
Using local level as TP worked just good.
Using EMA was better in this case.
And using a riskier level or a fixed R to R is obvious in the chart!
Since in the range markets, this strategy may not work well and at the same time, TP to SL might be too small to be worth the risk, I prefer to use levels to filter range market conditions!
I convert all those circumstances to a simple buy and sell signs on the chart!
EMA21 and SAR are still visible because it is possible that traders use them for their TP and SL.
This is how it look without EMA21 and SAR!
Another screenshot of this strategy!
I also add a check box to filter signals by another trend detector. MATD created by me to help traders detect trend!
As it’s visible, some profitable signals filtered too, but using a longer-term trend detector as an additional one, alongside the double EMAs is very useful for this strategy.
The other box “use high&low instead of close for fast EMA” makes the “EMA7 and close” trend detector an easygoing one!
Almost everything is editable here!
*** I did not invent this strategy, you can find it for free on net ***
I'll change it to a "strategy" instead of an indicator if reader like to!

Madrid Bull Bear SentimentThis is an upgrade from Pinescript 1.0 published on April 2016 to Pinescript 5.0

AnNam RSI Cycle [PlungerMen] This script improves the default RSI 14
1: it identifies regions of the RSI which are oversold and overbought by changing the color of RSI from white to red.
2: it adds additional reference lines at 20,25.. 75,80 to better gauge the RSI value
Finally, the coolest feature, the middle 50 line is used to indicate which cycle the price is currently at
A green color at the 50 line indicates a bullish cycle, a red color indicators a bearish cycle, and a white color indicates a neutral cycle.
The cycles are determined using the RSI as follows:
if RSI is overbought, cycle switches to bullish until RSI falls below 40 , at which point it becomes neutral
if RSI is oversold, cycle switches bearish until RSI rises above 60, at which point it becomes neutral
a neutral cycle is exited at either overbought or oversold conditions
Thank for TradeCamily!

TTMW STR : Triple EMA + Stochastic RSI #a001Authored by Kuntanut - To The Milky Way
Triple EMA + Stochastic RSI :
The Indicator purpose is to indicate the entry signal of my strategy using the combination of the 3 EMA and Stochastic RSI
The EMA are used as the filter for the strategy, the fast and slow EMA parameters determine the small bullish or bearish state of the symbol. The filter EMA filters the fast and slow EMA to be in the same bigger trend.
Long Condition (Green Background) :
1. Filter
- The Fast EMA (12) is above the Slow EMA (26)
- The Fast and Slow EMA are related with the Filter EMA (200)
2. Signal
- The Stochastic RSI parameter K crossover the D in the oversold area.
3. Entry
- Next Candle after the bar of entry condition
- Place the StopLoss at the lowest low of the 3 bars including the signal bar (ATR can be used to calculate the extension of the StopLoss).
Short Condition (Red Background) :
1. Filter - The Fast EMA (12) is under the Slow EMA (26)
- The Fast and Slow EMA are related with the Filter EMA (200)
2. Signal
- The Stochastic RSI parameter K crossunder the D in the oversold area.
3. Entry - Next Candle after the bar of entry condition
- Place the StopLoss at the lowest low of the 3 bars including the signal bar (ATR can be used to calculate the extension of the StopLoss).

Relative Volume Strength Index (MZ RVSI)INTRODUCTION
Volume always plays a role of key indication for price movements and momentum and I always found the same problem with all available volume oscillators and indicators which is that their data is always in compounded form that can’t be easily used in raw form as a parameter in many strategies.
This indicator uses raw volume data from one of following oscillators:
TFS Volume Oscillator
On Balance Volume
Klinger Volume Oscillator
Cumulative Volume Oscillator
Volume Zone Oscillator
Then this data goes through the following process of noise filtration:
Hull Moving Average of input data to reduce noise
Relative Strength Index of HMA
Hull Moving Average of RSI to reduce noise for finalized RVSI
ADDITIONAL FEATURES
Heiken-Ashi: Heiken-Ashi values are optional to use in calculations and I’ve set them to default as I found good results with them.
Slope for Trend Detection: Slope of finalized RVSI is calculated in order to check volume trend direction. Another additional feature of Volume breakouts is also added which is used in dynamic coloring of RVSI. Dynamic color indications are as follows.
Green Color:
Strong Volume Uptrend above volume breakout point
Fuchsia Color:
Weak Volume Uptrend below volume breakout point but slope supported
Red Color:
Strong Volume Downtrend below volume breakout point
Gray Color:
Weak Volume Downtrend above volume breakout point but slope supported
Yellow Color:
Possible trend reversal as slope is flat.
DEFAULTS SETTINGS
Volume length is 30 (Better for timeframes higher than 1H)
Hull Moving Average and RSI length is set to 14
ADDITIONAL APPLICATIONS
This indicator can be used as divergence detection tool for volume same way as RSI is used for price divergence. I’ll soon add divergence signals inside the code and this code can be used in multiple ways as volume breakout indication in strategies for better results.

Stochastic RSI rainbow in fibonacci sequence using VWMAThe standard stochastic RSI gives limited information as it only contains two reference lines. This Stochastic RSI rainbow contains more lines in shorter timeframes and progressively fewer as the reference time increase. This is done in a FIB sequence 2,3,8,13,21,34,55.... The shorter timeframes are more reactive to current market conditions indicating recent price action and the longer lines represent more significant periods of time. The indicator uses VWMA for its calculations (volume weighted moving average)
HOW TO USE THIS INDICATOR:
When multiple lines are above, either 70 or 80, you can consider the commodity overbought, or OB. The more lines that are above the threshhold, the more significant the signal. The same is true in inverse. In addition, you can use each cross to signify a buy/sell signal according to the type and quantity of trading you are doing. If you are looking to get in and out quickly you can use the lower timeframe signals.
OPTIONS:
You can change what data is used for the VWMA calculation... Of course, you can select colors and other properties as well.
Relative Strength Index + Candle coloringRelative Strength Index (RSI)
>The Relative Strength Index (RSI), developed by J. Welles Wilder, is a momentum oscillator that measures the speed and change of price movements. The RSI oscillates between zero and 100.
>Traditionally the RSI is considered overbought when above 70 and oversold when below 30. But blindly selling at 70 and buying at 30 is a bad idea because price can make very low movement while oscillator makes large moves and vice versa.
>In RSI Signals can be generated by looking for divergences and failure swings. RSI can also be used to identify the general trend.
>Calculation
The RSI is a fairly simple formula, The basic formula is:
RSI = 100 –
>In this script I have used the standard 14 period RSI and added candle coloring feature, I used two other periods other than 14 to determine the major trend and use the position of 14 period RSI relative to other 2 periods to color the candle.
>color reference, what they represent :
>also look out for divergences, its not included in this script will provide in next updates, divergence are HH on price but LH on RSI, LL on price but LH on RSI, easy to identify. the best divergences are often easy to find they occur within next 5-10 candles, do not overcomplicate when it doesn't exist.
How to use this candle coloring:
>best during major trends.
>not best for mean reversion plays.
>use it as an addition to your system.

The Divergent (Pro) - Advanced Divergence IndicatorAutomated divergence detection with unparalleled customizability for any market on TradingView.
This is the Pro version of The Divergent - Advanced Divergence Indicator .
The Pro version contains everything that is in the Basic version, plus:
1. Access to a 2nd indicator, called "The Divergent's Companion"
By applying the companion indicator to the same chart you have The Divergent on, you will have the divergence lines and labels plotted on your price chart as well:
2. Hidden Divergences
While the Basic version can only detect Regular Divergences, the Pro version can detect both Regular and Hidden Divergences:
3. Seven more oscillators to detect divergences on
The Basic version comes with the two most popular oscillators, the MACD and the RSI.
With the Pro version you get access to 7 more oscillators:
- CMF (Chaikin Money Flow)
- Stochastic RSI
- MFI (Money Flow Index)
- TCI (Trading Channel Index), also known as WaveTrend
- Balance of Power
- CCI (Commodity Channel Index)
- Awesome Oscillator
4. Alerts
With the Pro version you can set up alerts on The Divergent indicator, allowing you to get alerted to one of the following events:
1. Regular Bullish Divergence
2. Hidden Bullish Divergence
3. Regular Bearish Divergence
4. Hidden Bearish Divergence
5. Pivot Low Confirmed
6. Pivot High Confirmed
5. Divergence Verification
The Pro version allows you to measure the quality of the detected divergences.
With divergence verification enabled, The Divergent will tell you how many times a particular divergence "played out", i.e. how many times a bullish or bearish divergence has actually resulted in the change in price in the direction predicted by the divergence. You can configure the price % levels which are used to categorise the divergences as valid or invalid (or unknown).
6. Use the signals in your own Pine Script strategy / indicator
The Pro version comes with access to a Pine Script Library called The Divergent Library .
Just add The Divergent onto the same chart you have your strategy on, link the two together using a "source" input, and use the functions in the library to process the signals from The Divergent :
You can think of The Divergent being a DaaS ( D ivergece a s a S ervice)!
7. Customise the look of the divergence lines and labels
The Pro version allows you to change the style of the divergence lines and labels:
---

Multi-timeframe Stochastic RSIThe multi-timeframe stochastic RSI utilizes stochastic RSI signals from 11 different time-frames to indicate whether overbought/oversold signals are in agreement or not across time-frames. Ideally traders should enter and exit when conditions are in agreement as indicated by the intensity of the long (green) or short (red) bands at the top and bottom of the indicator. The intensity of the bands indicates how many of the time-frames are currently overbought/oversold.
Oversold / OverboughtMy first script. Based on RSI , CCI , RVI, and MFI . You can customize overbought or oversold thresholds for any indicator.
If you have any ideas - welcome.
Disclaimer
This is not financial advice. Trade on your own risk.

(Short)EMA 4H + Stochastic RSI By Nussara(study)This strategy is called "(Short)EMA 4H + Stochastic RSI" used for a short position. It uses EMA and stochastic RSI.
The 4-hour EMA is a trend indicator in smaller timeframes. For a short position, EMA slow is above EMA fast and uses stochastic RSI to predict price turning points. Through the formula, traders can identify overbought or oversold.
Default setting
1. The 4-hour EMA defaults to EMA fast =24 and EMA slow = 33.
2. Stochastic RSI defaults K=3, D=3, RSI Length=16, and Stochastic Length = 5.
You should adjust the settings to be suitable for the products that you trade.
(Short)EMA 4H + Stochastic RSI formula
Short Entry :
1. The timeframe of the chart must be less than or equal to 4 hours. If the timeframe is set higher than 4 hours, this strategy will not work.
2. 4-hour slow EMA line must be above fast EMA line, indicating an downtrend.
3. Stochastic RSI K line cross down D line and the intersection must be above 80.
If all three are true, the indicator will have a short signal.
Short Exit: Stochastic RSI K line cross up D line
This indicator is just a tool for technical analysis. It shouldn't be used as the only indication of trade because it causes you to lose your money. You should use other indicators to analyze together.

(Long)EMA 4H + Stochastic RSI By Nussara(study)This strategy is called "(Long)EMA 4H + Stochastic RSI" used for a long position. It uses EMA and stochastic RSI.
The 4-hour EMA is a trend indicator in smaller timeframes. For a long position, EMA fast is above EMA slow and uses stochastic RSI to predict price turning points. Through the formula, traders can identify overbought or oversold.
Default setting
1. The 4-hour EMA defaults to EMA fast =24 and EMA slow = 33.
2. Stochastic RSI defaults K=3, D=3, RSI Length=16, and Stochastic Length = 5.
You should adjust the settings to be suitable for the products that you trade.
(Long)EMA 4H + Stochastic RSI formula
Long Entry :
1. The timeframe of the chart must be less than or equal to 4 hours. If the timeframe is set higher than 4 hours, this strategy will not work.
2. 4-hour fast EMA line must be above slow EMA line, indicating an uptrend.
3. Stochastic RSI K line cross up D line and the intersection must be below 20.
If all three are true, the indicator will have a long signal.
Long Exit: Stochastic RSI K line cross down D line
This indicator is just a tool for technical analysis. It shouldn't be used as the only indication of trade because it causes you to lose your money. You should use other indicators to analyze together.

M.Right Awesome RSI+ (cc)Hey Traders,
Tonight I figured I'd release a special indicator that I've had in the works for years and finally was able to piece it together using pine. It's an extremely accurate take on the RSI. I plan to continue to refine the indicator and add more features, but as it is this is still one you can make a lot of money with.
(((((Please note: all circles and arrows in the chart above are drawn for illustration. Below is a chart showing regular session)))))
This indicator will act similarly to a regular RSI (Relative Strength Indicator) in that there are Oversold and Overbought levels, but also volatility bands around it to allow for more accurate signals whilst moving the Oversold (OS) and Overbought (OB) levels further apart ( less false OB/OS signals ). As shown in the chart above, it's able to detect some pretty big moves with both speed and accuracy .
Most of you are familiar with and use an RSI indicator so I will keep this description as brief as possible: The Relative Strength Index (RSI), developed by the legendary J. Welles Wilder, is a momentum oscillator that measures the speed and change of price movements; it oscillates between 0 - 100, with levels set as Overbought and Oversold. These levels are where a trader make look for a reversal, however they must keep in mind in an uptrend or bull market, the RSI tends to remain in the 40 - 90 range; 40 - 50 zone often will act as support. More advanced traders will also look for divergences between the price and the oscillator (i.e. price trending upward while oscillator trending downward). As far as oscillators go, the RSI is one of the most frequently used, by both advanced and beginner traders alike.
Works great on multiple timeframes. It may not catch every rally, but it will catch most --even on smaller timeframes (i.e. 5 minutes in image below).
As with all of my scripts I like to make them customizable:
You can change the up and down colors on the RSI ribbons and the color and style (dotted shown) of Overbought / Oversold lines. In future versions, I will add more color customizations and additions.
Can toggle 1 or both of the 2 highlight signals off to make it a little more plain.
Lot's of ways to make it look the way you'd like it to.
--The alerts include both the super accurate Bullish and Bearish signals shown with the background highlights. They are pre-filled so it will automatically display the price and time that the alert went off for you.
If I missed anything or you have a question, please let me know!
Cheers,
Mike
Please note: I have made this indicator invite only, send me a DM if you're interested in trying it out.

Stochastic RSI Heat Candles OverlayThis script is based on the Stochastic RSI indicator.
Candles are dynamically colored with a customizable RGB shading directly generated from the average Stochastic RSI current value.
By default, colors represent the following status -> green is overgought & red is oversold.
Options:
Shading colors: Choose between Red/Green, Green/Blue, and Blue/Red shadings to represent the SRSI heat.
Invert colors: Switch colors of the selected shading.
Third color: Select a value from 0 to 255 for the third color which does not vary.
Transparency: Select the transparency value.
Overlay style : Choose to color the whole candle, or only borders and wick.
Show candle side: If you choose to fully fill candles with the SRSI heat color , enable this option to plot shapes representing the candles directions.
Candle marks colors: Select bull and bear colors for direction shapes.
Overbought and Oversold situations are also represented by colored shapes at the top of the chart.
Standards Stochastic RSI parameters.
Examples:
Notes:
Do not forget to bring the script to the front of your chart to avoid being covered by default candles.
Next improvements would probably be a better coloring algorithm, however, do not hesitate to suggest any modifications in comments.
Initially, I shared a Stochastic RSI Heat Bollinger Bands indicator which gave me the idea to develop this one, you can find it on my profile.
Stochastic RSI Heat Bollinger BandsThis indicator is based on a combination of the famous Bollinger Bands and the Stochastic RSI indicator.
Bands are dynamically colored (and filled) with a RGB color composed by red and green values, directly generated from the average Stochastic RSI current value.
By default, colors represent the following status -> green zone is overgought & red zone is oversold.
A screener is also displayed on the chart, representing StochRSI K and D lines values, RSI value, as well as the current status (Overbought/Oversold) of the StochRSI and RSI indicators.
Notes:
The heat color and the screener status are both based on the average value between the K and D lines (for stochastic RSI based heat)
Bands can be disabled in options to use this indicator as a simple moving average colored by the Stochastic RSI heat color.
Options:
Various moving average types (SMA, EMA, SMMA, VWMA...)
Inversion of colors between overbought and oversold status
Enabling/disabling heat color on bands / basis line and bands background color
Show/Hide the screener
Color source can be modified to base the heat on the RSI instead of the Stochastic RSI value
Standards Bollinger bands, Stochastic and RSI parameters
Example
Feel free to suggest any improvements in comment.
