TTP CerberusCerberus is an indicator that uses stochastic RSI applied to the ratio of the total market cap vs the cap of stable coins.
It offers 4 different signals that intent to find market bottoms or tops based on the flow of funds moving from alts into stable coin.
The signals are triggered when the calculation reaches the top and bottom user defined thresholds.
Signals:
1) Warning sell: the most accurate signal that can be used as a serious caution that the market might dump soon. In the total backtesting history it's got a 90% accuracy. It's displayed as a yellow vertical line on the top of the chart.
2) Sell or "confirmation" sell. This is plotted as red vertical line on the top area of the chart. It confirms that the dump has started.
3) Warning buy. This signal is also plotted in yellow but in the bottom of the chart and indicates that the price might potentially have bottomed locally. It is not recommended to be used during bear markets. On bull runs it offers high accuracy.
4) Buy signal, this signal confirms that the waning buy is potentially on its way to higher highs. Just like the warning buy it tends to perform very good on bull markets and shouldn't be considered during bear markets.
By default the indicator uses TOTAL as the total market cap in crypto. Alternatively you can select TOTAL2 or TOTAL3 and compare results.
The total market cap for stable coins is calculated as the sum of USDT, USDC and DAI.
I personally use this indicator ONLY in the weekly timeframe as that's where I see the most reliable results.
It offers separated alerts for each individual signal.
How I plan to use it? I'm personally planning to use the warning sell signal on the weekly as a potential high risk caution flag for the crypto market.
RSI Estocástico (STOCH RSI)

Possible RSI [Loxx]Possible RSI is a normalized, variety second-pass normalized, Variety RSI with Dynamic Zones and optionl High-Pass IIR digital filtering of source price input. This indicator includes 7 types of RSI.
High-Pass Fitler (optional)
The Ehlers Highpass Filter is a technical analysis tool developed by John F. Ehlers. Based on aerospace analog filters, this filter aims at reducing noise from price data. Ehlers Highpass Filter eliminates wave components with periods longer than a certain value. This reduces lag and makes the oscialltor zero mean. This turns the RSI output into something more similar to Stochasitc RSI where it repsonds to price very quickly.
First Normalization Pass
RSI (Relative Strength Index) is already normalized. Hence, making a normalized RSI seems like a nonsense... if it was not for the "flattening" property of RSI. RSI tends to be flatter and flatter as we increase the calculating period--to the extent that it becomes unusable for levels trading if we increase calculating periods anywhere over the broadly recommended period 8 for RSI. In order to make that (calculating period) have less impact to significant levels usage of RSI trading style in this version a sort of a "raw stochastic" (min/max) normalization is applied.
Second-Pass Variety Normalization Pass
There are three options to choose from:
1. Gaussian (Fisher Transform), this is the default: The Fisher Transform is a function created by John F. Ehlers that converts prices into a Gaussian normal distribution. The normaliztion helps highlights when prices have moved to an extreme, based on recent prices. This may help in spotting turning points in the price of an asset. It also helps show the trend and isolate the price waves within a trend.
2. Softmax: The softmax function, also known as softargmax: or normalized exponential function, converts a vector of K real numbers into a probability distribution of K possible outcomes. It is a generalization of the logistic function to multiple dimensions, and used in multinomial logistic regression. The softmax function is often used as the last activation function of a neural network to normalize the output of a network to a probability distribution over predicted output classes, based on Luce's choice axiom.
3. Regular Normalization (devaitions about the mean): Converts a vector of K real numbers into a probability distribution of K possible outcomes without using log sigmoidal transformation as is done with Softmax. This is basically Softmax without the last step.
Dynamic Zones
As explained in "Stocks & Commodities V15:7 (306-310): Dynamic Zones by Leo Zamansky, Ph .D., and David Stendahl"
Most indicators use a fixed zone for buy and sell signals. Here’ s a concept based on zones that are responsive to past levels of the indicator.
One approach to active investing employs the use of oscillators to exploit tradable market trends. This investing style follows a very simple form of logic: Enter the market only when an oscillator has moved far above or below traditional trading lev- els. However, these oscillator- driven systems lack the ability to evolve with the market because they use fixed buy and sell zones. Traders typically use one set of buy and sell zones for a bull market and substantially different zones for a bear market. And therein lies the problem.
Once traders begin introducing their market opinions into trading equations, by changing the zones, they negate the system’s mechanical nature. The objective is to have a system automatically define its own buy and sell zones and thereby profitably trade in any market — bull or bear. Dynamic zones offer a solution to the problem of fixed buy and sell zones for any oscillator-driven system.
An indicator’s extreme levels can be quantified using statistical methods. These extreme levels are calculated for a certain period and serve as the buy and sell zones for a trading system. The repetition of this statistical process for every value of the indicator creates values that become the dynamic zones. The zones are calculated in such a way that the probability of the indicator value rising above, or falling below, the dynamic zones is equal to a given probability input set by the trader.
To better understand dynamic zones, let's first describe them mathematically and then explain their use. The dynamic zones definition:
Find V such that:
For dynamic zone buy: P{X <= V}=P1
For dynamic zone sell: P{X >= V}=P2
where P1 and P2 are the probabilities set by the trader, X is the value of the indicator for the selected period and V represents the value of the dynamic zone.
The probability input P1 and P2 can be adjusted by the trader to encompass as much or as little data as the trader would like. The smaller the probability, the fewer data values above and below the dynamic zones. This translates into a wider range between the buy and sell zones. If a 10% probability is used for P1 and P2, only those data values that make up the top 10% and bottom 10% for an indicator are used in the construction of the zones. Of the values, 80% will fall between the two extreme levels. Because dynamic zone levels are penetrated so infrequently, when this happens, traders know that the market has truly moved into overbought or oversold territory.
Calculating the Dynamic Zones
The algorithm for the dynamic zones is a series of steps. First, decide the value of the lookback period t. Next, decide the value of the probability Pbuy for buy zone and value of the probability Psell for the sell zone.
For i=1, to the last lookback period, build the distribution f(x) of the price during the lookback period i. Then find the value Vi1 such that the probability of the price less than or equal to Vi1 during the lookback period i is equal to Pbuy. Find the value Vi2 such that the probability of the price greater or equal to Vi2 during the lookback period i is equal to Psell. The sequence of Vi1 for all periods gives the buy zone. The sequence of Vi2 for all periods gives the sell zone.
In the algorithm description, we have: Build the distribution f(x) of the price during the lookback period i. The distribution here is empirical namely, how many times a given value of x appeared during the lookback period. The problem is to find such x that the probability of a price being greater or equal to x will be equal to a probability selected by the user. Probability is the area under the distribution curve. The task is to find such value of x that the area under the distribution curve to the right of x will be equal to the probability selected by the user. That x is the dynamic zone.
7 Types of RSI
See here to understand which RSI types are included:
Included:
Bar coloring
4 signal types
Alerts
Loxx's Expanded Source Types
Loxx's Variety RSI
Loxx's Dynamic Zones


[Old] TL with K/K and CustomizationThe old version of Trap Light before the most recent update. In order to facilitate the table functionality that is currently available for Trap Light, I had to make some values that are used in calculations hard-coded. By request, I'm quickly making this version available.
Trap Light
Description
Trap Light is an indicator that uses the K value of the Stochastic RSI to indicate potential long or short entries. It was designed to operate like a traffic stop light that is displayed near the current candle so that you don't have to look away from the candlesticks while trading.
Kriss/Kross is simply a cross over/under strategy that utilizes the 10 EMA and the 50 EMA .
Signals and Available Alerts:
1. Max Sell (Red Sell Label)
When K is equal to 100.00.
This is the strongest sell signal, remember that you only need to make sure that the trend is reversing before you make an entry, because several of these signals can appear in a row if a strong trend hasn't yet reversed.
2. Sell (Red Sell Label)
When K is equal to or greater than 99.50.
A sell signal.
3. Close to Sell (Red Down Arrow)
When K is equal to or greater than 95.00.
A sell signal may be produced soon.
4. Not Ready (Yellow Circle)
When K is less than 95 and greater than 5.00.
This indicates that neither a sell nor buy signal are close to being produced.
5. Close to Buy (Green Up Arrow)
When K is equal to or less than 5.00.
A buy signal may be produced soon.
6. Buy (Green Buy Label)
When K is equal to or less than 0.50 and greater than 0.00.
A buy signal.
7. Max Buy (Green Buy Label)
When K is equal to 0.00.
Strongest buy signal, remember to make sure that the trend is reversing before making an entry.
8. Kriss (Buy)
A buy signal when the 10 EMA (Blue) crosses above the 50 EMA (Yellow). This is also illustrated by the triggering candle being colored blue.
9. Kross (Sell)
A sell signal when the 10 EMA (Blue) crosses below the 50 EMA (Yellow). This is also illustrated by the triggering candle being colored yellow.
Customization of many different options is available, and the code is open-source for your reference, etc.
Remember to do you own due diligence and feel free to leave a comment with questions, etc.

Stochastic with DivergencesReuploading as there was an issue with the description.
This indicator uses the popular Stochastic indicator as its base. I have included the ability to draw divergences on the indicator as they occur live. By default it will be off, select the settings for the indicator and about halfway down there will be a dropdown menu that says "Off". Select it and then select which divergences you want to draw: Regular, Hidden, or Both. I like to draw both. I find that hidden divergence is really nice during a trending market and the regular divergence is works great in a range market. I also feel that the regular divergence is great during a trending market if you are given the signal but then wait for the next price movement for a double top/bottom to occur. The Stochastic indicator itself is often used in a ranging market by selling when it is overbought and buying once it indicates oversold (much like the RSI indicator). I find that it can work in trending markets if you only take overbought in a down trend and oversold in an up trend. In the above picture you can see that I had used it to trade this downtrend using both the Hidden Divergence and Sell Signals to catch the trend continuation until it failed on the fourth trade. From here I would usually start using the Stochastic as simply an oscillating indicator and buy/sell based on overbought/oversold. I've also added an option to enable the Stochastic RSI if you'd rather use that, as well as a fill option which simply colors in the space between the Stochastic and Signal lines. The Signals option will put on highlights of when to buy or sell based on overbought/oversold areas that agree with the long term trend (based on the 200 EMA).
Divergence is a short way of saying there was a higher or lower movement compared to normal but the price did not represent that movement, indicating strength or weakness in a specific direction.
Regular divergence is an indication of a trend reversal. Regular bullish divergence occurs when the price chart shows a lower low while the stochastic shows a higher low. Regular bearish divergence occurs when the price chart shows a higher high while the stochastic shows a lower high.
Hidden divergence is an indication of a trend continuation. Hidden bullish divergence occurs when the price chart shows a higher low while the stochastic shows a lower low. Hidden bearish divergence occurs when the price chart shows a lower high while the stochastic shows a higher high.
The "Only Trending Divergences" option, if enabled, will only show bearish divergences during a down trend (price is below 200 EMA) and only show bullish divergences during an uptrend (price is above 200 EMA). I like to use this option and have set it to ON by default.
The "Middle Filter" option, if enabled, ensures that Highs on the stochastic indicator will not be counted as Highs unless they are above the middle value of the oscillator (which is 50), same goes for lows: they will not be counted as Lows unless they are below the middle value of the oscillator.
I also include buy/sell signals that coincide with the trend (based on the 200 EMA). If price is currently below the 200 EMA and the stochastic indicator is overbought (over 80), you can get a sell signal when it the blue line crosses down below 80. This sell signal shows that you are in a down trend and the price just was overbought but is now likely to continue pushing downwards. The opposite works for buy signals: Above 200 EMA, stochastic goes below 20, when it crosses above 20 it will show a green highlight to indicate price is likely to push upwards.
I think the default options are likely the best to use. The only one I tend to change on occasion is the "Pivots to look back" which I adjust usually to either 1 or 3.
Stoch/RSI with EMA50 Cross & HHLLA hybrid but simple indicator that plots 4 strategies in one pane .
1) RSI Indicator
2) Stoch RSI
3) EMA50 Cross (To determine direction in current timeframe)
4) Higher Highs & Lower Lows to analyze the trend and break of trend
The relative strength index (RSI) is a momentum indicator used in technical analysis. It is displayed as an oscillator (a line graph) on a scale of zero to 100. When the RSI indicator crosses 30 on the RSI chart, it is a bullish sign and when it crosses 70, it is a bearish sign.
The Stochastic RSI (StochRSI) is also a momentum indicator used in technical analysis. It is displayed as an oscillator (a line graph) on a scale of zero to 100. When the StochRSI indicator crosses 20 on the RSI chart, it is a bullish sign and when it crosses 80, it is a bearish sign.
The EMA50Cross denotes two cases in the script:
a) A crossover of CMP on the EMA50 is highlighted by a green bar signals a possible bullish trend
b) A crossunder of CMP on the EMA50 is highlighted by a red bar signals a possible bearish trend
The HHLL is denoted by mneumonics HH, HL,LH, LL. A combination of HHs and HLs denotes a uptrend while the combination of LLs and LHs denoted a downtrend
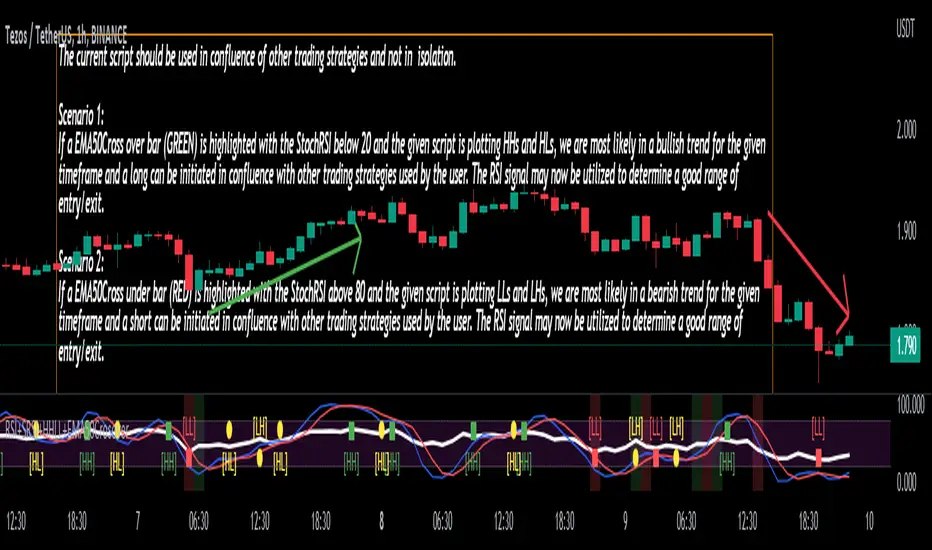
The current script should be used in confluence of other trading strategies and not in isolation.
Scenario 1:
If a EMA50Cross over bar (GREEN) is highlighted with the StochRSI below 20 and the given script is plotting HHs and HLs, we are most likely in a bullish trend for the given timeframe and a long can be initiated in confluence with other trading strategies used by the user. The RSI signal may now be utilized to determine a good range of entry/exit.
Scenario 2:
If a EMA50Cross under bar (RED) is highlighted with the StochRSI above 80 and the given script is plotting LLs and LHs, we are most likely in a bearish trend for the given timeframe and a short can be initiated in confluence with other trading strategies used by the user. The RSI signal may now be utilized to determine a good range of entry/exit.
Disclaimer:
The current script should be used in confluence with other trading strategies and not in isolation. The scripts works best on 4H and 1D Timeframes and should be used with caution on lower timeframes.
This indicator is not intended to give exact entry or exit points for a trade but to provide a general idea of the trend & determine a good range for entering or exiting the trade. Please DYOR
Credit & References:
This script uses the default technical analysis reference library provided by PineScript (denoted as ta)
CryptoCoelloESP----El indicador CryptoCoello es un indicador basado en scalping, se recomienda usar en tendencias de 1,3,5 minutos. Útil para todo tipo de activos y gráficas. El indicador dará una señal de compra cuando el precio haya tenido un desplome grande y llegue a puntos de sobreventa en RSI, RSI stochastic y Volumen diario. Dará señal de compra cuando las 3 sobreventas confluyan. Lo más probable es que el precio rebote en el corto plazo. La única que vez que no funciona es cuando hay un desplome en el activo y por lo tanto da señales falsas mientras sigue bajando, así que es recomendable que entres en la señal de compra solo una vez, si el precio sigue bajando y sigue dando señales no sigas abriendo compras, si se trata de un desplome posiblemente te llegue a dar de 1-4 señales falsas de compra. Los puntos de venta se recomiendan hacer cuando el RSI llegue a sobrecompra o cuando el precio llegue a la línea verde superior del indicador. Se puede usar el indicador solo o se puede usar el indicador como confluencia de tu propia estrategia. EL FUNDAMENTO DEL INDICADOR es ENCONTRAR CONFUELCIAS DE SOBREVENTA en los INDICADORES.
ENG----The CryptoCoello indicator is an indicator based on scalping, it is recommended to use in trends of 1,3,5 minutes. Useful for all types of assets and graphics. The indicator will give a buy signal when the price has had a big crash and reaches oversold points on RSI, Stochastic RSI and Daily Volume. It will give a buy signal when the 3 oversold come together. Most likely, the price will bounce in the short term. The only time it does not work is when there is a crash in the asset and therefore it gives false signals while it continues to fall, so it is recommended that you enter the buy signal only once, if the price continues to fall and continues to give signals do not continue to open purchases, if it is a crash it may give you 1-4 false purchase signals. Sell points are recommended to be done when the RSI becomes overbought or when the price reaches the upper green line of the indicator. You can use the indicator alone or you can use the indicator as a confluence of your own strategy. THE RATIONALE OF THE INDICATOR is TO FIND OVERSOLD CONFUELCIAS in the INDICATORS.

2 Ema Pullback StrategyHi everyone!
CAUTION... This is only an indicator. Do not rely 100% on it.
I made this indicator hoping to help everyone with this specific Pull Back Scalping Strategy.
RULES:
Time Chart of 5minuts
LONG Condition - "EMA Red Line" below the "EMA Blue Line" and wait for a green long signal.
SHORT Condition - "EMA Red Line" below the "EMA Blue Line" and wait for a red short signal
Feel free to add any adjustments or give feedback so we can improve.
The strategy idea and guidelines came from "The Master" Juan Luis.
Autor: © Germangroa

Ultimate Custom MTF ScreenerThis indicator will allow you to make your custom TradingView MTF screener without coding. Add it to the chart, select up to 10 instruments, 4 timeframes, and 4 indicators, and the screener will do the rest for you. The indicator will form a lovely table with all values and highlighted signals.
The screener is highly customizable, and you can choose its position on the chart, sorting, order of the columns, and colors for the tables. You can easily change parameters for all supported indicators and their signals.
Currently, there are 21 different custom indicators available. Current list of indicators:
Average Directional Index (ADX) - displaying the value of ADX and checking if it's higher than the threshold
Average True Range (ATR) - showing the value of ATR
Awesome Oscillator (AO) - displaying the value of AO and highlighting positive/negative values.
Bollinger Bands (BB) - showing if the price is above/below/in the channel.
Breakout Pivots - Displaying when the price is below/above the most recent pivot low/high.
Commodity Channel Index (CCI) - shows the last CCI value and highlights overbought/oversold values.
Directional Movement Index (DMI) - Up/Down signal (+DI above or below -DI)
Donchian Channel (DC) - showing if the price is above/below/in the channel.
Heikin Ashi Count (HAC) - What is the current Heikin Ashi candle color and for how long was this color?
Historical Volatility (HV) - Current value of Historical Volatility
Keltner Channel (KC) -showing if the price is above/below/in the channel.
Moving Average Convergence Divergence (MACD) - Up/Down signal (MACD above / below signal)
Moving Average Crossover (MA Cross) - Displaying MA crosses signals (SMA, EMA, WMA, HMA, VWMA, SMMA, DEMA, VWAP supported)
Moving Average Distance (MA DIST) - Displaying distance to the MA (SMA, EMA, WMA, HMA, VWMA, SMMA, DEMA, VWAP supported)
Parabolic Stop and Reverse (PSAR) - Up or Down
Relative Strength Index (RSI) - Displaying the last RSI value and highlighting overbought/oversold values.
Stochastic (STOCH) - Displaying the last Stochastic value and highlighting overbought/oversold values.
Stochastic RSI (STOCH RSI) - Displaying the last Stochastic RSI value and highlighting overbought/oversold values.
SuperTrend - Current state of the SuperTrend.
Trailing Stop-Loss (TSL) - Up or Down
True Strength Index (TSI) - Displaying the last TSI value and highlighting overbought/oversold values.
We're already working on adding a few more supported indicators. If you have any ideas about the indicators you want to see in our screener, contact us, and we'll consider them.
Disclaimer
Please remember that past performance may not be indicative of future results.
Due to various factors, including changing market conditions, the strategy may no longer perform as well as in historical backtesting.
This post and the script don’t provide any financial advice.

2 EMA PullbackHi everyone!
CAUTION... This is only an indicator. Do not rely 100% on it.
I made this indicator hoping to help everyone with this specific Pull Back Scalping Strategy.
RULES:
Time Chart of 5minuts
Long Condition - "EMA Red Line" below the "EMA Blue Line" and wait for a green long signal.
Short Condition - "EMA Red Line" below the "EMA Blue Line" and wait for a red short signal
Feel free to add any adjustments or give feedback so we can improve.
The strategy idea and guidelines came from the "Master Juan Luis"
Autor: © Germangroa
TrapLightTrap Light is built off the stochastic RSI to provide convenience and make your entries while scalping either long/short more straightforward.
Notes/Disclaimer:
This indicator is not guaranteed to work every time. Use it at your own discretion and perform your own due diligence. None of this is financial advice.
The main idea behind this is that when the stochastic RSI reaches such extremes that it often moves in a favorable direction.
K = momentum or the blue line of the stochastic RSI indicator.
Perks:
Don't have to look away from candlesticks and measure stochastic RSI's K level.
Simple visual indication of what to do.
Don't have to stare at your chart all day waiting for things to get exciting.
How to Use:
(Above the current candlestick on any timeframe)
1. When K is greater than or equal to 99.5, it shows a sell signal. This is to indicate a short entry.
2. When K is less than or equal to 0.5, it shows a buy signal. This is to indicate a long entry.
3. If neither the conditions for a short/long entry are present, it shows a circle that is like a traffic light.
Red Light: When K is between 99.5 and 95, a red circle is shown to indicate that a short entry may be available soon.
Yellow Light: When K is between 95 and 5, a yellow circle is shown to indicate that neither a long nor short entry may be available soon.
Green Light: When K is between 5 and 0.5, a green circle is shown to indicate that a long entry may be available soon.
Alerts:
Set an alert on the ticker you trade to notify you when either the green or red light is present so that you have time to prepare to make an entry either long/short.
The Code:
The PineScript is open-source and annotated to explain different parts of the script for ease of understanding.
@Credit to Kingson1 for this strategy and his feedback on its creation/implementation.

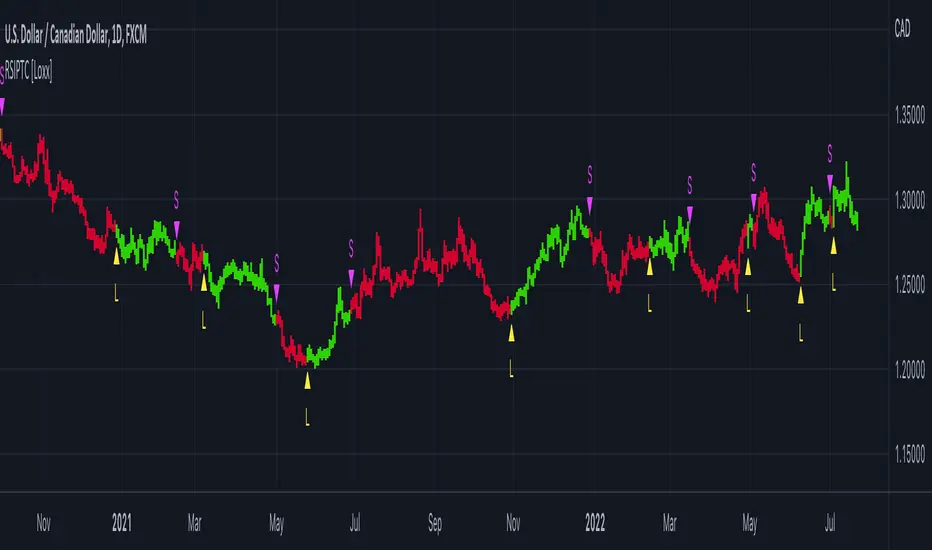
RSI Precision Trend Candles [Loxx]RSI Precision Trend Candles is a candle coloring indicator that uses an average range algorithm to determine trend direction. The precision trend algorithm can be used on any calculated output to tease out interesting trend information.
What is RSI?
The relative strength index (RSI) is a momentum indicator used in technical analysis. RSI measures the speed and magnitude of a security's recent price changes to evaluate overvalued or undervalued conditions in the price of that security.
The RSI is displayed as an oscillator (a line graph) on a scale of zero to 100. The indicator was developed by J. Welles Wilder Jr. and introduced in his seminal 1978 book, New Concepts in Technical Trading Systems.
Included
Bar coloring
Signals
Alerts
Loxx's Expanded Source Types
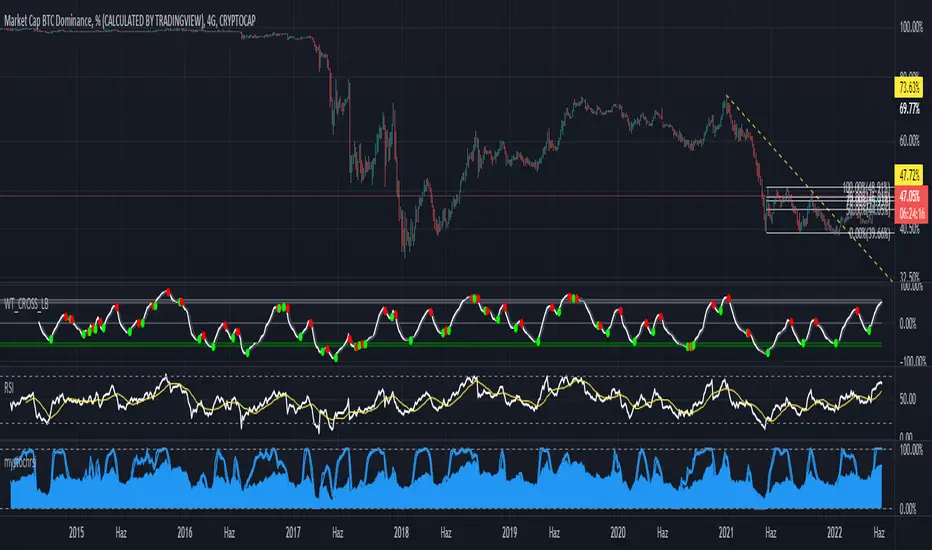
TTP 3-checkmarks CCU market bottomThis indicator is an implementation of the method published by Steve from Crypto Crew University .
I didn't design this strategy, I'm only implementing it to allow people to be able to backtest it or set trading view alerts based on the original criteria.
This indicator can be backtested with Gavin's backtester, TTPTSL and any other indicator that can take a 1 as an external signal to buy.
How to use:
- add to INDEX:BTCUSD
- set the timeframe to 2D
Indicator parameters
- RSI 14
- stochastic RSI 3 3 14 14
- MA 200
- all in 2 day timeframe and using the close as source
Strategy:
- price needs to be below 200 MA
- RSI < 26
- stochastic rsi both lines below 20
- price should not be crossing the MA ( I added this to remove one signal that Steve also manually removed in the video)
I recommend watching his video to understand how it's supposed to work in more detail.
youtu.be
It's interesting to see that there are a few more signals that are fairly good but are being marked as invalid in the video even though they seem to fulfil the 3 checkmarks too. I left a question in the video to learn why and if it's intended. I'll keep you posted.

Neo's %KIn my opinion the %K is the only part of the stochastic that you actually need. It's the fast RSI, so it responds much better to large price movements and reveals divergence a lot sooner than %D. The %D has no real confluence with the rest of my strategy so, I only use %K.

mystochrsirsi + stochrsi
Indicator where rsi and stoch rsi are both together. Please adjust the color etc settings from the style tab.
Stoch RSI, Div, Zone S3 by Gammaprod>> How to use this indicator :
1. Set your teadingview theme to dark theme.
2. My indicator is valid for forex, stock and but more valid for crypto.
3. Use three timeframe for more validation (choose between those, that fit to your trading style) :
- Timeframe 1m, 5m, and 15m for Scalping
- Timeframe 30m, 1h and 4h for Intraday
- Timeframe 4h, 1D and 1W for Swing Trading
4 . Always use THREE INDICATORS FROM GAMMAPROD, those three indicators is back to back each other, by the way, I only made those three indicators only (for now) :
- Trendlines Boll Ichi Crypto by Gammaprod
- Stoch RSI Divs Zone Crypto by Gammaprod
- MACD Volume Crypto by Gammaprod
>> How to setting :
1. Trendlines Boll Ichi Crypto by Gammaprod
A. Support and Resistence
- Well if you familiar with this indicator you can add it, but recommended for Timeframe 30m or more
B. Trendlines Primary or Trendlines Secondary
- Timeframe 1m you DON'T NEED Trendlines Primary or Trendlines Secondary
- Timeframe 5m you DON'T NEED Trendlines Secondary, but you CAN ADD Trendlines Primary if you fell it helpful (for me, it is helpful to find where the candles start or the end trend or a consolidation or where the candles will surpass a resistance or a support).
- Timeframe 15m you DON'T NEED Trendlines Secondary, DEFENITELY add Trendlines Primary it will help to find where the candles stop or a consolidation or where the candles will surpass a resistance or a support).
- Timeframe 30m or more, DEFENITELY NEED BOTH Trendlines Primary and Secondary Trendlines, it will help to find where the candle stop or consolidation or where the candle will surpass a resistance or support).
C. Bolinger, Ichimoku Cloud and Lagging Span
- Please DON'T CHANGE IT at all, it's really helpful to know when and where to make an entry decesion or a trend or a consolidation, if you don't understand how to read it, you better to learn it first (on "how to read" section and "How to OPEN position" the section below)
2. Stoch RSI Divs Zone Crypto by Gammaprod (DON'T CHANGE IT)
3. MACD Volume Crypto by Gammaprod (DON'T CHANGE IT)
>> How to read :
1. Sell or Buy Priority :
A. Buy Priority
- Color background on macd and stoch rsi is pink or purple sell is the priority, (if you're not sure to buy, just wait until the best moment to sell)
B. Buy Priority
- Color background on macd and stoch rsi Teal or light green buy is the priority, (if you're not sure to sell, just wait until the best moment to buy)
C. Indecision / Golden Moment
- Color background on stoch rsi yellow is indecision / golden moment of reversal pattern (wait until it formed background only on Stoch RSI), please becareful at this moment.
2. Trend / Consolidation :
A. BULLISH trend
- When Stoch RSI and MACD have teal or light green background that's means BULLISH trend, better to confirm by the candle is above green cloud and lagging span (red line) is also above the candle.
B. BEARISH trend
- When Stoch RSI and MACD have the Pink or purple background that's means BEARISH trend, better to confirm by the candle is above purple cloud and lagging span (red line) is also below the candle.
C. CONSOLIDATION
- When Stoch RSI have the mix background that's means CONSOLIDATION, better to confirm by the candle is in or near to green / purple cloud and lagging span (red line) is also on the candle.
3. Special Mark
A. Ideal Bullish :
- Near line 20 and green / teal background = When Stoch RSI have the char R / H on lime color label, that's means divergence or hidden divergence for buy position, if you not see this label that's means just a standard confirmation for buy
B. Not an Ideal Bullish :
- Near line 80 and green / teal background = if this happens make sure you know what happen, it could be a false signal or bullish continual pattern
C. Ideal Bearish :
- Near line 80 and pink / purple background = When Stoch RSI have the char R / H on lime color label, that's means divergence or hidden divergence for buy position, if you not see this label that's means just a standard confirmation for sell position.
D. Not an Ideal Bearish:
- Near line 20 and pink / purple background = if this happens make sure you know what happen, it could be a false signal or bearish continual pattern
E. The Beginning of Reversal (from BEARISH to BULLISH) :
- When Stoch RSI line shaping GREEN position is near 20.
- MACD lines still PINK, position lines is UNDER the HISTOGRAM, but the HISTOGRAM start to SHAPE FALL PINK (light pink) and the BACKGROUND still PINK / PURPLE.
- Position CANDLES NEAR BLUE line, NEAR PURPLE CLOUD, and lagging span (red line) STILL ON the area candle. (it used to be confirmed with the golden moment).
F. The Beginning of Reversal (from BULLISH to BEARISH) :
- When Stoch RSI line shaping PINK position is near 80.
- MACD lines still GREEN, position lines is ABOVE the HISTOGRAM, but the HISTOGRAM start to SHAPE FALL GREEN (light green) and the BACKGROUND still TEAL / GREEN.
- Position CANDLES NEAR WHITE line, NEAR TEAL CLOUD, and lagging span (red line) STILL ON the area candle. (it used to be confirmed with the golden moment).
G. False Signals, or It could be a Golden Moment (better to see it on TF 15 or bigger):
- Near line 20 or 80 and yellow background = When Stoch RSI have the char R / H on color label, that's means divergence or hidden divergence for buy / sell position, if you not see this label that's means just a standard confirmation for buy / sell depends on where the Stoch RSI line if near 20 that's means buy, near 80 means sell
>> How to OPEN position:
A. Bullish
1. Trendlines Boll Ichi Crypto by Gammaprod
- The candles above the green cloud.
- Lagging span (red line) above the candles.
- then open buy near yellow line (the first option) / blue line (the second option) (always confirm the position with two other indicators below).
2. Stoch RSI Divs Zone Crypto by Gammaprod
- Teal or Green background.
- The lines is shaping green.
- Better if on the bottom (at a range 20).
3. MACD Volume Crypto by Gammaprod
- Teal or Green background.
- The lines is shaped or shaping green.
- Better if at the green histogram.
B. Bearish
1. Trendlines Boll Ichi Crypto by Gammaprod
- The candles below the purple cloud.
- Lagging span (red line) below the candles.
- then open buy near yellow line (the first option) / white line (the second option) (always confirm the position with two other indicators below).
2. Stoch RSI Divs Zone Crypto by Gammaprod
- Pink or purple background.
- The lines are shaping pink.
- Better if the line on the top (at a range 80).
3. MACD Volume Crypto by Gammaprod
- Pink or purple background.
- The lines are shaped or shaping green.
- Better if at the pink histogram.
C. Consolidation
1. Trendlines Boll Ichi Crypto by Gammaprod
- The candles on the cloud (green or purple).
- Lagging span (red line) on the candles.
- then open buy near the white or blue line (always confirm the position with two other indicators below).
2. Stoch RSI Divs Zone Crypto by Gammaprod
- Mix background specially on a timeframe 15m or more.
- The line move fast up and down.
- Better if on the bottom or the top of the lines (at a range 20 or 80).
3. MACD Volume Crypto by Gammaprod
- Changing the background.
- The line is near the middle line.
- Have small Histogram.
>> The secret ingridient is comparing the timeframe :
The example scalping (Timeframe 1m, 5m and 15m)
- TF 1m is for making an open position.
- TF 5m is for making a judgement of the trend market.
- TF 15m is to confirm that judgement from TF 5m, be careful if it not similar then it used to be a consolidation or the beginning of the reversal.
There's a lot a way to open the position than above information that i gave it to you, but consider there are a limit char on this column, I hope it will help your trading and make a more profit on it.

Vix FIX / Stochastic Weights StrategyThis script is based off of Chris Moody's Vix Fix Indicator modified by OskarGallard and BigBitsIO's Stochastic Weights.
This script is a compilation of several different stochastic indicators (and RSI ) where the K value of each indicator is equally weighted. The purpose of the indicator is to combine many indicators together in a fashion that weights them easier. By default, the Stochastic and Stochastic RSI are both enabled - the idea is to speed up the relatively slower Stochastic and to slow down the relatively fast Stochastic RSI . BigBitsIO's Stochastics are also available that can also be added to the weighted calculation. Only the K value is weighted, as the D value is just a moving average of the weighted K.
- Why is this modifed stochastic useful?
- To weight multiple indicators together so that you can attempt to find optimal values shared amongst the indicators. Ex: If Stochastic RSI is 100 and Stochastic is 50, K would be 75 and not particularly high. If you add in a 50 RSI , the K would be 67 in this example. If we weight indicators together that all have a high value they could potentially help find elements that align together to produce a stronger signal.
In this script we have the red "S" triangles which are Exits (overbought stochastic crosses).
Added alerts for stochastic exit signals. Alerts are Pre-Set to only Alert on Bar Close.
The "Williams Vix Fix" is one of the most reliable indicators in history for finding market bottoms. The Vix Fix is simply a code from Larry Williams creating almost identical results for creating the same ability the Vix has to all assets.
The VIX has always been much better at signaling bottoms than tops. Simple reason is when market falls retail traders panic and increase volatility , and professionals come in and capitalize on the situation. At market tops there is no one panicking... just liquidity drying up.
The FE green triangles are "Filtered Entries".
The AE green triangles are "Aggressive Filtered Entries".
Added Alerts to Williams Vix Fix (Aggressive Entry and Filtered Entry). Alerts are Pre-Set to only Alert on Bar Close.
Added "Ehlrers StochCCI" indicator of user @glaz
The Ehlrers StochCCI is a variation of Ehlers Stochastic RSI replaced with CCI.
The John Ehlers' article in August, 2006, "Modeling The Market = Building Trading Strategies," describes a process for extracting trend and cyclic elements from market data, then recombining them for trading purposes. He used the Stochastic RSI denoted the cyclic elements.
Added ability to show Dots when StochCCI Crosses.
Sell: fuchsia dots.
Buy: green dots.
Added alerts for (Buy / Sell) StochCCI. Alerts are Pre-Set to only Alert on Bar Close.
DISCLAIMER: For educational and entertainment purposes only. Nothing in this content should be interpreted as financial advice or a recommendation to buy or sell any sort of security or investment including all types of crypto. DYOR, TYOB.

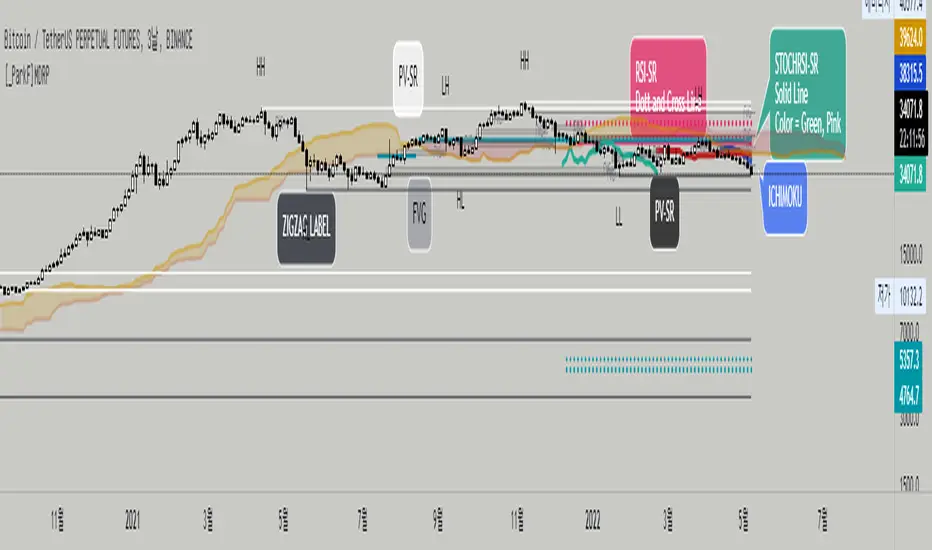
[_ParkF]MDRPThis indicator indicates that 'Momentum Discrepancy Reversal Point' = 'MDRP'.
Mixing and modifying several general indicators to find support and resistance
It is created to predict the change point of the trend by overlaying it on the chart.
The 4 support and resistance lines are drawn live, and the changed support and resistance lines are
It erases the line and overlays it again with a new line.
For each support and resistance , you can modify the color or line thickness, number of expressions, etc. in the input menu.
1. _____RSI-SR
Based on Wilder's RSI formula, overbought and oversold
Changes are detected and overlaid on the chart in the form of 2 resistances and 2 supports.
2. _____STOCHRSI-SR
Using the general stochastic and Wilder's RSI calculations,
Detect changes in overbought and oversold areas
It overlays the chart in the form of 1 resistance and 1 support.
3. _____PV-SR
Pivot-based support and resistance will be overlaid on the chart,
By default, 10 pivot lines are drawn, but by modifying the count in the input menu,
You can modify the number of overlays.
4. _____FVG
'Fair value gaps' refers to gaps within consecutive candles.
This section is overlaid in the form of a box,
The default is to draw 10 FVG boxes, but set count in the input menu.
You can modify the number of overlays by editing.
5. _____ZIGZAG
This is to find MDRP by overlaying the low and high prices of the current trend on the chart.
ZIGZAG labels near supports and resistances of 1, 2, 3 and 4 can increase the reliability of the MDRP.
The default value of live in the input menu is true, but if it is false, the closing price is checked and drawn.
Reduce false signals.
6. _____ICHIMOKU
The 5 lines of ICHIMOKU were overlaid with the default values of 9, 26, 52, 26,
Lines other than LeadLine A and B that are overlaid on the chart are overlaid on the chart only as much as the period value of each line.
* The _____FVG indicator cited the source of 'makuchaku'.
------------------------------------------------------------------------------------------------------------------------------------------------------------------------
이 지표는 'Momentum Discrepancy Reversal Point' = 'MDRP'를
찾기 위해 여러개의 일반적 지표들을 혼합, 수정하여 지지와 저항의 형태로
차트에 overlay 시켜 트렌드의 변화 지점을 예측 하기 위해 만들어졌습니다.
4개의 지지와 저항선은 실시간으로 그려지게 되며, 변화된 지지와 저항은 기존의
선을 지우고 새로운 선으로 다시 표시 됩니다.
각 지지와 저항은 input 메뉴에서 색 또는 선의 두께, 표현할 개수 등을 수정할 수 있습니다.
1. _____RSI-SR
Wilder's RSI 계산식을 기반으로 과매수, 과매도 영역에서의
변화를 감지하여 2개의 저항과 2개의 지지의 형태로 차트에 표시 됩니다.
2. _____STOCHRSI-SR
일반적 스토캐스틱과 Wilder's RSI의 계산식을 이용하여
과매수, 과매도 영역에서의 변화를 감지하여
1개의 저항과 1개의 지지의 형태로 차트에 표시됩니다.
3. _____PV-SR
Pivot을 기반으로 한 지지와 저항을 차트에 표시 하게 되며,
기본값은 10개의 Pivot선이 그려지게 되지만 input 메뉴에서 count를 수정하여
표시할 개수를 수정할 수 있습니다.
4. _____FVG
'Fair value gaps'는 연속된 캔들 안에서의 갭 구간을 말합니다.
이 구간을 박스의 형태로 표시한 것이며,
기본값은 10개의 FVG 박스가 그려지게 되지만 input 메뉴에서 count를
수정하여 표시할 개수를 수정할 수 있습니다.
5. _____ZIGZAG
현재 트렌드의 저가와 고가를 차트에 표시하여 MDRP를 찾기 위한 것으로
1, 2, 3, 4의 지지와 저항 부근에서의 ZIGZAG 라벨은 MDRP의 신뢰도를 높혀줄 수 있습니다.
input 메뉴에서의 live 기본값은 체크되어 있지만 체크를 해제하면 종가를 확인하고 그려지기에
거짓 신호를 줄일 수 있습니다.
6. _____ICHIMOKU
ICHIMOKU의 5개의 선은 기본값인 9, 26, 52, 26으로 표시하였으며,
차트에 표시되는 선행스팬 1과 2를 제외한 전환선, 기준선, 후행스팬은 각 선의 기간값만큼만 차트에 표시 되게 하였습니다.

[_ParkF]MDRPThis indicator indicates that 'Momentum Discrepancy Reversal Point' = 'MDRP'.
Mixing and modifying several general indicators to find support and resistance
It is created to predict the change point of the trend by overlaying it on the chart.
The 4 support and resistance lines are drawn live, and the changed support and resistance lines are
It erases the line and overlays it again with a new line.
For each support and resistance, you can modify the color or line thickness, number of expressions, etc. in the input menu.
1. _____RSI-SR
Based on Wilder's RSI formula, overbought and oversold
Changes are detected and overlaid on the chart in the form of 2 resistances and 2 supports.
2. _____STOCHRSI-SR
Using the general stochastic and Wilder's RSI calculations,
Detect changes in overbought and oversold areas
It overlays the chart in the form of 1 resistance and 1 support.
3. _____PV-SR
Pivot-based support and resistance will be overlaid on the chart,
By default, 10 pivot lines are drawn, but by modifying the count in the input menu,
You can modify the number of overlays.
4. _____FVG
'Fair value gaps' refers to gaps within consecutive candles.
This section is overlaid in the form of a box,
The default is to draw 10 FVG boxes, but set count in the input menu.
You can modify the number of overlays by editing.
5. _____ZIGZAG
This is to find MDRP by overlaying the low and high prices of the current trend on the chart.
ZIGZAG labels near supports and resistances of 1, 2, 3 and 4 can increase the reliability of the MDRP.
The default value of live in the input menu is true, but if it is false, the closing price is checked and drawn.
Reduce false signals.
6. _____ICHIMOKU
The 5 lines of ICHIMOKU were overlaid with the default values of 9, 26, 52, 26,
Lines other than LeadLine A and B that are overlaid on the chart are overlaid on the chart only as much as the period value of each line.
* The _____FVG indicator cited the source of 'makuchaku'.
------------------------------------------------------------------------------------------------------------------------------------------------------------------------
이 지표는 'Momentum Discrepancy Reversal Point' = 'MDRP'를
찾기 위해 여러개의 일반적 지표들을 혼합, 수정하여 지지와 저항의 형태로
차트에 overlay 시켜 트렌드의 변화 지점을 예측 하기 위해 만들어졌습니다.
4개의 지지와 저항선은 실시간으로 그려지게 되며, 변화된 지지와 저항은 기존의
선을 지우고 새로운 선으로 다시 표시 됩니다.
각 지지와 저항은 input 메뉴에서 색 또는 선의 두께, 표현할 개수 등을 수정할 수 있습니다.
1. _____RSI-SR
Wilder's RSI 계산식을 기반으로 과매수, 과매도 영역에서의
변화를 감지하여 2개의 저항과 2개의 지지의 형태로 차트에 표시 됩니다.
2. _____STOCHRSI-SR
일반적 스토캐스틱과 Wilder's RSI의 계산식을 이용하여
과매수, 과매도 영역에서의 변화를 감지하여
1개의 저항과 1개의 지지의 형태로 차트에 표시됩니다.
3. _____PV-SR
Pivot을 기반으로 한 지지와 저항을 차트에 표시 하게 되며,
기본값은 10개의 Pivot선이 그려지게 되지만 input 메뉴에서 count를 수정하여
표시할 개수를 수정할 수 있습니다.
4. _____FVG
'Fair value gaps'는 연속된 캔들 안에서의 갭 구간을 말합니다.
이 구간을 박스의 형태로 표시한 것이며,
기본값은 10개의 FVG 박스가 그려지게 되지만 input 메뉴에서 count를
수정하여 표시할 개수를 수정할 수 있습니다.
5. _____ZIGZAG
현재 트렌드의 저가와 고가를 차트에 표시하여 MDRP를 찾기 위한 것으로
1, 2, 3, 4의 지지와 저항 부근에서의 ZIGZAG 라벨은 MDRP의 신뢰도를 높혀줄 수 있습니다.
input 메뉴에서의 live 기본값은 체크되어 있지만 체크를 해제하면 종가를 확인하고 그려지기에
거짓 신호를 줄일 수 있습니다.
6. _____ICHIMOKU
ICHIMOKU의 5개의 선은 기본값인 9, 26, 52, 26으로 표시하였으며,
차트에 표시되는 선행스팬 1과 2를 제외한 전환선, 기준선, 후행스팬은 각 선의 기간값만큼만 차트에 표시 되게 하였습니다.
Stochastic OB/OS Zones HeatmapThe code is based on the Stochastic RSI Heatmap, but uses a normal Stochastic instead the Stochastic RSI when calculating "k" for more accuracy. Credit for the idea goes to Indicator-Jones.
The heatmap starts from the oversold (20) / overbought (80) levels respectively. The more oversold / overbought the price, the more intense the color (blue / fuchsia)

MTF Stochastic Zones w/ Candle and Swing Hi/Lo IndicatorsMTF Stochastic Zones w/ Candle and Swing Hi/Lo Indicators by // © KaizenTraderB
This indicator will display the Stochastic RSI as color zones utilizing 3 Timeframes of your choice as well as key reversal candles:
Entry Timeframe StochRSI Crossovers and Long Wick Reversal Candles (Hammer and Hanging Man) and Engulfing Candles
That correlate with Swing Highs and Lows.
When the higher timeframe is bullish it will be green and when bullish, red.
When the middle timeframe is counter the higher, it will appear brownish.
The entry timeframe will print Candle Labels and Swing Highs and Lows at bullish and bearish Stochastic RSI crossovers when oversold and overbought, respectively,
In the direction of the higher timeframe directional bias when the middle timeframe is counter that direction to catch reversals in corrections.
(It also prints Bull/Bear StochRSI Crossovers that correlated with Swing Highs and Lows that are not Hammers, Hanging Men or Engulfing Candles.)
The options allow you to turn the zones, swing highs and lows, candle indicators and entry StochRSI Crossovers on and off, as well as which Timeframes you choose to view.
Entry - 1Hr, 15m, 5m or 1m Middle Timeframe - Daily, 4Hr, 1Hr or 15m Higher Timeframe - Monthly, Weekly, Daily, 4Hr or 1Hr
You can change the Swing High and Low Lookback periods, as well as
The Stochastic RSI Lookback for each of the three timeframes and the level of Overbought and Oversold:
When 8 is chosen for RSI Lookback, Stochastic Lookback = 5, SmoothK = 3, Smooth D = 3 For 13 - 8, 5, 5 For 21 - 13, 8, 8 For 34 - 21, 13, 13
Its good practice to adjust settings so Higher Timeframe zones (green/red) correlate with longer trend movements,
Medium Timeframe with corrections and reversal areas (brown) and Entry Timeframe with key reversal candles.
For example, to adjust the Daily Higher Timeframe, turn the Higher Timeframe to Daily, turn off the others and bring up the Daily Chart.
Look at chart for last 200 bars or so and go through the different settings until you find the one that best correlates with recent past price action.
Do the same procedure for the Middle and Entry Timeframe. Once all the settings are how you prefer, view the Indicator on the Entry Timeframe to find trades.
Coding included to prevent repainting
Can be used in conjunction with the MTF Stochastic RSI w/ Zones which is displayed in the lower panel.
Need the same settings in both indicators for them to correlate or use different settings for different views,
Message me with feedback to improve upon this indicator or requested additions.
I will soon be releasing a Strategy based on this indicator!

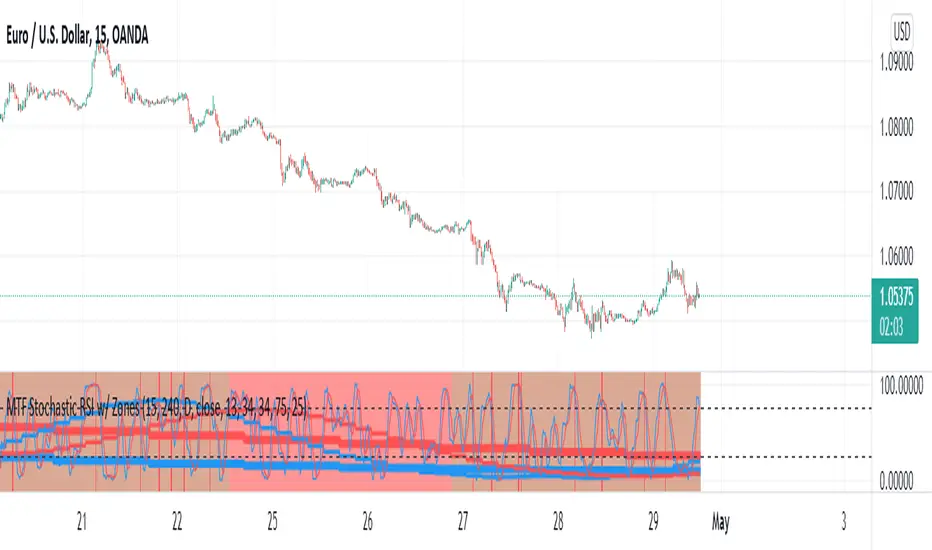
MTF Stochastic RSI w/ ZonesMTF Stochastic RSI w/ Zones by // © KaizenTraderB
I revamped my original Stochastic RSI Band indicator with more accurate algorithms, cleaner coding and more adjustable options.
I will be soon releasing a variation of this indicator that prints over price chart with key candle indicators
This indicator will display the Stochastic RSI in 3 Timeframes of your choice.
It will also display color zones. When the higher timeframe is bullish it will be green and when bullish, red.
When the middle timeframe is counter the higher, it will appear brownish.
The entry timeframe will print red and green lines at bullish and bearish Stochastic RSI crossovers when oversold and overbought, respectively,
In the direction of the higher timeframe directional bias when the middle timeframe is counter that direction to catch reversals in corrections.
The options allow you to turn the lines and zones on and off, as well as which Timeframes you choose to view.
Entry - 1Hr, 15m, 5m Middle Timeframe - 1Hr, 4Hr, Daily Higher Timeframe - 4Hr, Daily, Weekly or Monthly
You can also change the parameters of the Stochastic RSI for each of the three timeframes:
When 8 is chosen for RSI Length, Stochastic Length - 5, SmoothK - 3, Smooth D - 3 For 13 - 8, 5, 5 For 21 - 13, 8, 8 For 34 - 21, 13, 13
Its good practice to adjust settings so Higher Timeframe zones (green/red) correlate with longer trend movements,
Medium Timeframe with corrections and reversal areas (brown) and Entry Timeframe with key reversal candles.
Look at chart for last 200 bars or so and find the settings that correlate with recent past price action and adjust accordingly.
Its also good practice to have the chart timeframe correlate with entry timeframe of indicator.
You can also adjust overbought and oversold areas.
Coding included to prevent repainting
Message me with feedback to improve upon this indicator or requested additions.
Stochastic RSI BandsStochastic RSI Bands by // © drbarry92064859
It is suggested to view this indicator on 15m or 5m timeframe with current Default Settings.
This indicator is based on the StochRsi.
It creates color bands based on the direction of multiple timeframe StochRsi.
When the MTF StochRsi's are opposed in direction it produces darker bands and when aligned in direction it produces light bands.
During Green Bands, price tends to be Bullish. During Red Bands, price tends to be Bearish.
During Medium toned Bands, price action tends to be in a correction in existing HTF trend, ranging, or getting ready for reversal.
During Light Bands, price tends to be in Trend in direction of color.
There is usually Dark Bands on either side of a light or medium toned band.
Best to enter in direction of current color, during the dark band after the medium toned bands
And exit in the dark band after the light toned band.
Brown bands tend to indicate reversal of direction and color.
I have experimented with all the timeframes and StochRSI settings and found the best settings to be as follows.
The Default settings are Middle Time Frame: 4H and Higher TimeFrame: D1.
The Default StochRSI settings are 34 RSI, 21 Stochastic, 13 smooth K and 13 smooth D.
It is suggested to use a lower timeframe such as 15m or 5m for entry.
You can experiment with different StochRSI and TimeFrame Settings.
SUGGESTED STRATEGY
Dark Bands after medium toned bands: Look for an entry on lower timeframe (15m or 5m) based on reversal candlestick formations or other indicators in direction of current color.
Light Bands: Do not enter during lighter bands. You should already be in trade during Light Bands
Light Band changes to Dark Band: Exit Trade if already in.
Look for general change of directional bias if a brown band occurs; however wait for dark band after the 2nd wide band following the brown band.