RSI with J-Line ***For ease of use, I recommend changing the J Histogram to a line indicator, then it works like the KDJ Stochastic indicator. Full disclosure, I created this script with the help of GPT. This script was inspired by the KDJ Stochastic indicator by Dreadblitz***
The "RSI with J-Line" script is essentially a modified Relative Strength Index (RSI) indicator with an added histogram component. Here's how to use the different components of the script:
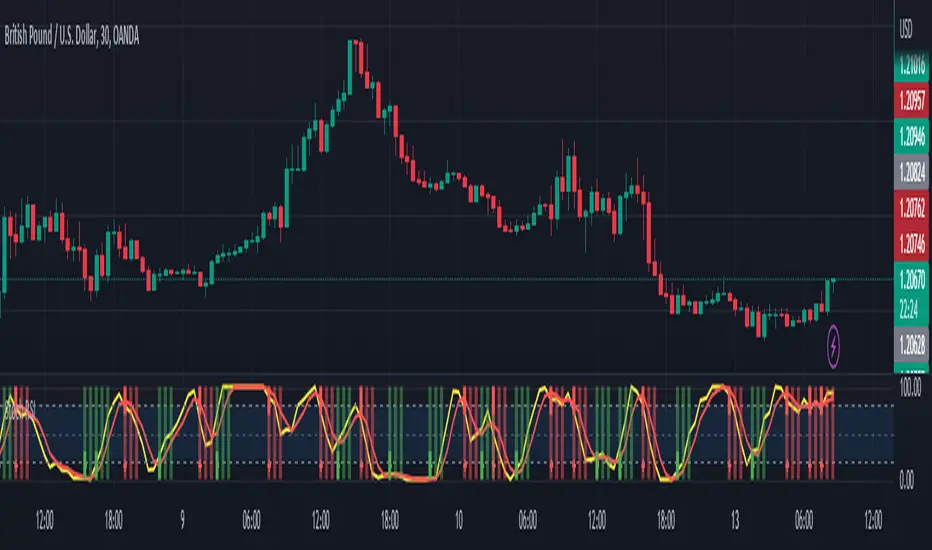
RSI Line (Blue): The RSI is a momentum oscillator that measures the speed and change of price movements. It oscillates between zero and 100, and is typically used to identify overbought and oversold conditions in a market. Traditionally, readings over 70 are considered overbought, and readings under 30 are considered oversold. However, these are not strict rules and can vary depending on the market and the overall trend.
RSI Smooth Line (Orange): This is the simple moving average of the RSI. It helps to smooth out the RSI and to identify the overall trend of the momentum. When the RSI line crosses above the RSI Smooth line, it might indicate that the momentum is moving upwards. When the RSI line crosses below the RSI Smooth line, it might indicate that the momentum is moving downwards.
RSI J-Line (Red Histogram): The J-Line is an additional line that's calculated as 3*rsiSmooth - 2*rsi. It's similar to the %J line in the Stochastic indicator and is designed to provide quicker signals than the RSI or RSI Smooth line. When the histogram is above the 0 line, it might indicate bullish momentum. When it's below the 0 line, it might indicate bearish momentum.
Please note that these interpretations are standard for these types of indicators, but actual market behavior can be complex and is influenced by many factors. Indicators should be used as part of a comprehensive trading strategy, not in isolation. Always take into account other market information and indicators before making trading decisions.
Indicador Pine Script®