heiken-stochThis model has two system
1. is the well known heiken (lime or red)
2. stoch cross up or down in relation to volume indicator (B or S)
alerts inside
have fun
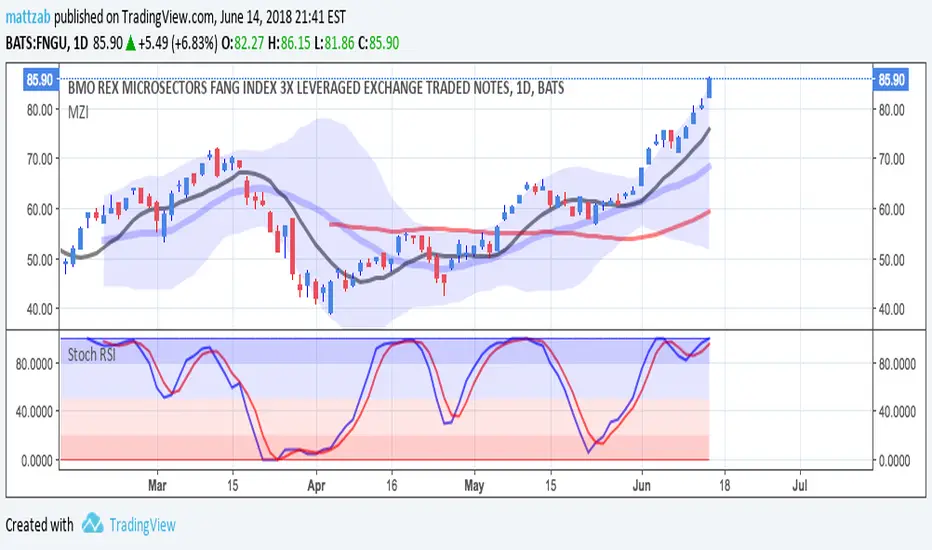
RSI Estocástico (STOCH RSI)

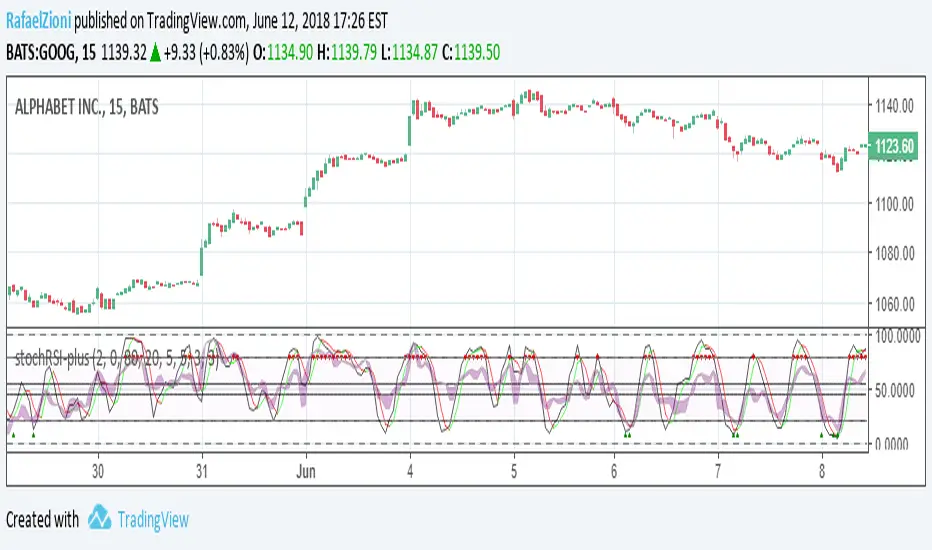
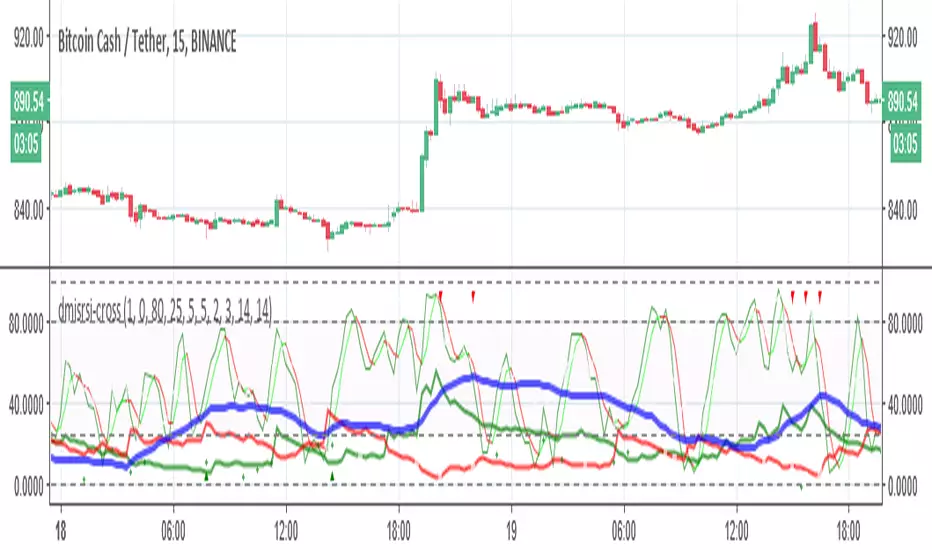
stoch rsi dmi plusSo in this indicator I put the improved DMI together with stoch rsi
the area in light blue are buy zone by the improved DMI
the area in light red are potential sell zone by the improved DMI
the green columns are stoch rsi crossing up
the red columns are stoch rsi crossing down

Stoch RSI K/D DifferenceGet the difference between Stochastic RSI k and d. When k > d, the value is positive, and vice versa.
Sudden change/reversal of the difference can indicate price reversal.

QQE AsYouWishRed & Green Dots are added, signifying events in the QQE. Next step will be to build a trade decision accumulator, based on QQE dot events.

Stochastic RSI Alertscreate alert based on Stochastic RSI when k is greater than 80 or less than 20.
RSI with buy and sellgives buy and sell as per the settings
uses stochastic and RSI
can be used in combination with RSI+ script


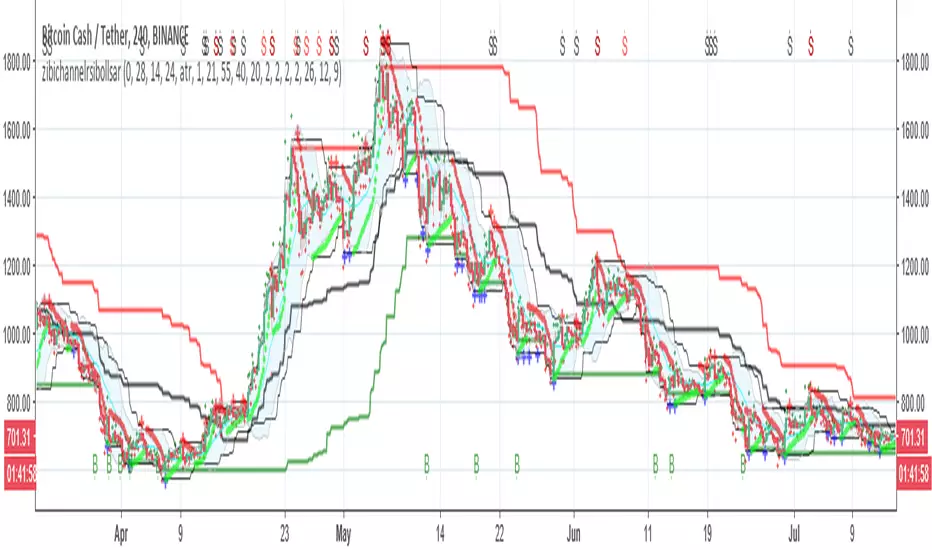
zibichannelrsibollsarsame as last version but instead of filter with Bollinger we filter with sar and rsi
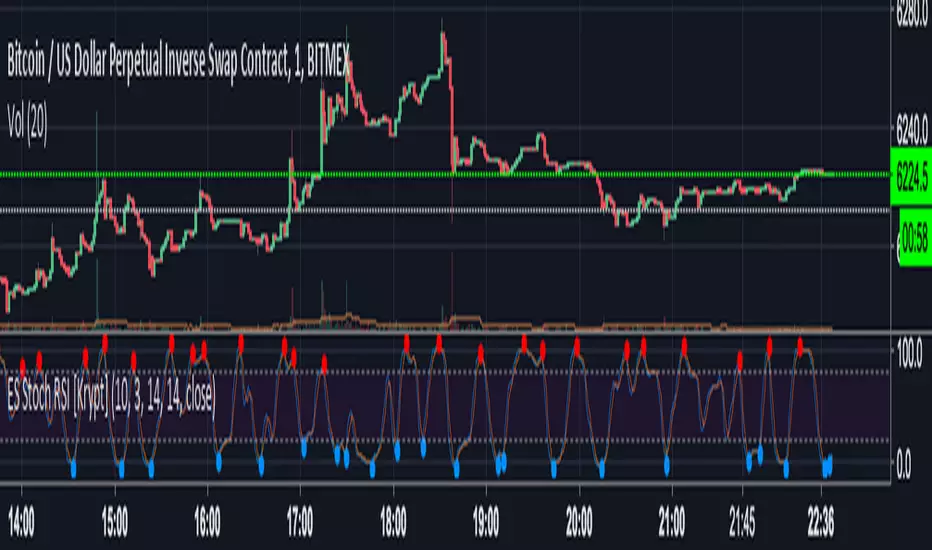
Ehlers-Smoothed Stochastic RSI AlertES Stoch RSI Alert for use with AutoView using script by fskrypt.
Sell Alert <=20.0
Buy Alert >=80.0
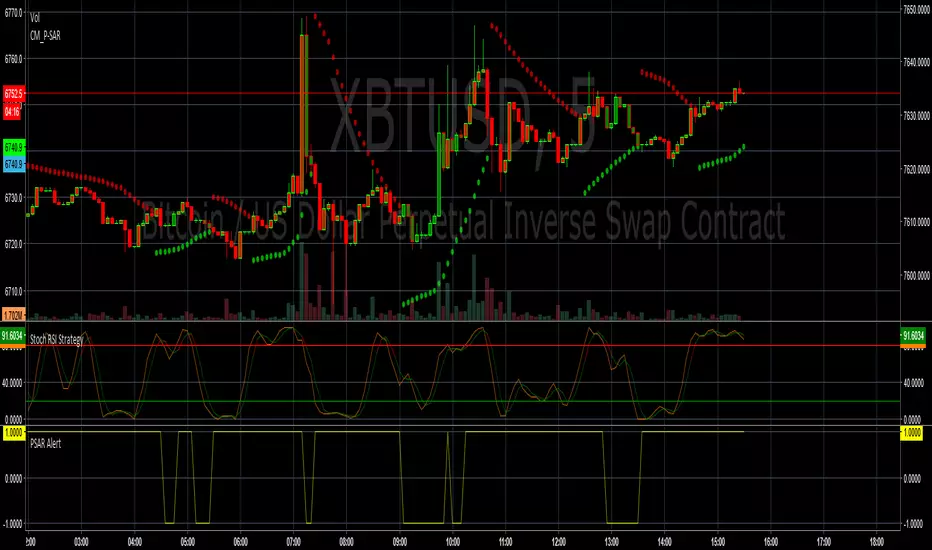
PSAR + SRSI AlertBUY- Will Buy If PSAR is green.
SELL- Will Sell if PSAR is red OR SRSI becomes overbought.
PM for Use.

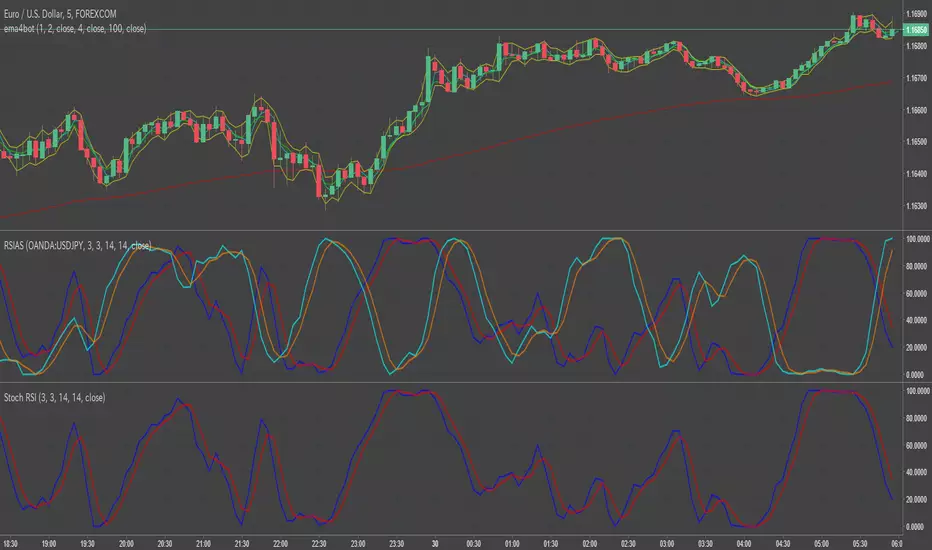
RSI_AnotherSymbolyou can compare current symbol's StochRSI to another symbol's StchRSI
input symbol name in config
default OANDA:USDJPY

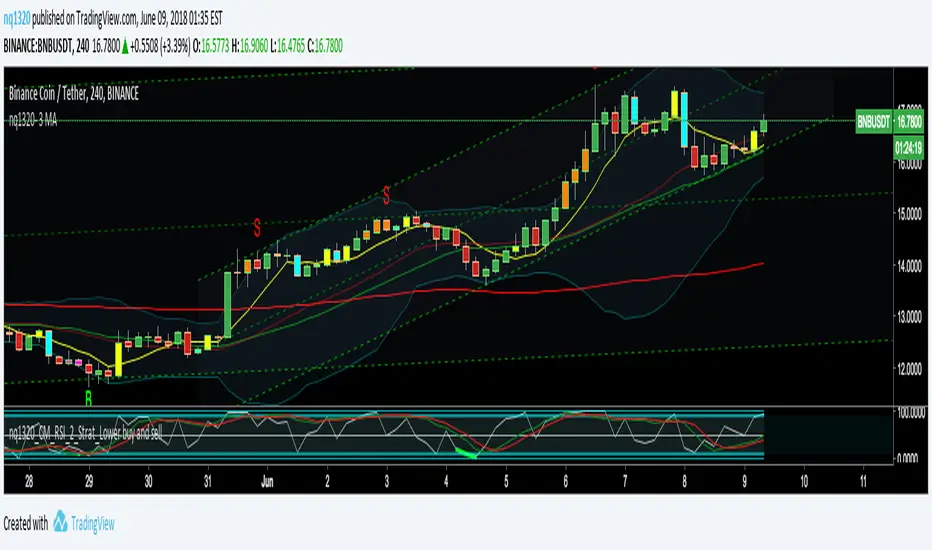
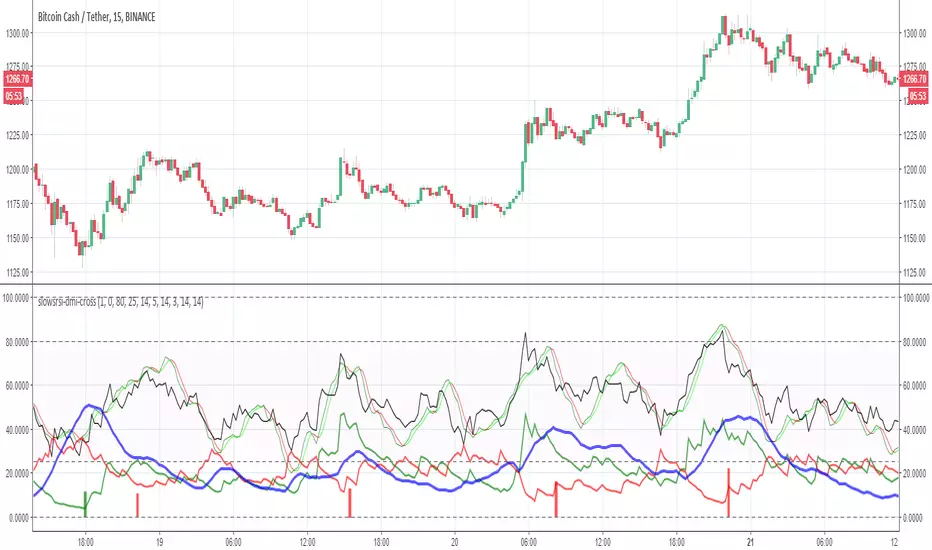
slowsrsi-dmi-crossThis model is based on buy and sell points according to rsi +DMI and the cross up of slow stoch
dmi-srsi-candle v1very similar to previous version only here instead of using rsi dmi system , I use only dmi srsi cross up as seen as green and red trinangular on top or buttom. fib candles are the same no modification best buy if candles bellow 10 and sell if candles above 90

dmi-srsi-crossthis indicator show you the best buy points and sell points on a combination of DMI and SRSI cross up or down represented in green or red triangular dots
dmi-srsi-candleThe indicator has 3 part
1. buy sell pints based on rsi and stoch and DMI = green red trinagukar
2. crossing up of srsi =green cross points
3. fibonaci candels= below 10 best buy ,above 90 =best sell according to candles

stochrsi-histo-candleHave fun I hope you will like it :) its a special stoch rsi design with relation of candels and fib levels

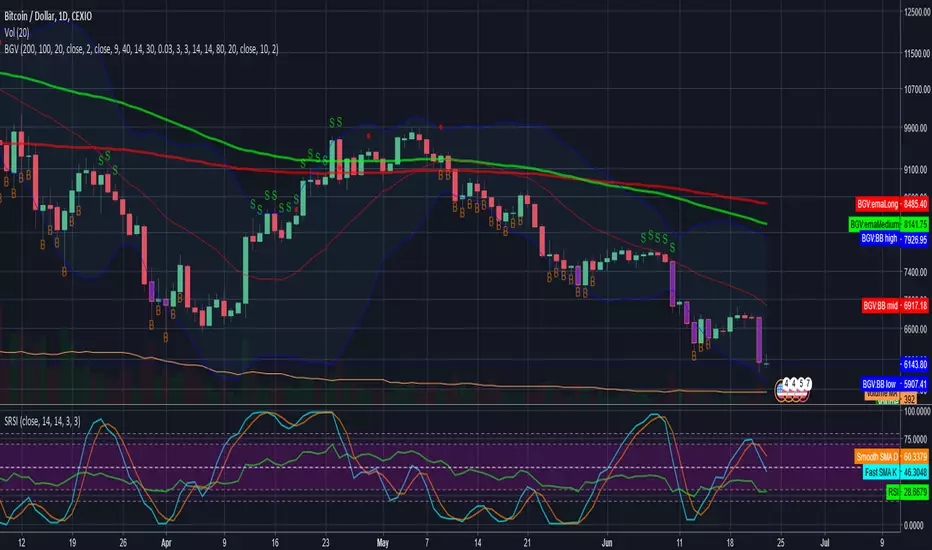
Bull Bear Stoch RSIStandard Stoch RSI with some color modification. 0 - 20 = Really Bearish (Dark Red Zone) 20 - 50 = Bearish (Light Red Zone) 50 - 80 = Bullish (Light Blue Zone) and 80 - 100 = Really Bullish (Strong Blue Zone). Thick lines at top and bottom to easily see 100 and 0.