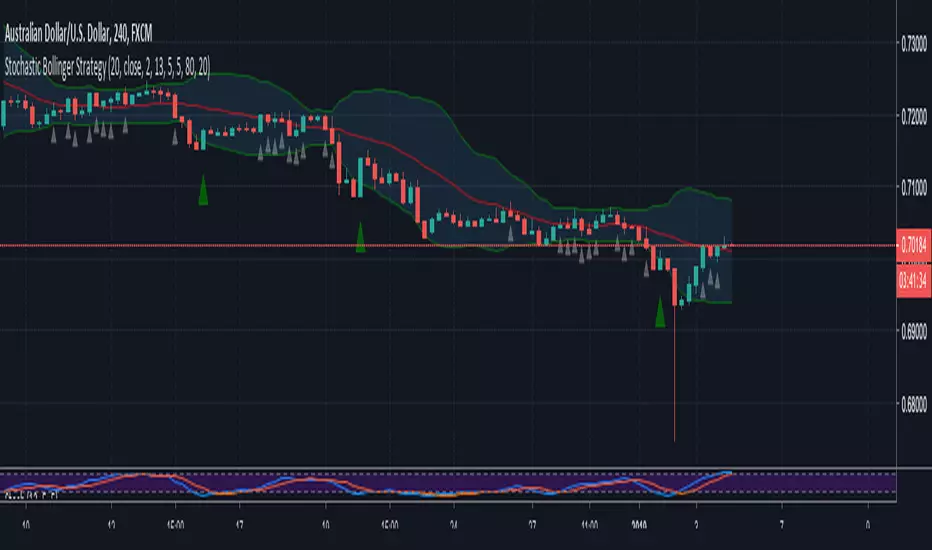
Stochastic Multi TimeframeThis indicator inserts in the same frame the data coming from the Stochastic Slow of Two different timeframes .
By using the “Time Frame 1” and “Time Frame 2” configuration parameters it is possible to specify the two timeframes.
This indicator is very useful to avoid a false signal generated by a single Stochastic indicator that doesn’t consider the information coming from other timeframes.
For example, by configuring the indicator to pick up the Stochastic information from that Daily and the H4 timeframes and by setting the current chart on the 1H timeframe it is possible to improve the entry accuracy.
An example that I am using an it is working well, is to follow the line crossing of the Stochastic configured on the 1H chart only if the Stochastic Multi Timeframe indicator is in synch:
Long trade will be evaluated only if the Daily and 4H Stochastics have the K > D at the same time
Short trade will be evaluated only if the Daily and 4H Stochastics have the K < D at the same time
Please contact me to have the full access to this indicator.
Oscilador Estocástico
STOCH MTF with Moving AverageBasic STOCH indicator with MTF support with moving average
USE EMA Cross with Stoch for buy / sell signal
Stochastique Divergences IndicatorHello,
I made a custom indicator.
Divergences with stochastique and price are really strong signals.
About the indicator
A bullish divergence happens when the stoch K makes a higher low and is depicted by a green triangle up.
A bearish divergence happens when the stoch K makes a lower high and is depicted by a red triangle down.
This script is the base for my next strategy that I should upload soon.
I will grant access (to this script and my others) to people willing to make a small donation.
Here is my BTC address : 19sVQvCDmVfEACq7BiMnWSMqFPZ8qfSQ2K
If you prefer ETH : 0xc8a5d3a63a05db0c2363ea1c08b37a01cce9ebfb
Send me a Private Message with the ID of the transaction
If you want to do some forward testing first, send me a message.
Also check blockchainfiesta.com
Ehlers Stochastic Cyber CycleEhlers Stochastic Cyber Cycle indicator script.
This indicator was originally developed by John F. Ehlers (see his book `Cybernetic Analysis for Stocks and Futures`, Chapter 8: `Stochasticization and Fisherization of Indicators`).
Salty GRaB Wave with Highlights for Squeeze CCI-Arrows SlowStochThis indicator shows GRaB candles and allows several moving averages to be displayed at the same time.
It uses background coloring to identify momentum shifts. Wide bands of color can be used to identify trends while short bands of color can be used to identify reversals.
It has arrows above or below the candles to show CCI values above 100 or below -100 with the arrow pointing in the direction of the momentum.
It has red background coloring to show slow stochastic Overbought ranges and dark red signals indicating a cross of the fast and slow lines.
It has green background coloring to show slow stochastic Oversold ranges and dark green signals indicating a cross of the fast and slow lines.
It has yellow background to show squeezes with additional Squeeze information shown at the bottom of the chart in the form of letters and momentum arrows.
3_Stoch3 Stochastic!
5 - 3 - 3
12 - 6 - 6
20 - 12 - 12
overbought > 80% , red zone
oversell < 20% , green zone
thx, rubend18!!
Stochastic Scalping1 Stochastic RSI (3,3,14,14)
1 Stochastic RSI (3,3,6,6)
1 Stochastic (14,3,3)
1 Bollinger Band (20,2)
Double Stochastic Multi-TimeframeI personalized a double stochastic oscillator.
HOW IS IT USED ?
Everyone should adapt the parameters to its way of trading.
First you must have a confirmation of the trend.
In positive trend, a double stochastic > 20 can be used t enter long.
In negative trend, a double stochastic < 80 can be used t enter long.
Of course this is only one possibility that everyone should adapt.
I added the possibility to add on the chart a 2nd timeframe for confirmation.
If you found this script useful, a tip is always welcome... :)
2xStochastic + RSI (two levels, colored)Great tool to find market tops, bottoms, S/R's and reversals.
Rsi has 2 customiseble overbought and oversold levels can show you extreme levels.
Slow Stochastic 1 (25 period) shows small price swings
Slow stochastic 2 (100 period) can show you a greater picture, are we reversing?
Why do you need Leguerre, Murrey, Kaufman oscilator 3000 when you can have old and trusted tool, that has been tweeked very nicely for any timeframe.
I use it in a variety of ways, let me show you some examples:
EXAMPLE 1 (RSI Extreme Level):
1) Find extreme oversold or overbought level that clearly reversed and plop S/R line there. BAM! We have a S/R line
2) Next time you know this line will mean something (Either it will hold, or it will be broken by a big candle) and you can trade it accordingly to Stochastic trading strategy
EXAMPLE 2 (Fibonacci Level finder):
Trading fibo? This can help!
1) Just like fibo trading, find good swing top and bottom
2) You know that price will reverse from 38.2, 50, 61.8, but where? I think this is self explanotory...
BD RSI & STOCH RSI BAR COLOR CHANGERA simple indicator displaying RSI and STOCHASTIC RSI combined in the one indicator. This indicator also changes the bar colour to yellow when it meets the overbrought conditions of both the RSI and the STOCH RSI and changes the bar colour to black when it meets the oversold conditions of both the RSI and STOCH RSI. The values of these conditions are set as the regular defaults but can be changed in the input settings to suit different time frames and user requirements. This does NOT generate signals but simply shows when both the RSI & STOCH RSI are oversold or overbrought.
Cryptopeep RSI, Stochastic RSI, Stochastic and Williams %R, 4in14 Charts all in one chart, RSI, Stochastic RSI, Stochastic and Williams %R
Hope you like, please let me know your thoughts.
If you would like to be kept up to date please FOLLOW us and try our indicators and strategies here: uk.tradingview.com
If you like it please click the LIKE button.
RSI/Stochastic/Percentrank all on chart and all in oneThe limitation of max 3 indicators on tradingview is pretty bad for indicators lovers (like me) so i made this script able to contain a rsi, a stochastic and a percent rank and that in only one indicator !! Pretty cool isn't it ? ;)
Every parameter is linked to one indicator, you can have all of them with differents period lengths
You have the possibility to disable each indicators and add clarity to the chart.
Do you want me to add more indicators ? If yes witch ? Comment bellow :D
Hope this help
Ergodic OscillatorErgodic Oscillator indicator script.
Ergodic Oscillator is based on True Strength Index (TSI) by William Blau.
EAG MULTI TIME FRAME STOCH RSINeeded an indicator for displaying Stoch RSI's across multiple timeframes. Teal is standard RSI and main graph is Stoch RSI for current timeframe. Cells from top to bottom represent 1D, 2H, 1H, 30min Stoch RSI values, with color code of green for low and black being high.
Currently experimenting with different configurations for the arrow indicators at top. The hope is for these to make identifying trends across the multiple timeframes faster/easier.
Still a work in progress.
Stochastic MFIJust like the standard Stochastic RSI, this is a MFI(Money Flow) version.
The MFI is a Volume Weighted RSI and so this indicator will give that dimension to your technical analysis.
It also includes a "midway" line that can be altered if need be.
// Created 2018 - by @Squiggles#8806
// LTC Tip Jar: LX4bUBdjiRPsagUbZoAczSGgDC4YqTJL7w
DMI StochasticModification of DMI Stochastic indicator created by USGEARS, as requested by another user. This version just colors columns along with the indicator arrow.
RSI + StochasticRSI overbought and oversold histogram
Just indicator combo of oldschool slow stochastic and rsi, just looking a little bit better for someone.
Strategy is simple:
1) RSI is overbought or oversold (above 70, below 30)?
2) Stochastic line crosses its ema?
3) Stochastic and stochastic ema are in overbought = sell, oversold = buy.
Works good in volitile stocks/pairs and suits for fast scalping timeframes 1m 5m 15m
Strategy is old as the books, this is just a better visual for it.
ShiftPower StochasticThis indicator is a combination of the following three slow stochastics commonly used.
ⓐ 5 - 3 - 3
ⓑ 10 - 6 - 6
ⓒ 20 - 12 - 12
( n - %k - %d )
I hope it helps. Thanks.
<한국어>
일반적으로 많이 사용하는 다음 3개의 슬로우 스토케스틱을 하나로 합친 지표입니다.
ⓐ 5 - 3 - 3
ⓑ 10 - 6 - 6
ⓒ 20 - 12 - 12
( n - %k - %d )
도움이 됐으면 좋겠습니다. 감사합니다.
Stochastic Momentum IndexStochastic Momentum Index indicator script. This indicator was originally developed by William Blau (Stocks & Commodities V. 11:1 (11-18)).