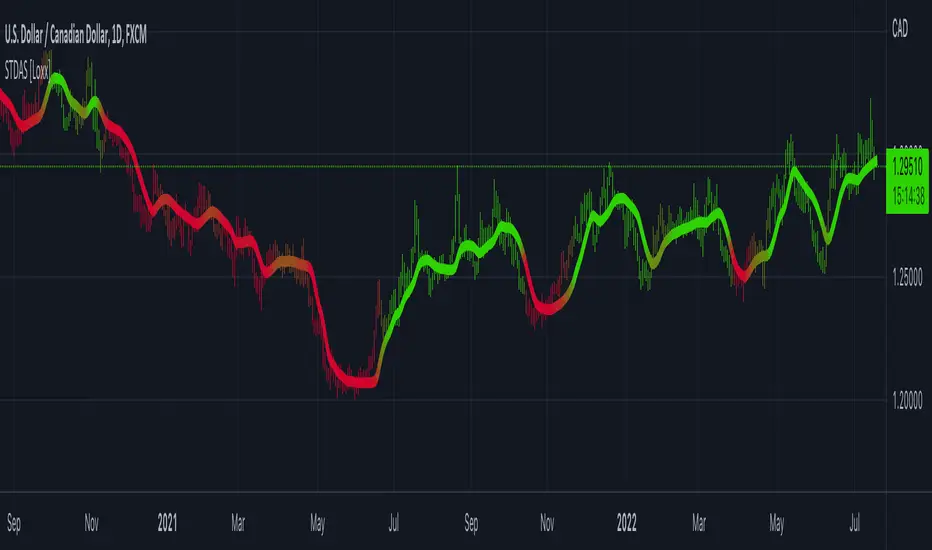
Standard-Deviation Adaptive Smoother MA [Loxx]Standard-Deviation Adaptive Smoother MA is a Smoother moving average with standard deviation adaptivity.
What is the Smoother Moving Average?
The Smoother filter is a faster-reacting smoothing technique which generates considerably less lag than the SMMA ( Smoothed Moving Average ). It gives earlier signals but can also create false signals due to its earlier reactions. This filter is sometimes wrongly mistaken for the superior Jurik Smoothing algorithm.
Included:
Bar coloring
Desvio Padrão
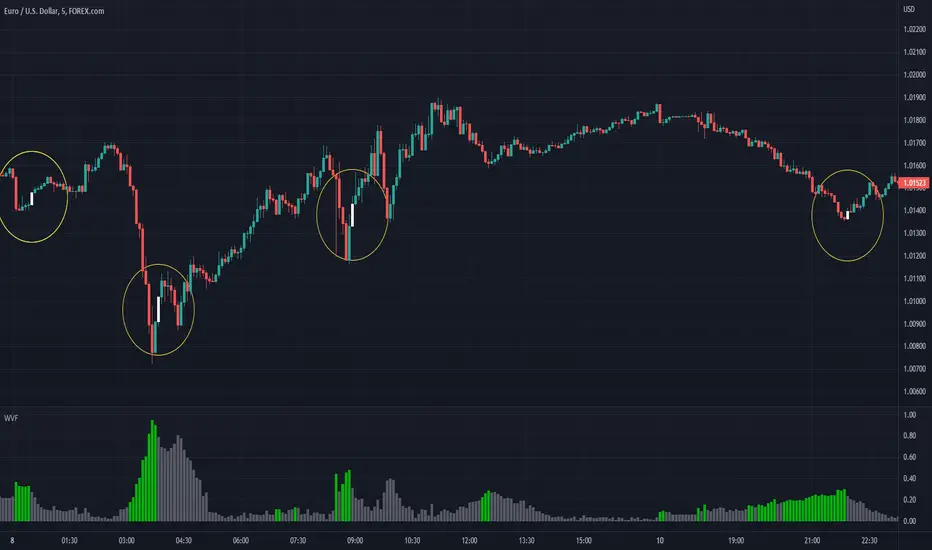
Williams Vix Fix Bottoms and TopsThis indicator uses the very popular Williams Vix Fix for Bottoms by Chris Moody but not only does it search for bottoms, it can also be switch to work for tops for those who look to short the market. I've also added in a few options like flipping the indicator, color adjustments on the settings page, as well as cut a few of the options I feel did not need to be in which cluttered the screen when the settings were opened. In his later revisions of the Williams Vix Fix, CM took out the functions which draw the high/low ranges as well as the standard deviation which is what this indicator uses to show entry points. I have added options back on to draw these, I think it's useful. To be honest, I have not messed around with the number settings much so I am not sure how adjusting the look back range or going for smaller / bigger percentage changes would change how well the indicator works. It seems to work very well at its default settings.
With the Bollinger Band deviation, you have to remember that it looks back at the set amount of candles (20 by default) and uses those for the standard deviation: 1 dev = 68%, 2 dev = 95%, 3 dev = 99.7%
These percentages mean that at 2 dev, 95% of the last 20 candles will remain within the boundaries of the Bollinger Bands. Three tends to be too high, one is usually too low. Two is pretty good.
The lowest percentile option probably won't change much other than bring up the bottom line which doesn't effect the alerts or signals, just something to observe.
The highest percentile option makes a difference similar to the stand deviation and Bollinger Band. The higher you put it, the less likely it will get triggered but the more reliant it of a signal it should be.
As always, I have left notes throughout the code and I did leave in the code that was original but commented it out as I don't believe it's worth having.
I like to have the high/lows drawn, as well as the standard deviation. Then I find that the filtered entries are most accurate signals to follow. Simple entry is hit or miss, Aggressive entry is always early but sometimes that's not a great thing.
[Sidders]Std. Deviation from Mean/MA (Z-score)This indicator visualizes in a straight forward way the distance price is away from the mean in absolute standard deviations (Z-score) over a certain lookback period (can be configured). Additionally I've included a moving average of the distance, the MA type can be configured in the settings.
Personally using this indicator for some of my algo mean reversion strategies. Price reaching the extreme treshold (can be configured in settings, standard is 3) could be seen as a point where price will revert to the mean.
I've included alerts for when price crosses into extreme areas, as well as alerts for when crosses back into 'normal' territory again. Both are also plotted on the indicator through background coloring/shapes.
Since I've learned so much from other developers I've decided to open source the code. Let me know if you have any ideas on how to improve, I'll see if I can implement them.
Enjoy!

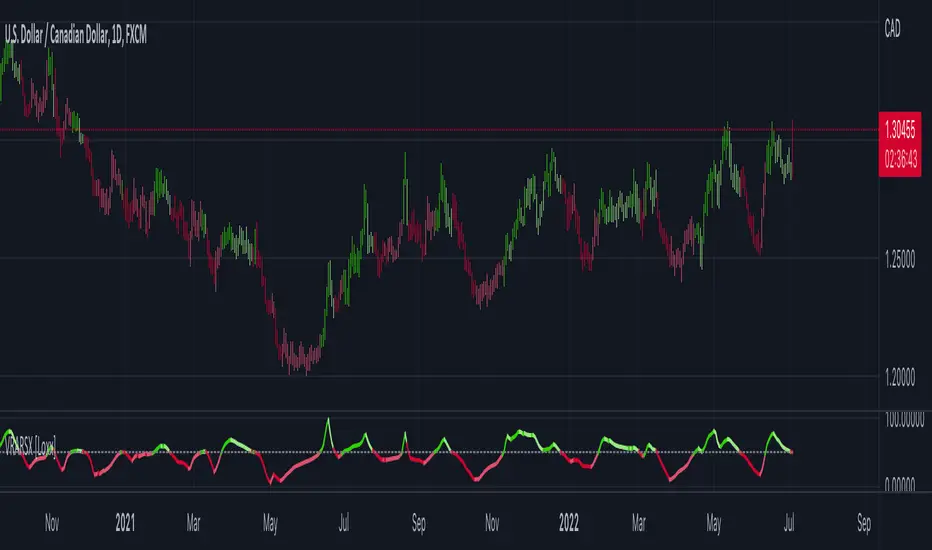
Volatility Ratio Adaptive RSX [Loxx]Volatility Ratio Adaptive RSX this indicator adds volatility ratio adapting and speed value to RSX in order to make it more responsive to market condition changes at the times of high volatility, and to make it smoother in the times of low volatility
What is RSX?
RSI is a very popular technical indicator, because it takes into consideration market speed, direction and trend uniformity. However, the its widely criticized drawback is its noisy (jittery) appearance. The Jurik RSX retains all the useful features of RSI, but with one important exception: the noise is gone with no added lag.
Included:
-Toggle on/off bar coloring
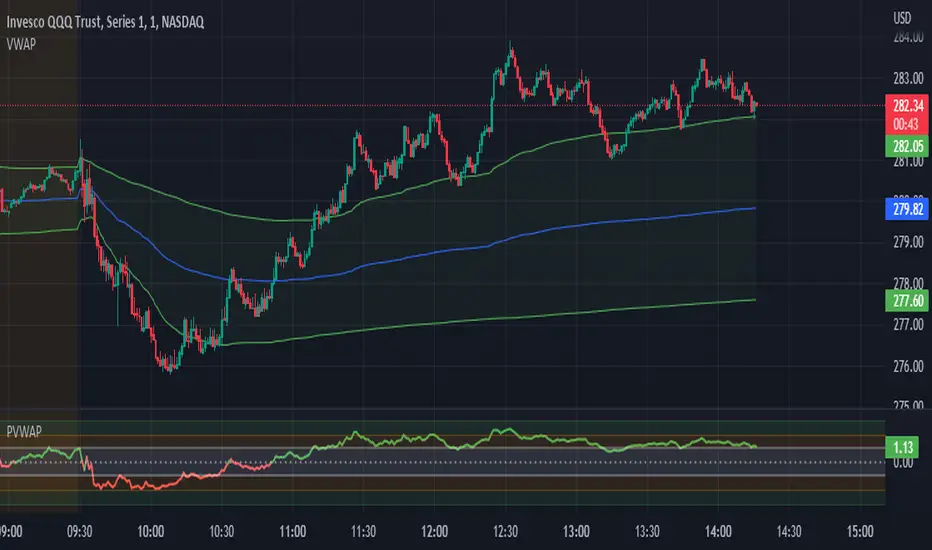
Candle Level of VWAP [By MUQWISHI]The " Price of Volume Weighted Average Price " (PVWAP) indicator calculates the VWAP standard deviation of bar price.
Features:
1. Ability to smooth the "Price of Volume Weighted Average Price" line.
2. Ability to choose the anchor period (timeframes).
Let me know if you have any questions.
Thanks.
SigmaSpikes Background Highlight [vnhilton]SigmaSpikes is an indicator created by Adam H Grimes. It's a volatility indicator which applies a standard deviation measure on candles for a set period of time, in order to find big candles/moves relative to the other candles. These big moves could be the outcome of setups being traded by market players, large market orders put in by big money players, &/or HFT algorithms reacting to events (usually fundamental events).
These big moves can also be seen as inefficient as it doesn't fit in with the mostly efficient market - this is very similar to gaps of which price would want to fill as they're inefficient, in order to "restore order" to the market.
This indicator attempts to give better information at a glance, by highlighting the background of candles that have sigma spikes over the set standard deviation threshold.
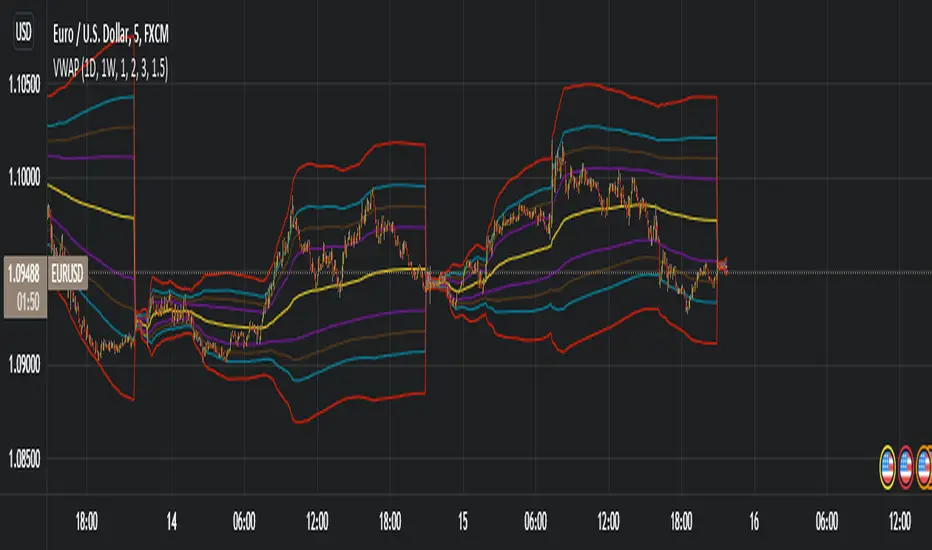
In the chart snapshot image above featuring EURUSD, we can see at 24/06/22 3PM BST, a big move has occurred (highlighted in green showing upward move) leaving an inefficiency area that needs to be filled. The high end of the inefficiency area was reached in the following candle as there was no gap between that candle's open & the previous big candle's close. The low end of the inefficiency area was finally reached almost 4 hours later, at 6:55PM BST.

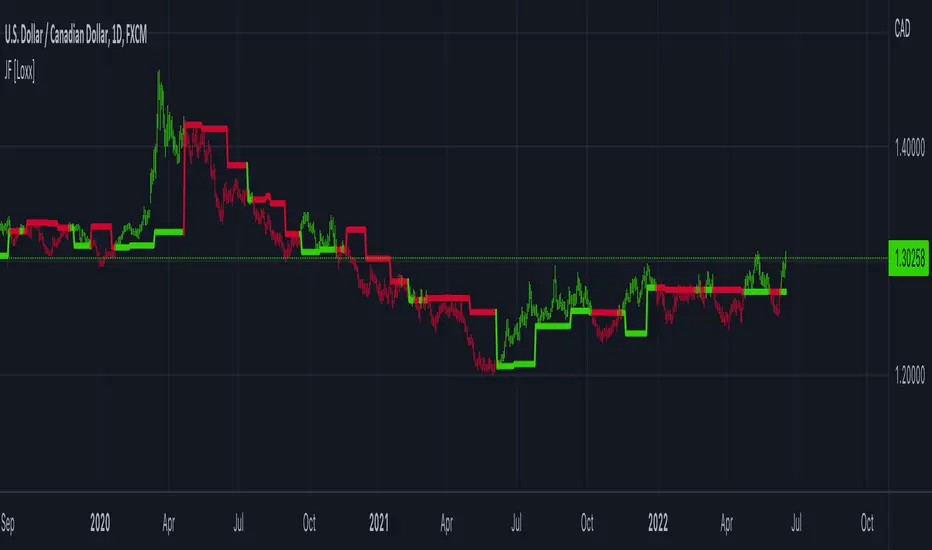
STD Stepped Ehlers Optimal Tracking Filter MTF w/ Alerts [Loxx]STD Stepped Ehlers Optimal Tracking Filter MTF w/ Alerts is the traditional Ehlers Optimal Tracking Filter but with stepped price levels, access to multiple time frames, and alerts.
What is Ehlers Optimal Tracking Filter?
From "OPTIMAL TRACKING FILTERS" by John Ehlers:
"Dr. R.E. Kalman introduced his concept of optimum estimation in 1960. Since that time, his technique has proven to be a powerful and practical tool. The approach is particularly well suited for optimizing the performance of modern terrestrial and space navigation systems. Many traders not directly involved in system analysis have heard about Kalman filtering and have expressed an interest in learning more about it for market applications. Although attempts have been made to provide simple, intuitive explanations, none has been completely successful. Almost without exception, descriptions have become mired in the jargon and state-space notation of the “cult”.
Surprisingly, in spite of the obscure-looking mathematics (the most impenetrable of which can be found in Dr. Kalman’s original paper), Kalman filtering is a fairly direct and simple concept. In the spirit of being pragmatic, we will not deal with the full-blown matrix equations in this description and we will be less than rigorous in the application to trading. Rigorous application requires knowledge of the probability distributions of the statistics. Nonetheless we end with practically useful results. We will depart from the classical approach by working backwards from Exponential Moving Averages. In this process, we introduce a way to create a nearly zero lag moving average. From there, we will use the concept of a Tracking Index that optimizes the filter tracking for the given uncertainty in price movement and the uncertainty in our ability to measure it."
Included:
-Standard deviation stepping filter, price is required to exceed XX deviations before the moving average line shifts direction
-Selection of filtering based on source price, the moving average, or both; you can also set the Filter deviations to 0 for no filtering at all
-Toggle on/off bar coloring
-Toggle on/off signals
-Long/Short alerts

Jurik Filter [Loxx]Jurik Filter is a Jurik-filtered moving average that acts as both a baseline and a support and resistance indicator
What is Jurik Volty used in the Juirk Filter?
One of the lesser known qualities of Juirk smoothing is that the Jurik smoothing process is adaptive. "Jurik Volty" (a sort of market volatility ) is what makes Jurik smoothing adaptive. The Jurik Volty calculation can be used as both a standalone indicator and to smooth other indicators that you wish to make adaptive.
What is the Jurik Moving Average?
Have you noticed how moving averages add some lag (delay) to your signals? ... especially when price gaps up or down in a big move, and you are waiting for your moving average to catch up? Wait no more! JMA eliminates this problem forever and gives you the best of both worlds: low lag and smooth lines.
Ideally, you would like a filtered signal to be both smooth and lag-free. Lag causes delays in your trades, and increasing lag in your indicators typically result in lower profits. In other words, late comers get what's left on the table after the feast has already begun.
Included
-Advanced filtering system using multiples of standard deviation, this filter acts paint dynamic support and resistance levels on the chart based on volatility
-Double Jurik filtering
-Toggle bar color on/off
Sentient levelThe indicator presented here is made based on the study published on NSE:INDIAVIX . Basically it shows 2 sigma (by default) trading ranges of the next day (by default) of indices e.g. NSE:NIFTY & NSE:BANKNIFTY . Everyday three new lines get plotted automatically on the chart of the instrument (preferably NSE:NIFTY & NSE:BANKNIFTY ) you want to trade. Generally it's expected that the index to be traded within the ranges however in case of major gap-up or gap-down if the index opens above the higher range or below the lower range then it's assumed that the day to remain very volatile. This three lines can be considered as important support/resistance . Default parameters are set in consideration of day trading however user can modify them manually as per their trading style.
If you like my work you can donate through Tradingview coin. Thanks

WGMI Bands, ATR & Standard Deviation TableCreated this indicator for option premium selling.
Bands based on 2 to 3 Average True Range or Standard Deviation (whichever is higher).
Table with ATR and Standard Deviation values.

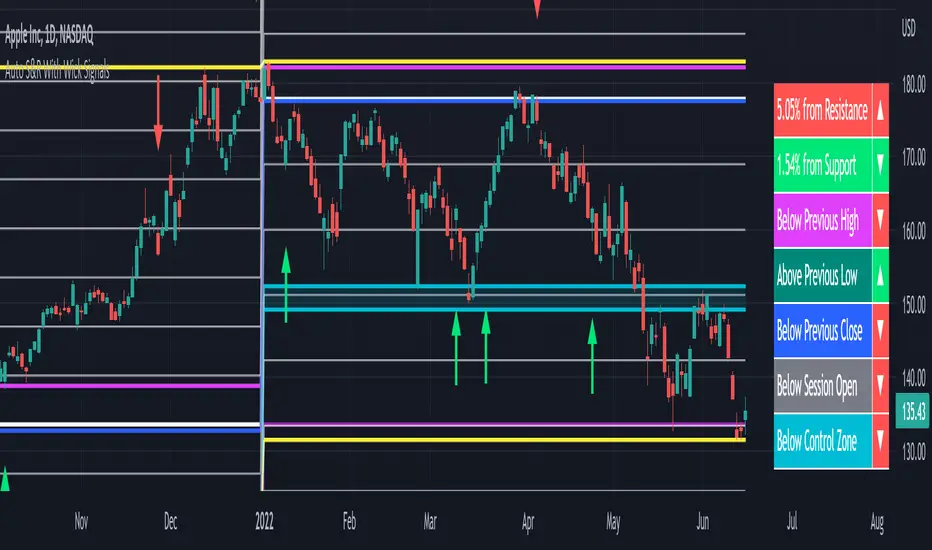
Auto Support & Resistance With Wick Signals & Percentage GapsThis auto support and resistance indicator uses percentage deviations from the previous session close to calculate levels. It provides arrows as signals when it detects 2 wicks in the last 5 bars from a support or resistance level. Includes alerts for price crossing any level as well as real time percentage gaps from current price to the next closest support and resistance level. You also have the option to set up to 3 major levels of your own for any levels that are very important on longer timeframes that you want included. Those will show on the chart as well as within your percentage gap table with color coded background. All features can be customized or turned off to suit your preferences.
SOURCE
This indicator uses the previous session close as a source by default but can be adjusted to use the previous session high or the previous session low. I find the close setting to provide the most accurate levels.
SESSION
The default setting for the previous session used is the daily session but can be adjusted to use the daily, weekly, monthly, quarterly or yearly session. Use longer sessions when looking at longer time frame charts.
SIGNALS
The signals by default are set to only show an arrow if there have been 2 bullish or bearish wicks off of a support or resistance level in the last 5 bars. This can be changed to one bullish wick off of support and one bearish wick off of resistance or it can be set to give a signal anytime a bar crosses a support or resistance level. This can be controlled in the indicator settings.
PERCENTAGE DEVIATION LEVELS
The default percentage deviation is set to 1% but can and should be adjusted according to whatever ticker you are using. For example use .25% or .5% when looking at forex intraday charts since they are not as volatile as other markets. For leveraged etfs used 1% multiplied by the leverage on the etf, so for SQQQ use 3% as it is a 3x leveraged etf. When looking at longer timeframes or highly volatile charts, set the percentage deviation to 2%, 5%, 10%, etc.
LINE COLORS
The color of the lines will change from red to green depending on if the price is above or below that level. You can customize these colors in the settings.
MAJOR LEVELS
If you have major levels of support and resistance from longer timeframes and your own charting, you can add up to 3 major levels that will show on the chart as well as show the percentage gaps in the table. The label for each major level will be colored to match the color of the line on the chart individually.
PERCENTAGE GAP TABLE
The gap table will update live with percentages to go from current price to the next closest support and resistance levels so you don’t have to calculate them manually. The position of the percentage gap table can also be changed within the indicator settings.
TURN FEATURES ON/OFF
There are 3 toggle switches so you can easily turn on or off certain features such as: the support and resistance lines, the percentage gaps table and the arrow signals.
LINE WIDTHS
You can also set the line width of all levels and the line width of the starting level within the indicator settings.
***MARKETS***
This indicator can be used as a signal on all markets, including stocks, crypto, futures and forex.
***TIMEFRAMES***
This automatic support and resistance indicator can be used on all timeframes as long as there is enough data for the session used.
***TIPS***
Try using numerous indicators of ours on your chart so you can instantly see the bullish or bearish trend of multiple indicators in real time without having to analyze the data. Some of our favorites are our Volume Spike Scanner, Volume Profile, Momentum and Trend Friend in combination with this auto support and resistance indicator. They all have real time Bullish and Bearish labels as well so you can immediately understand each indicator's trend.
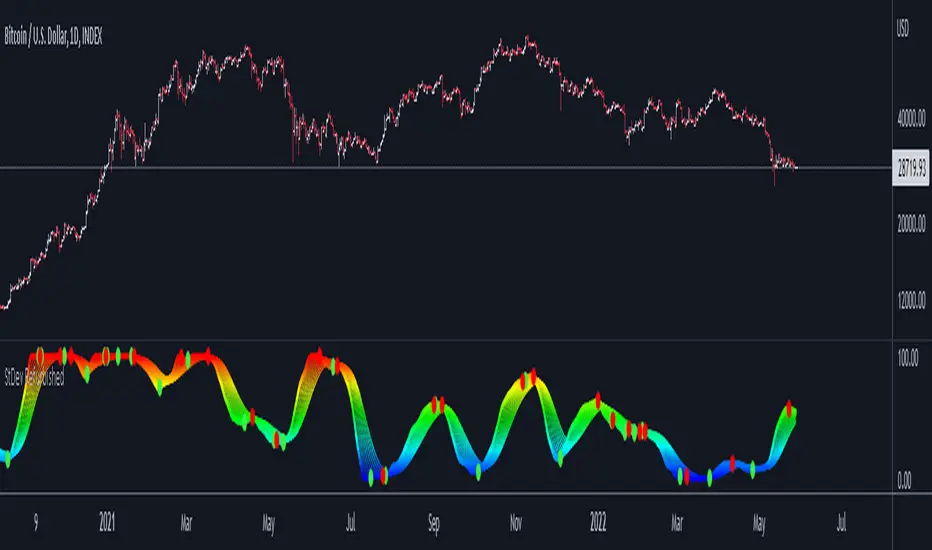
Standard Deviation Refurbished█ Standard Deviation Refurbished
This is an indicator that serves to show the standard deviation in a more improved and less trivial form.
Basically, I put the option to normalize the indicator in a range of 0 to 100.
I also put 10 moving averages of standard deviation.
In the graphic part was placed the choice of themes.
Gratitude to the author 'The_Caretaker' by the themes 'Spectrum Blue-Green-Red' and 'Spectrum Blue-Red'.
█ Concepts
"Standard Deviation is a way to measure price volatility by relating a price range to its moving average. The higher the value of the indicator, the wider the spread between price and its moving average, the more volatile the instrument and the more dispersed the price bars become. The lower the value of the indicator, the smaller the spread between price and its moving average, the less volatile the instrument and the closer to each other the price bars become. Standard Deviation is used as part of other indicators such as Bollinger Bands. It is often used in combination with other signals and analysis techniques."
(TradingView)
Normal Distribution Outliers for volume (NDO indicator)The NDO is a volume-based indicator that indicates how many standard deviations the volume is away from the mean volume.
In other words, this script is useful for detecting when the volume is abnormally large, spotting pumps and dumps, and movement of whales.
Green indicates that the volume is more than 3 standard devs away from the mean, yellow means its more than 2 standard deviations away from the mean, and orange means it is more than 1 standard deviation away from the mean, with red means volume is less than one standard deviation from the mean.
Statistically, 68% of results show up in 1 standard deviations of the mean, 95% in 2 standard deviations of the mean, 99.7% in 3 standard deviations of the mean, making green highly abnormal.

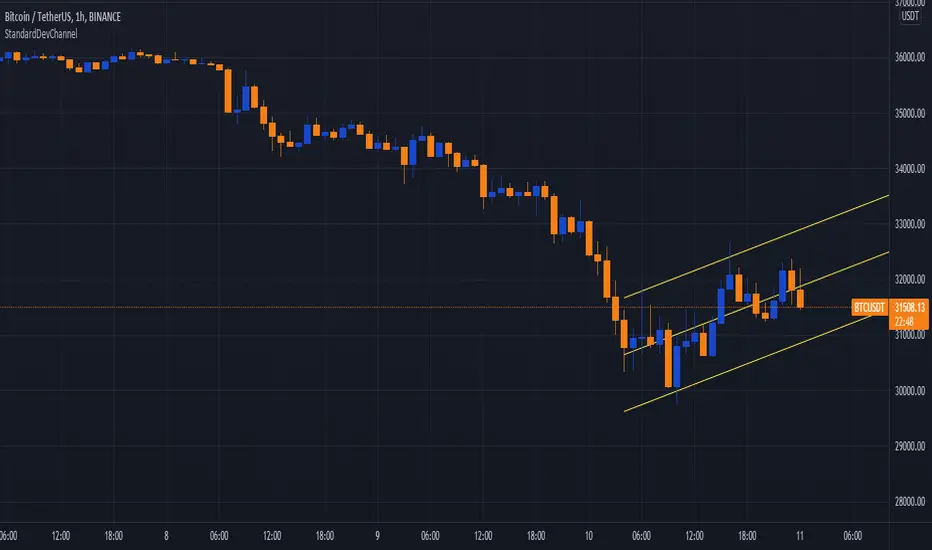
Standard Deviation Channels (ThinkorSwim identical)Saw the standard deviation channels indicator on ThinkorSwim and found a way to replicate it. However, the full range (kind of useless feature) is not the same as ThinkorSwim, but using without full range and setting your own length will be identical to the same length on ThinkorSwim. If you have any recommendations of your trading strategy using this, how to make the script better or any additions, they would be very helpful to suggest.
2 x Coefficient of variationTwo lines of coefficient of variation 365 and 12 bars helps to see slow and fast wave components of current chart. Forecasting extension.

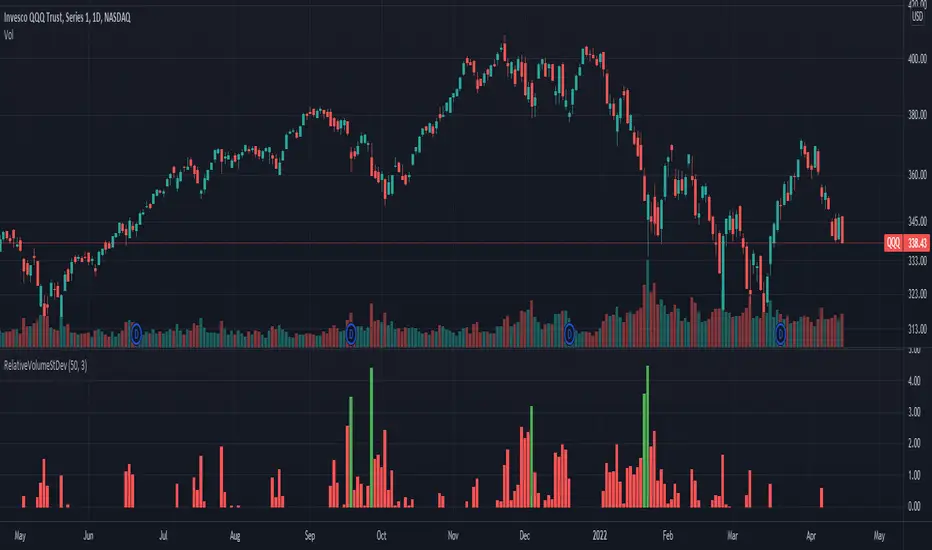
Relative Volume Standard DeviationThis indicator, developed by Melvin E. Dickover, calculates the difference between the volume and its simple moving average, but expressed as a ratio in standard deviations.
The plotted bars become green when the volume is unusually large (configurable).
Volatility Risk Premium GOLD & SILVER 1.0ENGLISH
This indicator (V-R-P) calculates the (one month) Volatility Risk Premium for GOLD and SILVER.
V-R-P is the premium hedgers pay for over Realized Volatility for GOLD and SILVER options.
The premium stems from hedgers paying to insure their portfolios, and manifests itself in the differential between the price at which options are sold (Implied Volatility) and the volatility GOLD and SILVER ultimately realize (Realized Volatility).
I am using 30-day Implied Volatility (IV) and 21-day Realized Volatility (HV) as the basis for my calculation, as one month of IV is based on 30 calendaristic days and one month of HV is based on 21 trading days.
At first, the indicator appears blank and a label instructs you to choose which index you want the V-R-P to plot on the chart. Use the indicator settings (the sprocket) to choose one of the precious metals (or both).
Together with the V-R-P line, the indicator will show its one year moving average within a range of +/- 15% (which you can change) for benchmarking purposes. We should consider this range the “normalized” V-R-P for the actual period.
The Zero Line is also marked on the indicator.
Interpretation
When V-R-P is within the “normalized” range, … well... volatility and uncertainty, as it’s seen by the option market, is “normal”. We have a “premium” of volatility which should be considered normal.
When V-R-P is above the “normalized” range, the volatility premium is high. This means that investors are willing to pay more for options because they see an increasing uncertainty in markets.
When V-R-P is below the “normalized” range but positive (above the Zero line), the premium investors are willing to pay for risk is low, meaning they see decreasing uncertainty and risks in the market, but not by much.
When V-R-P is negative (below the Zero line), we have COMPLACENCY. This means investors see upcoming risk as being lower than what happened in the market in the recent past (within the last 30 days).
CONCEPTS :
Volatility Risk Premium
The volatility risk premium (V-R-P) is the notion that implied volatility (IV) tends to be higher than realized volatility (HV) as market participants tend to overestimate the likelihood of a significant market crash.
This overestimation may account for an increase in demand for options as protection against an equity portfolio. Basically, this heightened perception of risk may lead to a higher willingness to pay for these options to hedge a portfolio.
In other words, investors are willing to pay a premium for options to have protection against significant market crashes even if statistically the probability of these crashes is lesser or even negligible.
Therefore, the tendency of implied volatility is to be higher than realized volatility, thus V-R-P being positive.
Realized/Historical Volatility
Historical Volatility (HV) is the statistical measure of the dispersion of returns for an index over a given period of time.
Historical volatility is a well-known concept in finance, but there is confusion in how exactly it is calculated. Different sources may use slightly different historical volatility formulas.
For calculating Historical Volatility I am using the most common approach: annualized standard deviation of logarithmic returns, based on daily closing prices.
Implied Volatility
Implied Volatility (IV) is the market's forecast of a likely movement in the price of the index and it is expressed annualized, using percentages and standard deviations over a specified time horizon (usually 30 days).
IV is used to price options contracts where high implied volatility results in options with higher premiums and vice versa. Also, options supply and demand and time value are major determining factors for calculating Implied Volatility.
Implied Volatility usually increases in bearish markets and decreases when the market is bullish.
For determining GOLD and SILVER implied volatility I used their volatility indices: GVZ and VXSLV (30-day IV) provided by CBOE.
Warning
Please be aware that because CBOE doesn’t provide real-time data in Tradingview, my V-R-P calculation is also delayed, so you shouldn’t use it in the first 15 minutes after the opening.
This indicator is calibrated for a daily time frame.
----------------------------------------------------------------------
ESPAŇOL
Este indicador (V-R-P) calcula la Prima de Riesgo de Volatilidad (de un mes) para GOLD y SILVER.
V-R-P es la prima que pagan los hedgers sobre la Volatilidad Realizada para las opciones de GOLD y SILVER.
La prima proviene de los hedgers que pagan para asegurar sus carteras y se manifiesta en el diferencial entre el precio al que se venden las opciones (Volatilidad Implícita) y la volatilidad que finalmente se realiza en el ORO y la PLATA (Volatilidad Realizada).
Estoy utilizando la Volatilidad Implícita (IV) de 30 días y la Volatilidad Realizada (HV) de 21 días como base para mi cálculo, ya que un mes de IV se basa en 30 días calendario y un mes de HV se basa en 21 días de negociación.
Al principio, el indicador aparece en blanco y una etiqueta le indica que elija qué índice desea que el V-R-P represente en el gráfico. Use la configuración del indicador (la rueda dentada) para elegir uno de los metales preciosos (o ambos).
Junto con la línea V-R-P, el indicador mostrará su promedio móvil de un año dentro de un rango de +/- 15% (que puede cambiar) con fines de evaluación comparativa. Deberíamos considerar este rango como el V-R-P "normalizado" para el período real.
La línea Cero también está marcada en el indicador.
Interpretación
Cuando el V-R-P está dentro del rango "normalizado",... bueno... la volatilidad y la incertidumbre, como las ve el mercado de opciones, es "normal". Tenemos una “prima” de volatilidad que debería considerarse normal.
Cuando V-R-P está por encima del rango "normalizado", la prima de volatilidad es alta. Esto significa que los inversores están dispuestos a pagar más por las opciones porque ven una creciente incertidumbre en los mercados.
Cuando el V-R-P está por debajo del rango "normalizado" pero es positivo (por encima de la línea Cero), la prima que los inversores están dispuestos a pagar por el riesgo es baja, lo que significa que ven una disminución, pero no pronunciada, de la incertidumbre y los riesgos en el mercado.
Cuando V-R-P es negativo (por debajo de la línea Cero), tenemos COMPLACENCIA. Esto significa que los inversores ven el riesgo próximo como menor que lo que sucedió en el mercado en el pasado reciente (en los últimos 30 días).
CONCEPTOS :
Prima de Riesgo de Volatilidad
La Prima de Riesgo de Volatilidad (V-R-P) es la noción de que la Volatilidad Implícita (IV) tiende a ser más alta que la Volatilidad Realizada (HV) ya que los participantes del mercado tienden a sobrestimar la probabilidad de una caída significativa del mercado.
Esta sobreestimación puede explicar un aumento en la demanda de opciones como protección contra una cartera de acciones. Básicamente, esta mayor percepción de riesgo puede conducir a una mayor disposición a pagar por estas opciones para cubrir una cartera.
En otras palabras, los inversores están dispuestos a pagar una prima por las opciones para tener protección contra caídas significativas del mercado, incluso si estadísticamente la probabilidad de estas caídas es menor o insignificante.
Por lo tanto, la tendencia de la Volatilidad Implícita es de ser mayor que la Volatilidad Realizada, por lo cual el V-R-P es positivo.
Volatilidad Realizada/Histórica
La Volatilidad Histórica (HV) es la medida estadística de la dispersión de los rendimientos de un índice durante un período de tiempo determinado.
La Volatilidad Histórica es un concepto bien conocido en finanzas, pero existe confusión sobre cómo se calcula exactamente. Varias fuentes pueden usar fórmulas de Volatilidad Histórica ligeramente diferentes.
Para calcular la Volatilidad Histórica, utilicé el enfoque más común: desviación estándar anualizada de rendimientos logarítmicos, basada en los precios de cierre diarios.
Volatilidad Implícita
La Volatilidad Implícita (IV) es la previsión del mercado de un posible movimiento en el precio del índice y se expresa anualizada, utilizando porcentajes y desviaciones estándar en un horizonte de tiempo específico (generalmente 30 días).
IV se utiliza para cotizar contratos de opciones donde la alta Volatilidad Implícita da como resultado opciones con primas más altas y viceversa. Además, la oferta y la demanda de opciones y el valor temporal son factores determinantes importantes para calcular la Volatilidad Implícita.
La Volatilidad Implícita generalmente aumenta en los mercados bajistas y disminuye cuando el mercado es alcista.
Para determinar la Volatilidad Implícita de GOLD y SILVER utilicé sus índices de volatilidad: GVZ y VXSLV (30 días IV) proporcionados por CBOE.
Precaución
Tenga en cuenta que debido a que CBOE no proporciona datos en tiempo real en Tradingview, mi cálculo de V-R-P también se retrasa, y por este motivo no se recomienda usar en los primeros 15 minutos desde la apertura.
Este indicador está calibrado para un marco de tiempo diario.

Fibonacci LevelsENGLISH
FiboLevels uses standard deviation (a measure of market volatility). For me, more successful parameters were EMA, 500 days, showing levels 50 and 100.
The standard RSI 14 indicator helps to determine the levels, you can use its values to navigate the levels if the price approaches any line, and the RSI is in the overbought or oversold zone, that is, there is a high probability that the price may rebound from this level.
If the script does not display levels, then you need to reduce the length parameter
If the price has gone beyond the lines, then the number of levels can be increased in the Number of Lines Show parameter
Russian
В FiboLevels используется стандартное отклонение (величина измерения волатильности рынка). Для меня более удачными параметрами вышли EMA, 500 дней , показ уровней 50 и 100.
Определять уровни помогает стандартный индикатор RSI 14, по его значениям можно ориентироваться в уровнях, если цена подходит к какой-либо линии, а RSI находится в зоне перекупленности или перепроданности, то есть большая вероятность что от этого уровня цена может оттолкнуться.
Если скрипт не отображает уровней, то нужно уменьшить параметр длина
Если цена вышла за пределы линий, то количество уровней можно увеличить в параметре Number of Lines Show
GBTT Range Wave IndicatorOverview:
This script is a type of mean reversion indicator, it uses a short period EMA, the EMA5 to be exact, as its basis for a mean. From here, we run a modified version of ATR over a longer period of time to find an average range value for price movement. Finally, we calculate the cloud/band/wave by multiplying this range value by our deviation values to produce areas where the price could be considered too far from the mean (similar to an oversold or overbought scenario).
Additionally, we wrote this script with a goal to reduce or eliminate repainting. In the code, we have utilized OPEN values (instead of CLOSE) and previous candle values (not the current candle) to build all the data for the algorithm here to avoid the waves constantly moving and changing their values on real time candles. That said, this is NOT a guarantee that it will never repaint.
What you see:
Visually, the waves are always on the chart. Optionally, we provide a custom standard deviation channel based off the EMA5 (represented with a blue shading) and/or a simple ema5/21 crossover cloud. These can be used for additional confluence if desired, but are not necessary for the core function of the indicator which would be the upper and lower wave.
Intended use:
To provide educational content about the short term movement of an asset. Designed to be run on any time frame.
Disclaimer:
NOT intended to be a sole source of Technical Analysis or anything more than an educational tool!

Volatility Risk Premium (VRP) 1.0ENGLISH
This indicator (V-R-P) calculates the (one month) Volatility Risk Premium for S&P500 and Nasdaq-100.
V-R-P is the premium hedgers pay for over Realized Volatility for S&P500 and Nasdaq-100 index options.
The premium stems from hedgers paying to insure their portfolios, and manifests itself in the differential between the price at which options are sold (Implied Volatility) and the volatility the S&P500 and Nasdaq-100 ultimately realize (Realized Volatility).
I am using 30-day Implied Volatility (IV) and 21-day Realized Volatility (HV) as the basis for my calculation, as one month of IV is based on 30 calendaristic days and one month of HV is based on 21 trading days.
At first, the indicator appears blank and a label instructs you to choose which index you want the V-R-P to plot on the chart. Use the indicator settings (the sprocket) to choose one of the indices (or both).
Together with the V-R-P line, the indicator will show its one year moving average within a range of +/- 15% (which you can change) for benchmarking purposes. We should consider this range the “normalized” V-R-P for the actual period.
The Zero Line is also marked on the indicator.
Interpretation
When V-R-P is within the “normalized” range, … well... volatility and uncertainty, as it’s seen by the option market, is “normal”. We have a “premium” of volatility which should be considered normal.
When V-R-P is above the “normalized” range, the volatility premium is high. This means that investors are willing to pay more for options because they see an increasing uncertainty in markets.
When V-R-P is below the “normalized” range but positive (above the Zero line), the premium investors are willing to pay for risk is low, meaning they see decreasing uncertainty and risks in the market, but not by much.
When V-R-P is negative (below the Zero line), we have COMPLACENCY. This means investors see upcoming risk as being lower than what happened in the market in the recent past (within the last 30 days).
CONCEPTS:
Volatility Risk Premium
The volatility risk premium (V-R-P) is the notion that implied volatility (IV) tends to be higher than realized volatility (HV) as market participants tend to overestimate the likelihood of a significant market crash.
This overestimation may account for an increase in demand for options as protection against an equity portfolio. Basically, this heightened perception of risk may lead to a higher willingness to pay for these options to hedge a portfolio.
In other words, investors are willing to pay a premium for options to have protection against significant market crashes even if statistically the probability of these crashes is lesser or even negligible.
Therefore, the tendency of implied volatility is to be higher than realized volatility, thus V-R-P being positive.
Realized/Historical Volatility
Historical Volatility (HV) is the statistical measure of the dispersion of returns for an index over a given period of time.
Historical volatility is a well-known concept in finance, but there is confusion in how exactly it is calculated. Different sources may use slightly different historical volatility formulas.
For calculating Historical Volatility I am using the most common approach: annualized standard deviation of logarithmic returns, based on daily closing prices.
Implied Volatility
Implied Volatility (IV) is the market's forecast of a likely movement in the price of the index and it is expressed annualized, using percentages and standard deviations over a specified time horizon (usually 30 days).
IV is used to price options contracts where high implied volatility results in options with higher premiums and vice versa. Also, options supply and demand and time value are major determining factors for calculating Implied Volatility.
Implied Volatility usually increases in bearish markets and decreases when the market is bullish.
For determining S&P500 and Nasdaq-100 implied volatility I used their volatility indices: VIX and VXN (30-day IV) provided by CBOE.
Warning
Please be aware that because CBOE doesn’t provide real-time data in Tradingview, my V-R-P calculation is also delayed, so you shouldn’t use it in the first 15 minutes after the opening.
This indicator is calibrated for a daily time frame.
ESPAŇOL
Este indicador (V-R-P) calcula la Prima de Riesgo de Volatilidad (de un mes) para S&P500 y Nasdaq-100.
V-R-P es la prima que pagan los hedgers sobre la Volatilidad Realizada para las opciones de los índices S&P500 y Nasdaq-100.
La prima proviene de los hedgers que pagan para asegurar sus carteras y se manifiesta en el diferencial entre el precio al que se venden las opciones (Volatilidad Implícita) y la volatilidad que finalmente se realiza en el S&P500 y el Nasdaq-100 (Volatilidad Realizada).
Estoy utilizando la Volatilidad Implícita (IV) de 30 días y la Volatilidad Realizada (HV) de 21 días como base para mi cálculo, ya que un mes de IV se basa en 30 días calendario y un mes de HV se basa en 21 días de negociación.
Al principio, el indicador aparece en blanco y una etiqueta le indica que elija qué índice desea que el V-R-P represente en el gráfico. Use la configuración del indicador (la rueda dentada) para elegir uno de los índices (o ambos).
Junto con la línea V-R-P, el indicador mostrará su promedio móvil de un año dentro de un rango de +/- 15% (que puede cambiar) con fines de evaluación comparativa. Deberíamos considerar este rango como el V-R-P "normalizado" para el período real.
La línea Cero también está marcada en el indicador.
Interpretación
Cuando el V-R-P está dentro del rango "normalizado",... bueno... la volatilidad y la incertidumbre, como las ve el mercado de opciones, es "normal". Tenemos una “prima” de volatilidad que debería considerarse normal.
Cuando V-R-P está por encima del rango "normalizado", la prima de volatilidad es alta. Esto significa que los inversores están dispuestos a pagar más por las opciones porque ven una creciente incertidumbre en los mercados.
Cuando el V-R-P está por debajo del rango "normalizado" pero es positivo (por encima de la línea Cero), la prima que los inversores están dispuestos a pagar por el riesgo es baja, lo que significa que ven una disminución, pero no pronunciada, de la incertidumbre y los riesgos en el mercado.
Cuando V-R-P es negativo (por debajo de la línea Cero), tenemos COMPLACENCIA. Esto significa que los inversores ven el riesgo próximo como menor que lo que sucedió en el mercado en el pasado reciente (en los últimos 30 días).
CONCEPTOS:
Prima de Riesgo de Volatilidad
La Prima de Riesgo de Volatilidad (V-R-P) es la noción de que la Volatilidad Implícita (IV) tiende a ser más alta que la Volatilidad Realizada (HV) ya que los participantes del mercado tienden a sobrestimar la probabilidad de una caída significativa del mercado.
Esta sobreestimación puede explicar un aumento en la demanda de opciones como protección contra una cartera de acciones. Básicamente, esta mayor percepción de riesgo puede conducir a una mayor disposición a pagar por estas opciones para cubrir una cartera.
En otras palabras, los inversores están dispuestos a pagar una prima por las opciones para tener protección contra caídas significativas del mercado, incluso si estadísticamente la probabilidad de estas caídas es menor o insignificante.
Por lo tanto, la tendencia de la Volatilidad Implícita es de ser mayor que la Volatilidad Realizada, por lo cual el V-R-P es positivo.
Volatilidad Realizada/Histórica
La Volatilidad Histórica (HV) es la medida estadística de la dispersión de los rendimientos de un índice durante un período de tiempo determinado.
La Volatilidad Histórica es un concepto bien conocido en finanzas, pero existe confusión sobre cómo se calcula exactamente. Varias fuentes pueden usar fórmulas de Volatilidad Histórica ligeramente diferentes.
Para calcular la Volatilidad Histórica, utilicé el enfoque más común: desviación estándar anualizada de rendimientos logarítmicos, basada en los precios de cierre diarios.
Volatilidad Implícita
La Volatilidad Implícita (IV) es la previsión del mercado de un posible movimiento en el precio del índice y se expresa anualizada, utilizando porcentajes y desviaciones estándar en un horizonte de tiempo específico (generalmente 30 días).
IV se utiliza para cotizar contratos de opciones donde la alta Volatilidad Implícita da como resultado opciones con primas más altas y viceversa. Además, la oferta y la demanda de opciones y el valor temporal son factores determinantes importantes para calcular la Volatilidad Implícita.
La Volatilidad Implícita generalmente aumenta en los mercados bajistas y disminuye cuando el mercado es alcista.
Para determinar la Volatilidad Implícita de S&P500 y Nasdaq-100 utilicé sus índices de volatilidad: VIX y VXN (30 días IV) proporcionados por CBOE.
Precaución
Tenga en cuenta que debido a que CBOE no proporciona datos en tiempo real en Tradingview, mi cálculo de V-R-P también se retrasa, y por este motivo no se recomienda usar en los primeros 15 minutos desde la apertura.
Este indicador está calibrado para un marco de tiempo diario.

TBM VWAP Bands Style SetupA stripped down and modified version of the 'VWAP with Standard Deviation Bands' indicator by pmk07. The bands have been modified and styled to match those used on the Tradovate platform by Matt from the Trades By Matt youtube channel so if you would like to know how they should be used go to his youtube channel and watch his strategy explanation video.
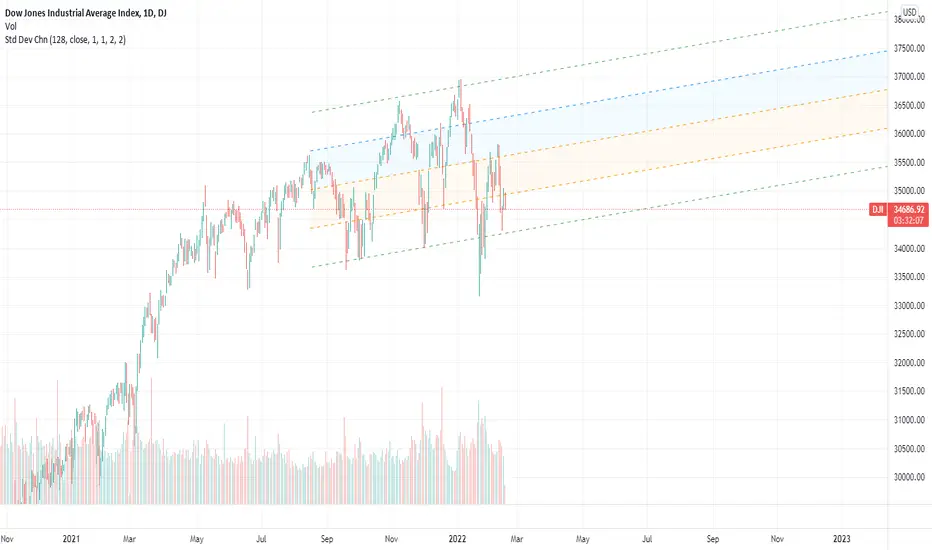
Standard Deviation ChannelThe standard deviation channel allows you to visually see the trend in the market using a linear regression calculation. This script has two lower and two upper bounds, with different deviations. Each of these boundaries has an alert when it has been breached.
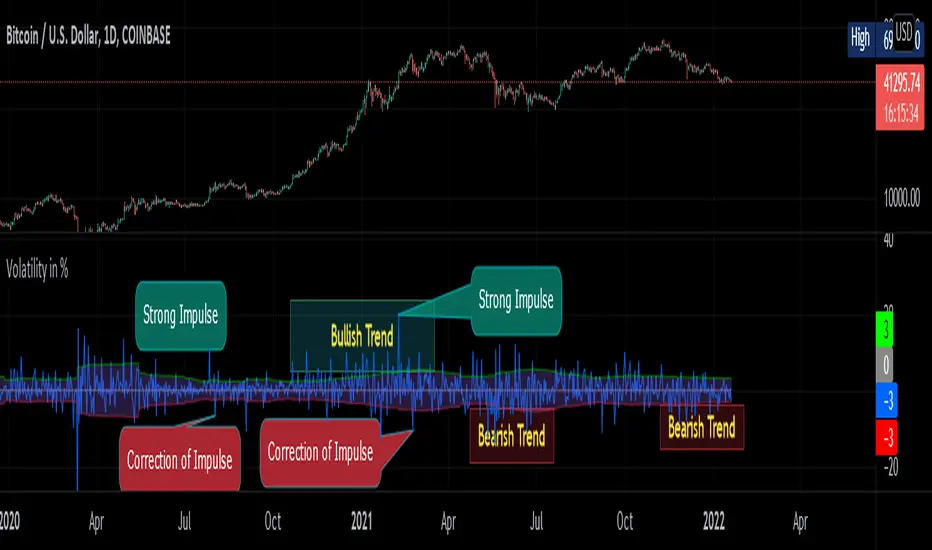
Volatility in % by zdmreVolatility is a statistical measure of the dispersion of returns for market index. In most cases, the higher the volatility, the higher the risk. Volatility is often measured as either the standard deviation or variance between returns from market index.
This indicator helps you identify the direction of the trend by calculating the standard deviation of the movement.