Scripting Tutorial 3 - Triple Many Moving AveragesThis script is for a triple moving average indicator where the user can select from different types of moving averages. It is meant as an educational script with well formatted styling, and references for specific functions.
Sma

Scripting Tutorial 1 - Simple Moving AverageThis script is for a simple moving average indicator. It is meant as an educational script with well formatted styling, and references for specific functions.

DT-21 Moving AveragesI know a lot of people use the free version of TradingView, So I made a script to combine 5 Moving averages as 1 indicator.

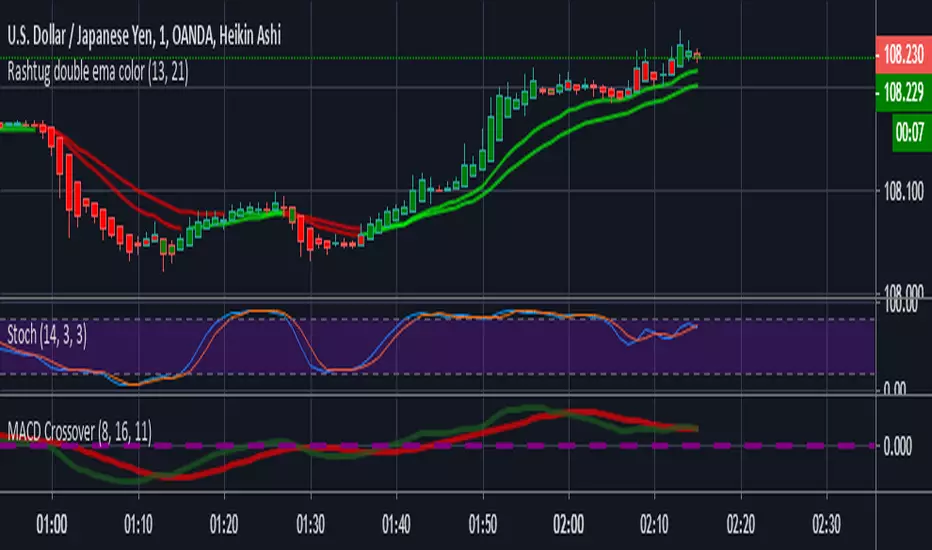
Rashtug double ema coloris a simple script with a 5 minute strategy
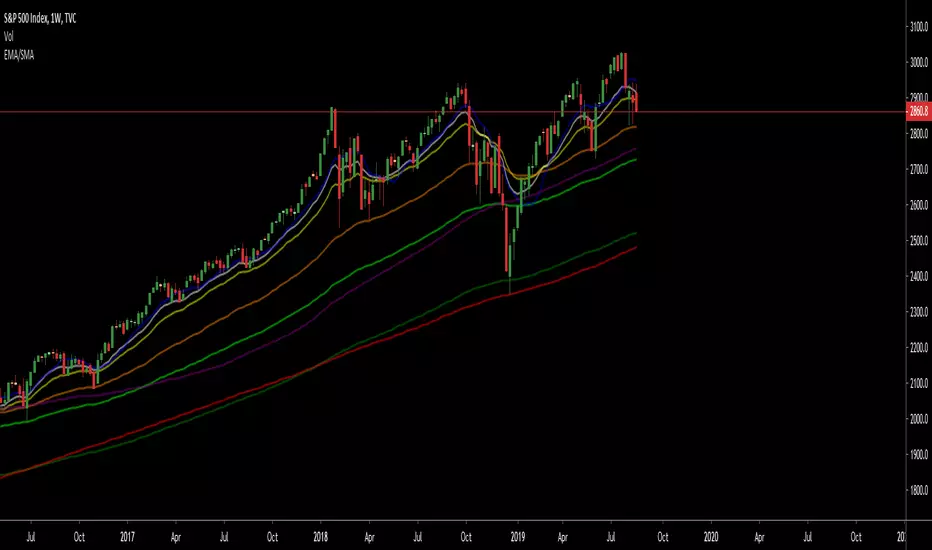
Timeline: 1M and 5M
Set the timeline to 1 minute when both line turn green BUY,
when both line turn red, SELL
when there is a break between the line, dont enter trade until both turn GREEN or RED
if you find it useful and you make money with it donate here
16jQEdTGmg2g6dmFCZzURXzaAYVxXWq167
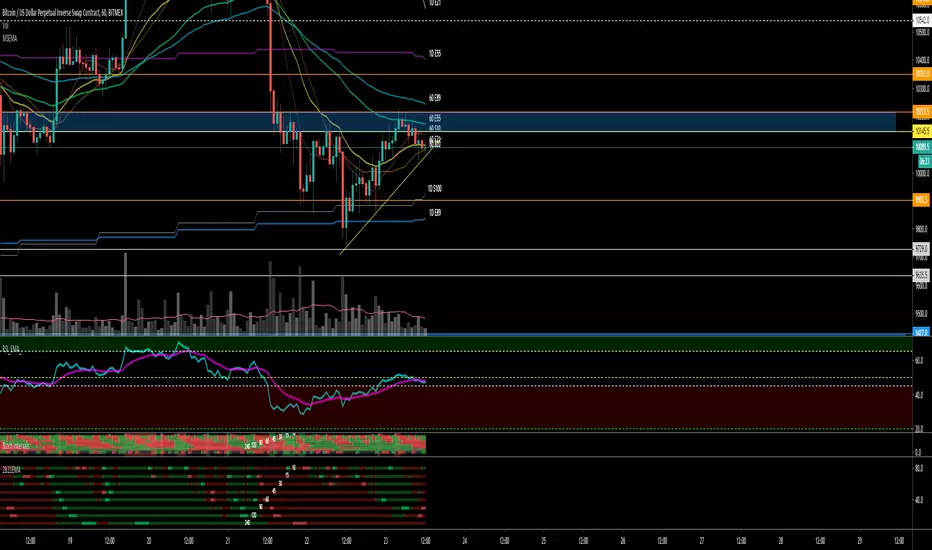
VWAP/MVWAP/SMA CROSSOVERTo use this indicator is simple.
When the VWAP (Thick Yellow) AND the two SMA (Orange and thin Yellow) cross above the MVWAP (Purple) then you will be in a uptrend that could possibly continue upwards. The opposite is true if you are looking a short opportunity, wait for the three other lines to cross under the MVWAP and you should be in a downtrend that could possibly continue downwards
Of course as with all indicators not every signal will be 100% accurate there is no way to predict human emotions when it comes to trading but based on the VWAP strategy used in other markets this is the closest I could get.
Note: Don't relay completely on this indicator to think for you. Use other forms of TA to confirm all positions before entering. And if the candles start trending the opposite direction after a lets say a mini pump/dump then the signal was false.
Finally this was made according to the 15 minute chart. I did not plan on remaking it for any other timeframes as I have left the code open for you to tweak and the setting are free to adjust aswell.
Q/A
Q: Does it repaint?
A: No, this is based on moving averages as far as I know they don't repaint.
Q: How did you come up with this indicator?
A: Went on youtube looking for trading strategies other and the usual EMA crosses and found a VWAP & EMA strat. I added the MVWAP and played with the numbers until I found something that I liked.
Q: How long have you been trading/learning pinescript?
A: Been trading less than a two months and pinescript about a month and a half.


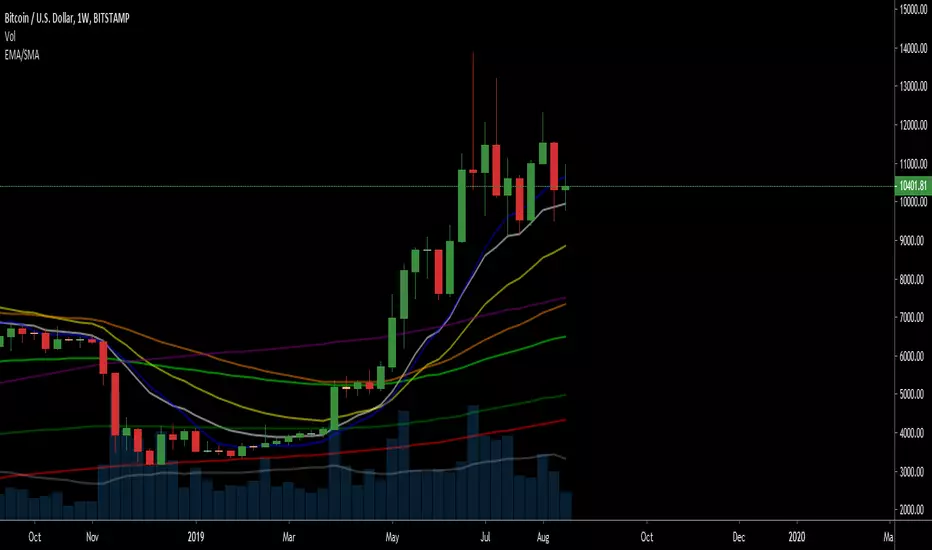
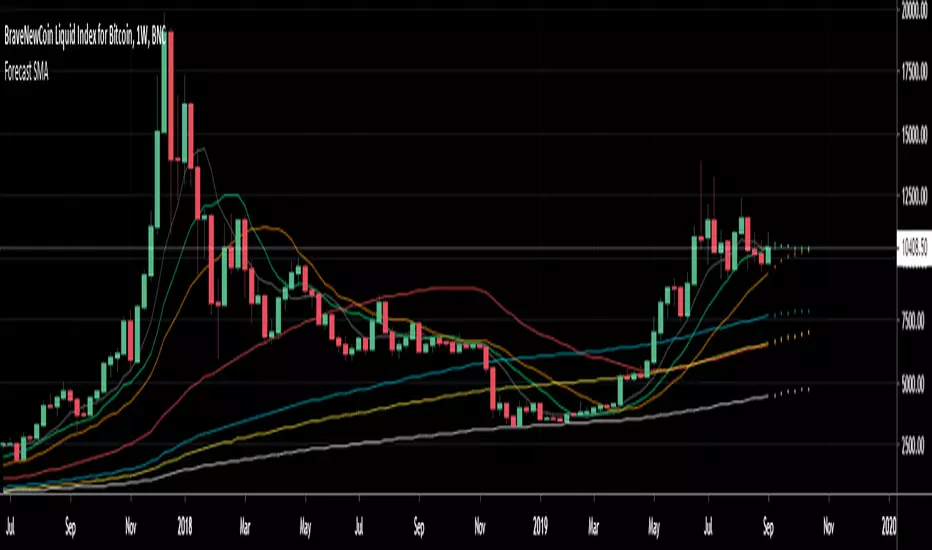
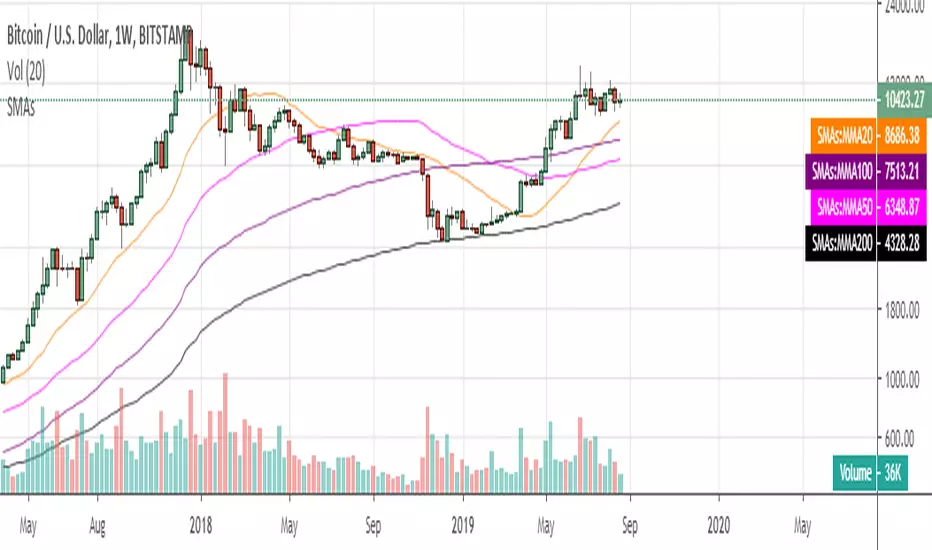
Forecast 7 SMA's 6 periodsForecast 7 SMA's 6 periods
This script is an upgrade of the existing Triple MA Forecast from Yatrader2
To allow the user to display 7 different SMAs and look 6 candles ahead
Default Value
8 SMA
13 SMA
20 SMA
50 SMA
100 SMA
128 SMA
200 SMA
Note:
Best to use on high timeframe, if on low timeframe change the forecast maximum to lower
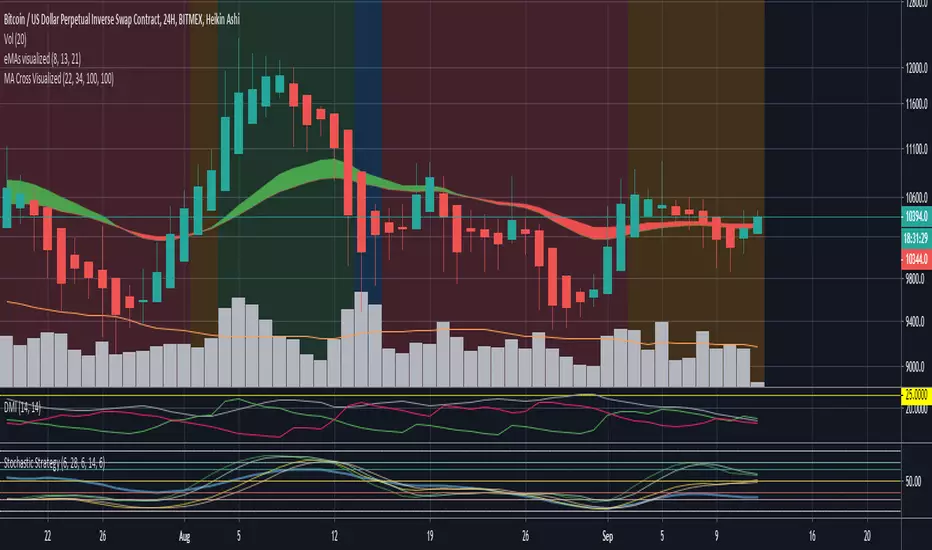
This was made to forecast the 20 SMA on weekly timeframe on the upcomming Bitcoin price
Multi Timeframe EMA/SMAFeatures:
Up to 10 EMA/SMA
Optionally select a different resolution for each EMA/SMA

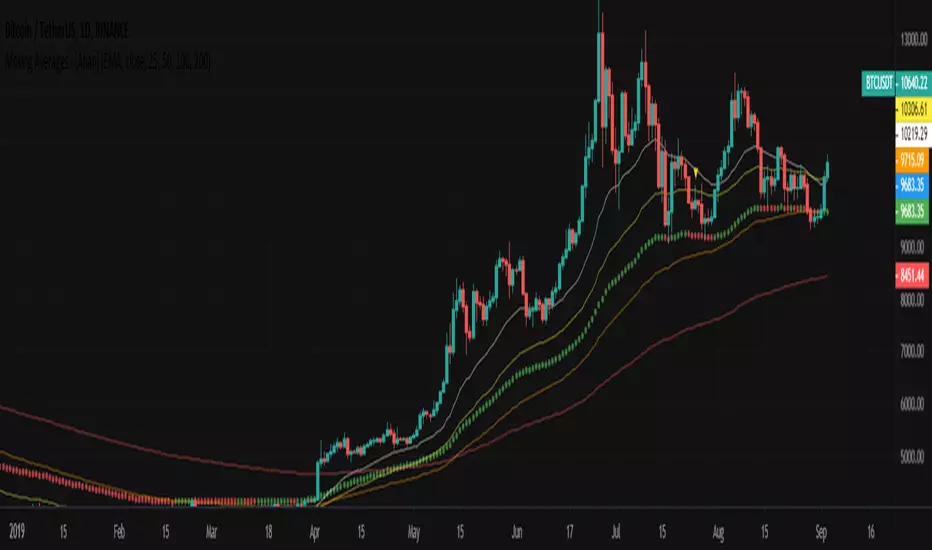
Moving Averages - [Anan]Hello Friends,,
This is my own Moving Averages indicator :
- V4 Pinescript
- 4 Plots Moving Average on the same chart
- 12 Moving Average types !
- Types:
- Lenght: optional
- Source: optional
- Combined Moving averages ! (try it with EMA and thank me later ;D)
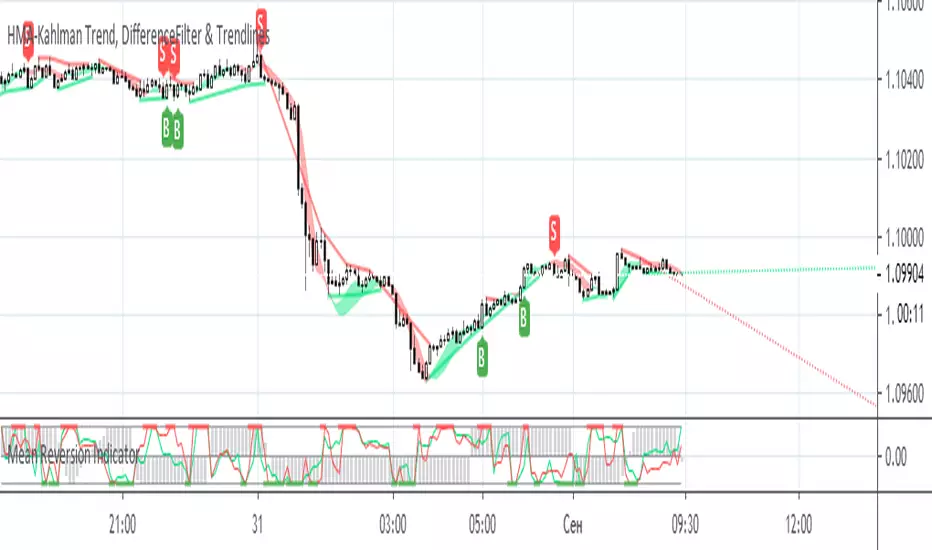
HMA-Kahlman Trend, DifferenceFilter & TrendlinesThis update to the previous HMA-Kahlman Trend, Clipping & Trendlines script features the same structure with the three modules:
- Trendlines module,
- NEW Winsorizing submodule using difference-based filtering.
- HMA-Kahlman Trend module.
The Winsorizing submodule filters signals by a volume level, eliminating the ones with the volume below a threshold. This module substitutes the previous 'low-level' filtering implementation. This time it filters out based on difference between scaled volume and its moving average.
Tested with BTCUSD.
basifx 3 SMA cross 5 SMA(high, low, close) = short-term line(Orange)
34 SMA(high, low, close) = long-term line(Green & Red)
If 5 SMA is above 34 SMA = Green color, If 5 SMA is below 34 SMA = Red color

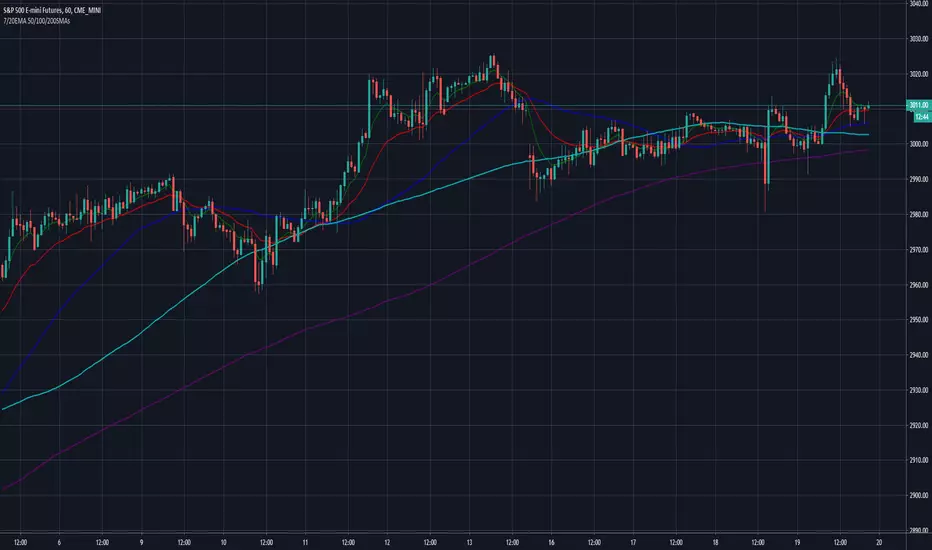
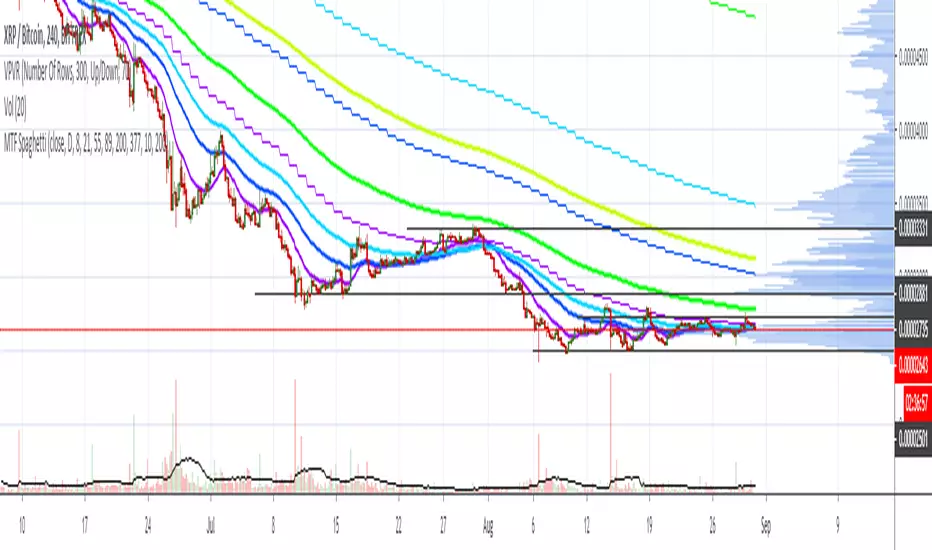
Scott’s MTF SpaghettiIt may be useful to view higher time frame emas on the same chart. For example: view 4hour ema and daily 21ema
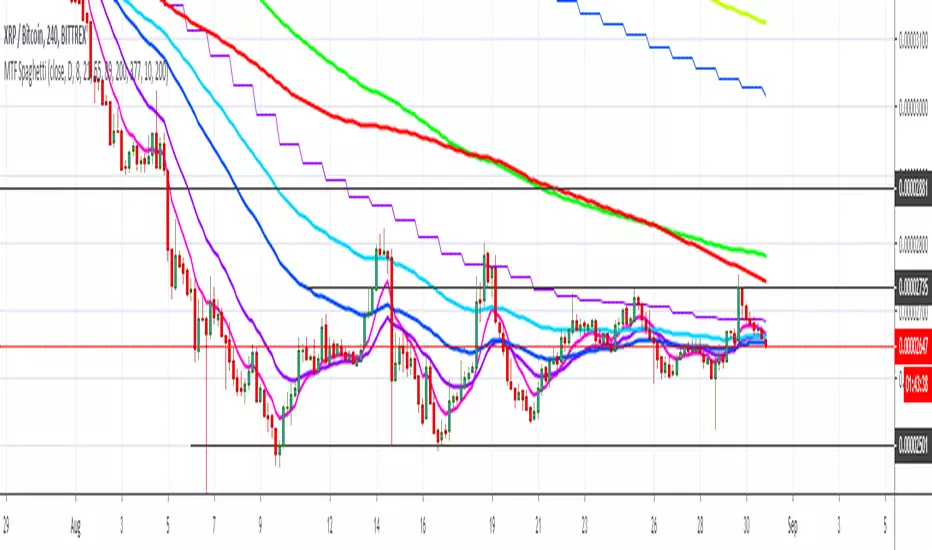
Scott’s MTF SpaghettiIt may be useful to observe emas on higher time frames: to see how 4 hour candles are reacting to daily emas, for example.
TJD Parabolic SAR + Binary PivotsIdentifies support points, and pivots on the market, to place you in trending trades, and identify potential reversals.


Multi EMA/SMA with Bollinger Bands Combo 1.0This script provides:
5 regular EMAs
5 regular SMAs
3 multiple time frame EMAs
3 multiple time frame SMAs
Bollinger Bands
All features can be turned on/off and customized regarding color, lines, etc.
Excellent for TradingView users with limited or free accounts.

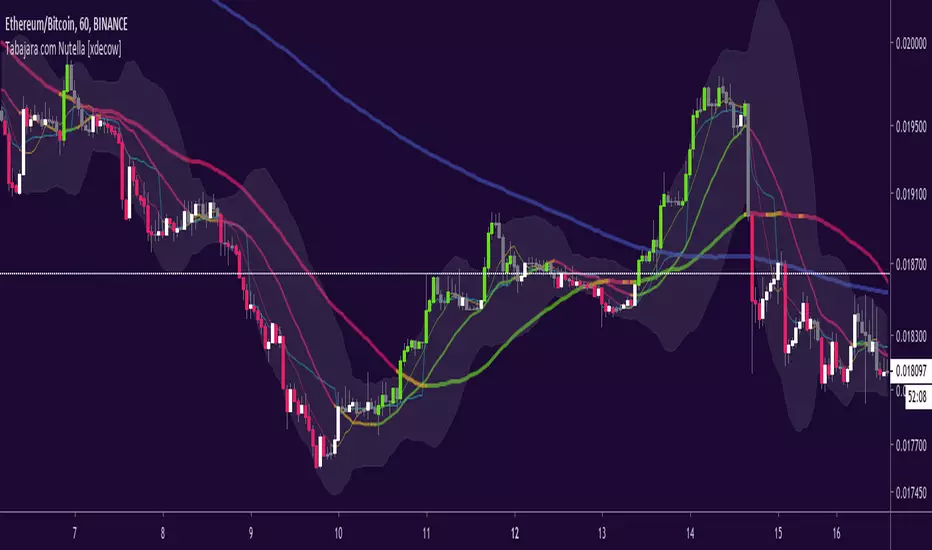
Tabajara com Nutella [xdecow]Tabajara setup from André Machado
-ma 8
-ma 20
-ma 50
-ma 200 (blue)
-vwap (aqua)
-bollinger bands
-barcolor based on tabajara rules
Multi EMA/SMA with different resolutions and labelsUp to 6 EMA and 4 SMA that each let you select the time period you want to view them on. Useful for keeping an eye on larger timeframes while watching smaller timeframes and vice versa. Hope you all enjoy!
If you enjoy it so much and are overwhelmed with joy, donations are welcome as I've just recently accomplished the going-broke phase of learning how to trade :)
BTC -- 1G4nKVgK8uJGspXyjYtsQNqiUcnXFTTQ9B
Eth -- 0x11904637C133eFb4BfF95dC8b62cF5c876E170bC
LTC -- Ld3coYyARp3NmLKWd2o9AoTMtirc949hbC