Média Móvel Simples (MMS)
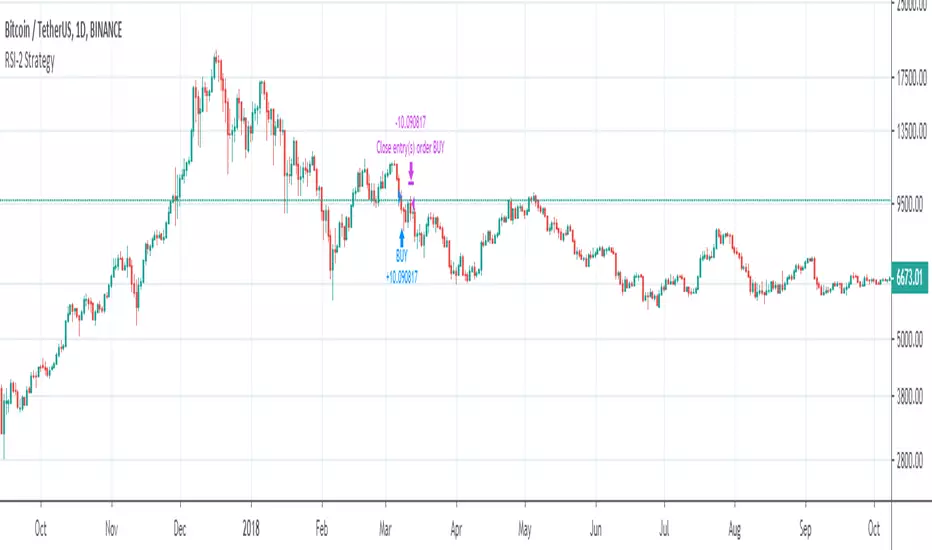
RSI2 ScaplingRule
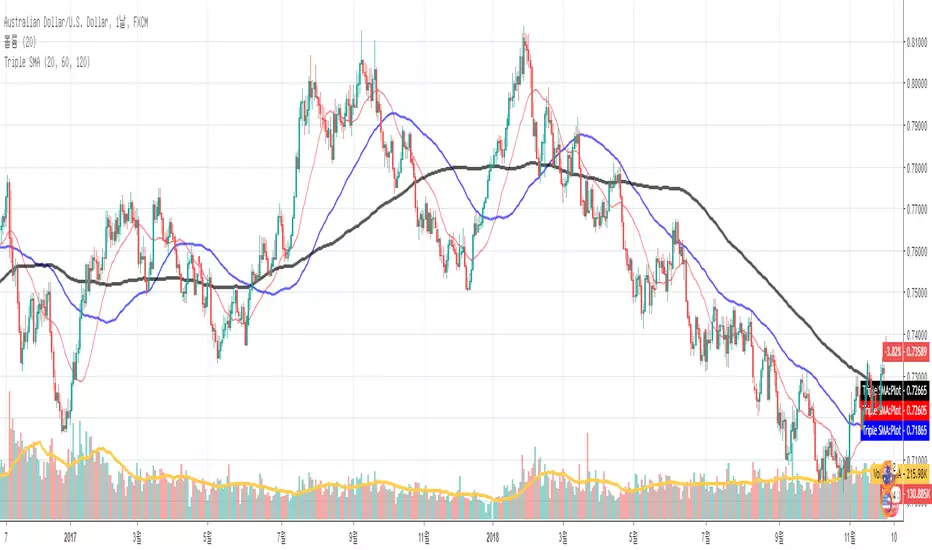
1. Price is above its 200-period moving average
2. The 2-period RSI of price closes below 5
3. Buy price on the close
4. Exit when price closes above its 5-period moving average

MTF SMAThis script overcomes the issues with TV multitimeframe being wrong due to its bugs. It generates higher timeframe SMA on a lower timeframe chart. Enter the number of minutes of the higher timeframe as a setting.
Golden Fib WavesDynamic Fibonacci levels in pleasing gold shades. Smoothing (SMA) of swing lows and highs enabled by default. Boldly, this just looks good. I am not sure whether it is of any help for trading purposes. If you do in fact find it useful, feel free to drop me a line and to share your insights.


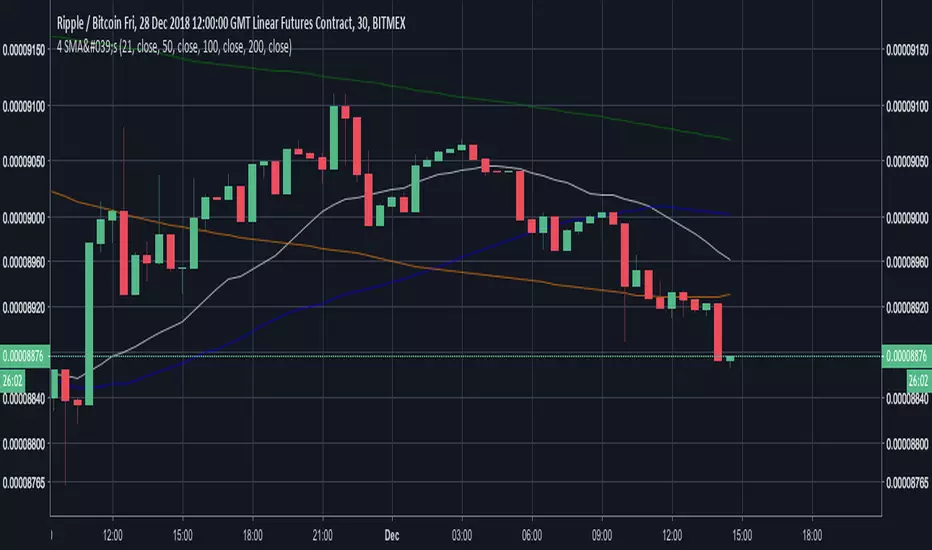
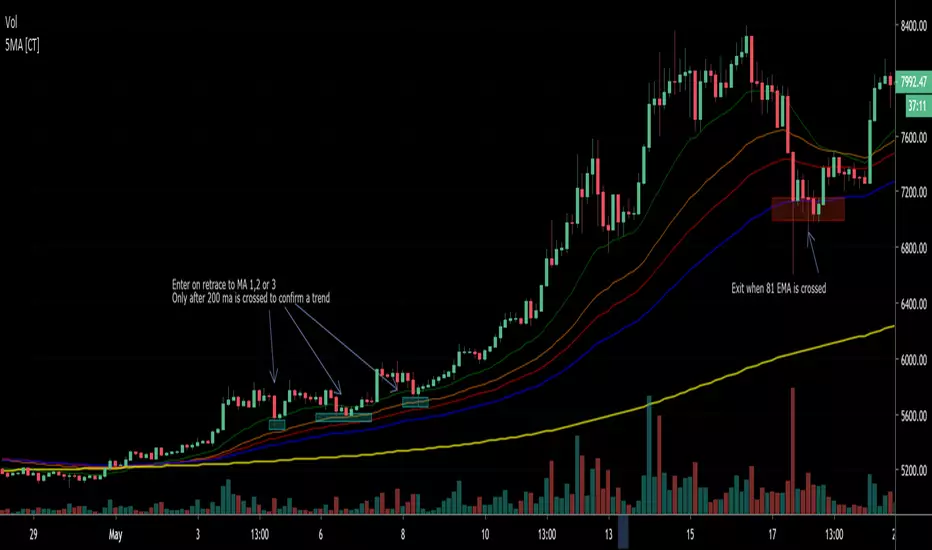
5 Moving Average (Simple / Exponential)Defaults to 1 SMA with 4 EMA bands. 200 SMA is intended to show the trend; 20,40 and 55 EMA show entries; 81 EMA is used as stop/take profit. Defaults are inspired by 'Eric Choe' but you can switch between EMA and SMA as per your own preference. Philakone uses all 5 as EMA 8, 13, 21, 55, 200
The Normalizer [BVCC]The Normalizer adds an indicator to your chart with the option to view regular Volume, normalized Volume or normalized price.
Normalized Volume divides the current Volume bar into a moving average and multiplies by 100. The resulting plot is a histogram showing how far above or below the moving average that volume bar was.
Normalized Price does the exact same thing, but uses the close price of the current candle.
The result of a normalized bar chart is that sometimes activities of unusually low or high patterns can be seen that are not obvious when looking at the standard data points.
Customizable Settings include;
1) Check/Uncheck the first box to set the view to Volume or Price
2) Check 'Normalize' when on Volume to toggle between standard Volume and Normalized Volume
3) Price is always Normalized
4) Normalization is calculated from the SMA and the default is set to 9 - John Bollinger suggest setting this to 50
5) Normalization period can be set with the 'Period' option
This indicator was created for members of the BVCC trading community as an example of the normalization methods described in John Bollinger's "Bollinger on Bollinger Bands". Mr. Bollinger talks extensively about normalization and specifically volume normalization. I added the price normalization as a fun bonus just because. :)

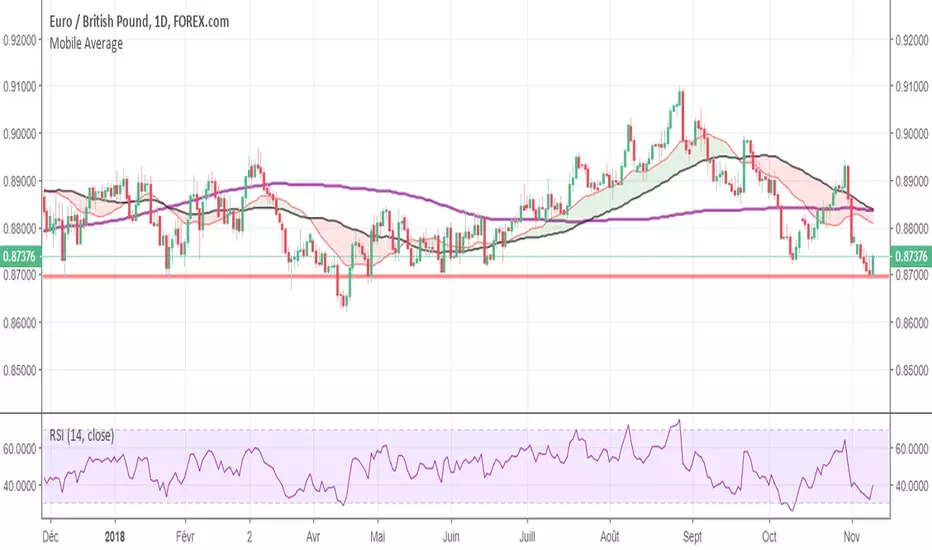
Moving AverageDisplay of simple moving average and exponential mobile average depending on period.
Simple moving average are for D, W, and M period.
Minutes and Hours periods display exponential curves.

COLLAR - RSI MACD EMACOLLAR - RSI MACD EMA
I created this "COLLAR" script by combining scripts from others.
Mentor Piet Vannoppen uses the COLLAR-technique in TC2000 to analyse charts. Because it didn't exist in TradingView, I created it. ; )
In the mean time my friend Vinpierke also created a script for the COLLAR-technique, in which he uses 4 colors.
Check these scripts. If you like it/them or have tips, let me/us know!

CS: 2 Moving Averages Script - Strategy (Testing)2 Moving Averages Trading Script - Strategy Version (For Backtesting)

50-100-200 Day SMAA simple indicator that display the 50, 100, and 200 Daily SMA. It will always display the DAILY 50,100, 200, regardless of the time frame you are looking at. Makes it easy to quickly display these key averages while also looking at smaller timeframes like 1H candles.
