Triple SMA/EMAThis indicator displays the 50, 100 and 200 period SMA and EMA and shades the area between the corresponding SMAs and EMAs
Média Móvel Simples (MMS)

Strategija 2Hello
This strategy is based on Steve Primo's No. 4 with added entry conditions. I will describe long trades only, conversely is valid for shorts.
1. Price has to be above basis SMA and fast EMA
2. Fast EMA has to be above basis EMA
3. ADX has to be above 20 (settings 14,20, fixed)
4. RSI has to be above 50 and above its 21 EMA
5. A pullback has to occur with the touch of the fast EMA
6. A bounce from that level has to occur and close above the control EMA
7. We compare N (1) bars for reverse for fast EMA bounce
Please use it on your own risk. Will add some strategy rules afterwards. My proposal is to use it on Daily and Weekly TF.

Moving Average RibbonMoving Average Ribbon:
-----------------------------------------------------------
A series of moving averages of different lengths to create a ribbon-like indicator. Traders can determine trend strength by the distance between the moving averages, the overall balance of the coloured lines and determine price points. Price movements through the ribbon can be used to identify trend changes.
SMA, EMA, WMA with user defined length, starting plot, number of plots to show, theme choice and colour calculation toggle.
Inputs:
-----------------------------------------------------------
Source: input value for MAs (close)
Type: moving average type (ema)
Theme: multiple colours/themes (theme 2)
Length: MA length (13)
Start: MA plot number to start ribbon on (1)
No. of MAs: number of plots to show; maximum 32 (32)
Colour option: unchecked then line colour is based on the source value crossing current MA otherwise the moving average below (false)
Example:
-----------------------------------------------------------
multiple MAs overlaid with different values give interesting results e.g.
Ribbon1 :
length: 13
start: 1
Ribbon2:
length:1
start: 26
Notes:
-----------------------------------------------------------
if increasing the length beyond around 150 results in "references too many candles in history" error then reduce the no. of MAs value to show less MA plots; the longer length MAs will go beyond the 5k max candle history..

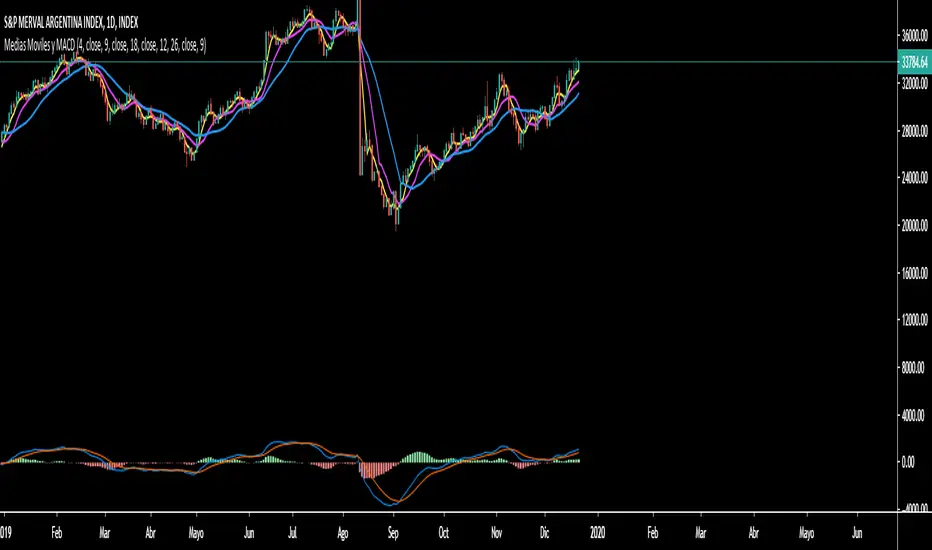
Simple Mobile Averages y MACDScript designed for users who need more than 3 indicators. It has 3 programmable "Simple Mobile Averages". MACD integrated in the main panel, also programmable.
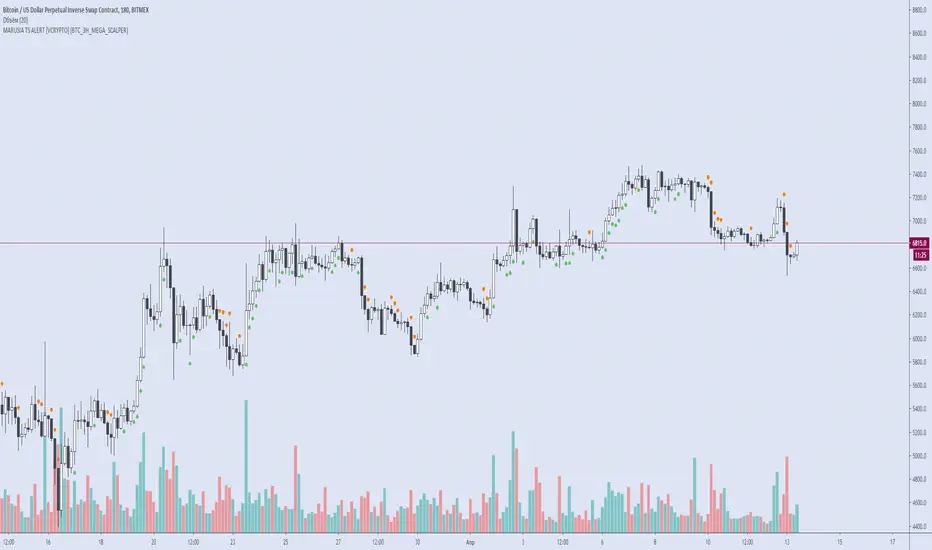
MARUSIA TRADING STRATEGIES ALERT [VCRYPTO]This is an alert indicator for MARUSIA TRADING STRATEGIES to receive alerts
for possible Buy/Sell signals.
How to use:
Use with MARUSIA TRADING STRATEGIES .
Make sure that the alert you are using and the strategy are the same
Choose alerts on TV
Add alert and choose "Long alert" or "Short alert".
Recommended to choose latency of the alerts "Once per bar".
-------------------------------------------------------------
Данный индикатор является индикатором для получения уведомлений входа в лонг/шорт позицию
по стратегии MARUSIA TRADING STRATEGIES .
Как использовать :
Используйте в сочетании со стратегией MARUSIA TRADING STRATEGIES
Обратите внимание, что в индикаторе и в стратегии выбраны одинаковые стратегии.
Нажмите на уведомления на ТВ.
Нажмите добавить уведомление.
Выберите "Long alert" или "Short alert".
Рекомендуется поставить частоту получения уведомлений "один раз за бар".
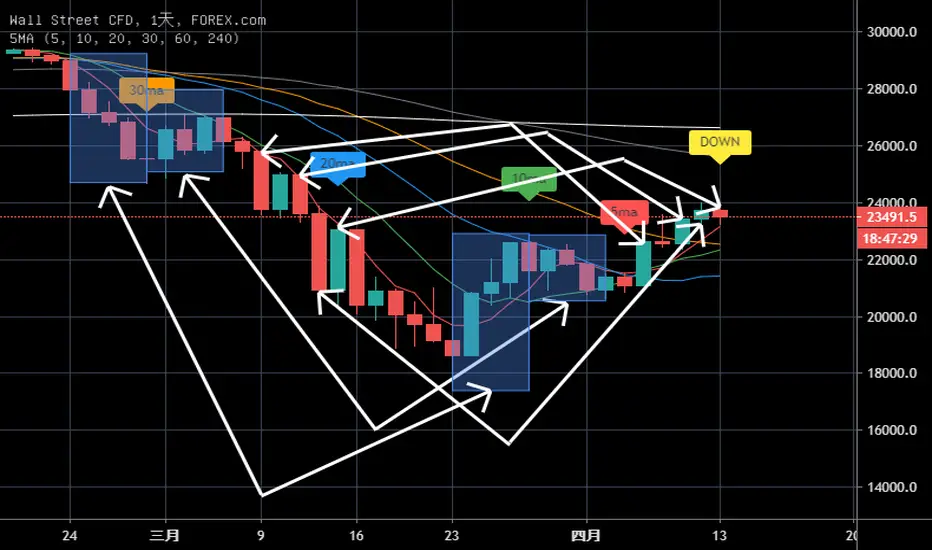
6 SMA&look back 20SMA strategy6 SMA&look back 20SMA strategy
The moving average is calculated based on historical prices and is a backward indicator,Unable to forcast future prices.
But the moving average still represents the price trend, so we can forcast by moving average.
Each point of the 20-day SMA is calculated based on the closing price of the past 20 days.
Therefore, we can know that the closing price of the first 20 days directly affects the latest point of SMA.
The last 20 days are the prices included in the calculation, which directly affect the trend of the latest points.
For example,if the day before the 20th is a sharp fall, the latest SMA becomes an upward trend;If the day before the 20th is a sharp rise, the latest SMA becomes a downward trend,it showing the opposite trend
Recommended to use the daily trend.
Good Luck
移動平均線是根據歷史價格計算,屬於落後指標
但是移動平均線仍代表價格趨勢,因此我們可以通過移動平均線進行預測。
20天均線的每個點都是基於過去20天的收盤價計算的。
因此,我們可以知道前20天的收盤價直接影響SMA的最新點。
最近20天是計算中包括的價格,它直接影響最新點的趨勢。
例如,如果20日之前的一天是急劇下跌,則最新的SMA成為上升趨勢;如果20日之前的一天是急劇上漲,則最新的SMA成為下降趨勢,呈現相反的趨勢。
參考老王對SMA扣抵值的簡易版應用
使用20MA的扣抵蹺蹺板來判斷今日可能是UP或DOWN
建議使用日線
祝好運
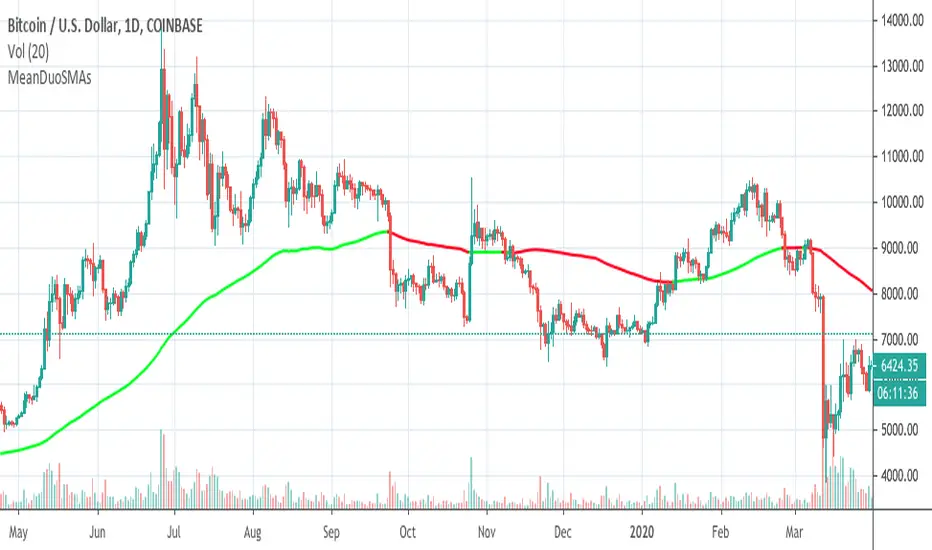
MeanDuoSMAsMean of slow SMA200 and fast SMA50. Color changes according to position of close price vs indicator value. Works best with BTCUSD daily chart.
Fancy Triple Moving Averages [BigBitsIO]This script is for three moving averages with as many features as I can possibly fit into a single moving average.
Features:
- Three moving averages (MA1, MA2, MA3).
- Standard MA inputs.
- MA type.
- MA period.
- MA price.
- MA resolution (time frame).
- Visibility toggle.
- MA Candle Type
- Fancy MA inputs.
- Toggle to show only candles included in the MA calculation ("Highlight inclusion") or display entire MA history.
- Toggle to show a ghost trail when Highlight inclusion is toggled on. Displays a shaded version of past MA history before the inclusion period (as seen on snapshot).
- Toggle to show forecast values for the MA.
- Other inputs related to forecasting:
- Forecast bias. (Neutral forecasts MA if the current price remains the same.)
- Forecast period.
- Forecast magnitude.
*** DISCLAIMER: For educational and entertainment purposes only. Nothing in this content should be interpreted as financial advice or a recommendation to buy or sell any sort of security or investment including all types of crypto. DYOR, TYOB. ***

Theft Indicator - 5Min Scalping SystemWhat is our indicator?
Theft Indicator - Buy & Sell Alert System is our first published script that shows price action on a certain period of time (We Use ATR indicator). We take pride in enabling trading to become easier for the experienced and the non-experienced traders around the globe. Buy & Sell alerts will be fired once a condition in our algo is met.
Does it Repaint?
Our indicator does NOT re-paint. Although while setting an alert it may pop up the repaint alert, please take into consideration that once a signal is fired on a "CLOSED BAR", our signal will never disappear, they do not repaint.
What Markets is it usable with?
You can use it in any market, Forex, Stocks, Crypto, Indices. All time frames are profitable, not all trades. But the Majority is profitable if you use a stop loss and target price.
How to use:
Simple plug and play it to your chart, in addition to a few other indicators we will recommend to you (we still have not published them yet), and this will confirm your trades. You can also connect TV alerts with a bot and let it run. Please be aware that SLIPPAGE time is important, If you run a bot on this indicator you HAVE to know that the buy/sell price will be on the bar AFTER the Candle close (For example: the BUY/SELL alert is on a candle, the buy/sell your bot or you will execute WILL be in the following candle depending on your trading system. We advise you to not leave the bot to trade on its own, you have to monitor and have a specific syntax that we will help you with creating according to your trading style.
How are the Buy/Sell Alerts fired?
We use the simple ATR (Average True Range) indicator. However we have modified the indicator to serve our trading system. Check below for a definition of what ATR is:
What is Average True Range - ATR?
The average true range (ATR) is a technical analysis indicator that measures market volatility by decomposing the entire range of an asset price for that period. Specifically, ATR is a measure of volatility introduced by market technician J. Welles Wilder Jr. The true range indicator is taken as the greatest of the following: current high less the current low; the absolute value of the current high less the previous close; and the absolute value of the current low less the previous close. The average true range is then a moving average, generally using 14 days, of the true ranges.
Why is our indicator special and different from the normal ATR indicators?
We have modified the mathematical equation and changed it slightly to give more accurate signals, we do not promise all trades are profitable, the use of this indicator is up to your own judgement and liability. We believe that we have an indicator like no other ATR.
P.S: This is not financial advice, we are just sharing our indicator that we know has good results, and it will take time for people in -ve profiles to recover losses and for the profiting to be more profitable. We use a specific trading method that only works with it
You can contact me for more information about the indicator, Goodluck :)

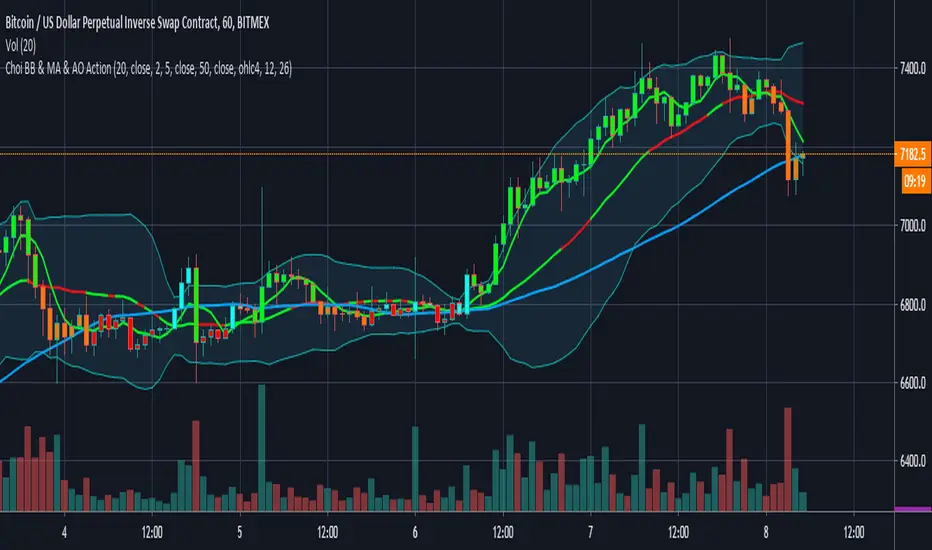
Choi Bollinger Band, Moving average, Awesome Oscillator Action Combine Bollinger Band signal with Awesome Oscillator signal by changing the baseline of signal Bollinger Band as well to show trading status.
This also includes 5-day and 50-day Moving average signals and the color change of candles To show trading status.
Multi Timeframe Moving Averages This indicator allows you to view a moving average ( EMA or SMA ) of your choosing on other time frames than what you are currently on. You just need to edit the script and plot MAs that you want to see.
This is based on awesome work of @millerrh at but now instead of read inputs, I just plot what I desire with correct labels.
The reason I used that was that I wanted to see daily MAs in 15min, 5min and 1min charts.
To use the script add to your chart and edit it, you can add or remove any MA you want at end of file and then add it to your chart again.
The code off course is open source.

Fill Strength Gradient [BigBitsIO]This script plots two moving averages but is mostly designed to highlight a fill strength gradient. The fill strength gradient shows a more opaque fill based on the current percentage difference of the current difference to the maximum difference in two MAs in a trend.
Citation: PinceCoders - Slight modification on color functions

BTC Mayer Multiple BandsIntroduced by Trace Mayer as a way to gauge the current price of Bitcoin against its long range historical price movements (200 day moving average), the Mayer Multiple highlights when Bitcoin is overbought or oversold in the context of longer time frames.
It's worth noting that as the market becomes larger and less volatile, the peaks are becoming less exaggerated. This is because a 200 day moving average baseline is a static yardstick against an ever growing, more stable, Bitcoin market. We should recalibrate what constitutes the overbought/oversold extremes on this chart accordingly.
Idea by CryptoKea. Original author:

SimplicityA simple all in one indicator. Combines a simple moving average with an ATR-based money management system. Simply buy when a candle closes above the MA, and sell when it closes below. Set first TP at 1ATR and initial SL at 1.5-1ATR. When price hits 1st TP, exit half of your position. Use the MA to trail your stop on the other half of the position.

Color Changing SMAsEnter any 5 Simple Moving Averages in Input.
The SMA will be green if the price is above it.
The SMA will be red if the price is below it.
By default the color is set to green and red for all of them. I identify them by their transparency.
You can change the colors and the transparency levels to your liking in the settings.
XBT_Calc._TradersStreamLiqudity Calculator for XBTUSD. And Simplified SMA Cross Overs. If value is True than SMA 21 and 200 is active else SMA 30 and 40. Most of the Traders use this cross overs for Scalping purpose.

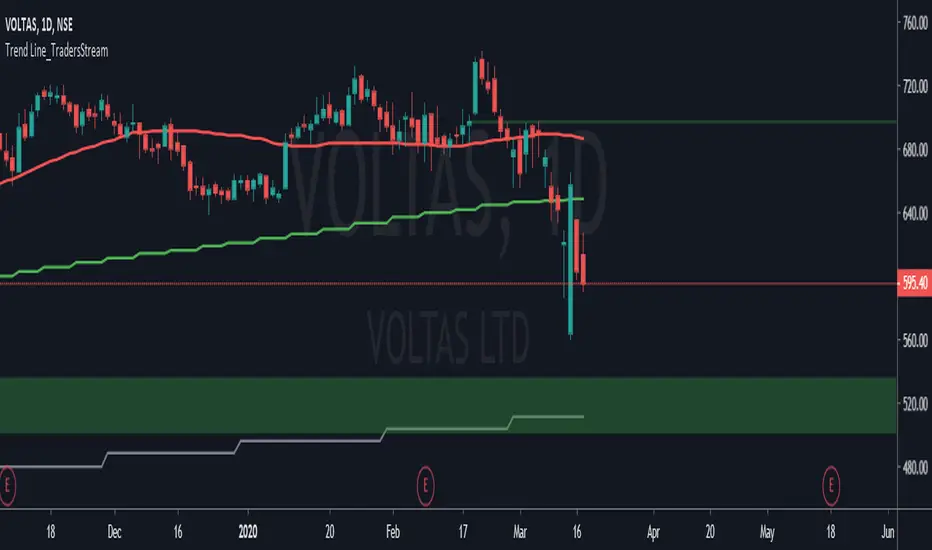
Trend Line_TradersStreamIn this Indicator you will find Multiple Trend Lines like SMA , EMA, RMA, WMA and VWMA. And this Trend lines shows Daily, Weekly and Monthly Trend on any time frame chart. So, that you can get overall trend of the Stock.
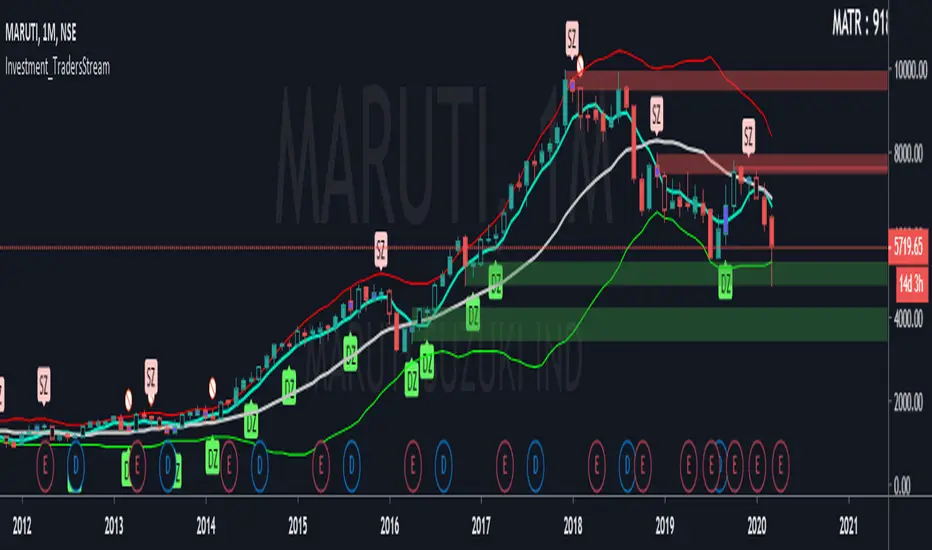
Investment_TradersStreamHello Guys here we are introducing another important tool, in that you can anticipate when to enter Market for Long term Investment and when to Exit you Positions from Long term Investments. We introduced some of uniq indicators that helps to calculate the Risk. Those are Exhaust Candle, Time or Price correction of stock after a strong movement special Moving average to calculate monthly Trend and one of the popular indicator to know that how much movement happened in a stock from a mean line (Bollinger Band). Please comment below for any information.......
ATS Masters Indicator #2This ATS Master Indicator #2 is a collection of multiple useful indicators, which only requires one indicator slot in TradingView.
In this collection you will find the following 12 indicators:
Bollinger Bands (three different types: Fibonacci, Standard, Improved)
Moving Averages (up to two individual MA indicators)
Exponential Moving Averages (up to two individual EMA indicators)
Double Exponential Moving Averages (up to two individual DEMA indicators)
Tripple Exponential Moving Averages (up to two individual TEMA indicators)
Volume Weighted Moving Average
Weighted Moving Average
So, using this master indicator you are able to use up to 12 indicators in one.
If you would like to test this master indicator drop me a line and send a request for it.

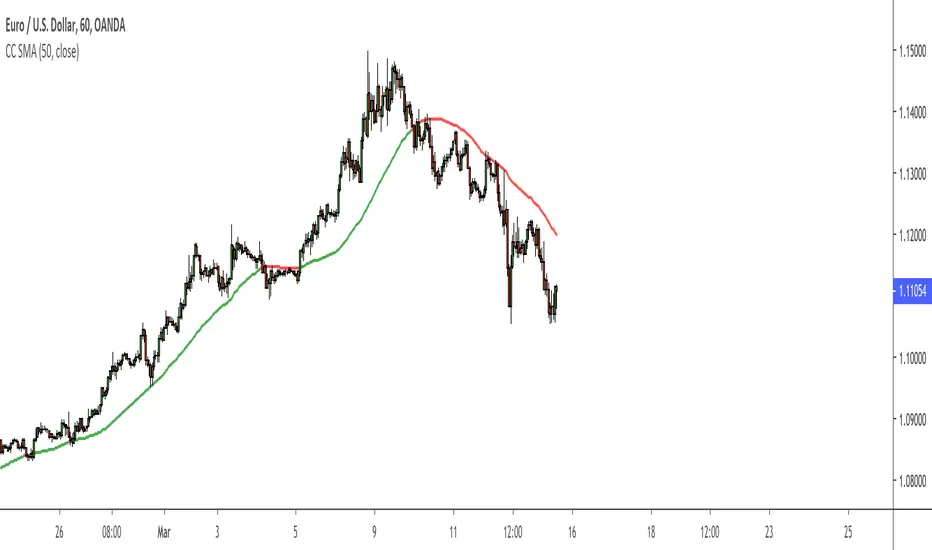
Color Change 50 SMAThis 50 SMA changes color based on the trend of the market.
If the SMA is green, use your edge to determine when to buy.
If the SMA is red, use your edge to determine when to sell.
Can be used on any timeframe and market.
Customize this to meet your needs.
Bitcoin Cycle Top IndicatorBitcoin Cycle Top Indicator on the 1W Bitcoin Logarithmic chart.
Called all 3 tops so far to a T, this indicator will be great use for the next upcoming cycle.
I kept it sweet and simple, no need to overcomplicate. That's all this indicator does.

WIM-[WorldIsMine]An entry index that adds VWMA as an essence to be aware of trading volume in addition to SMA and BB which are valid in all investment markets.
With alert.

Multiple Moving Averages {Cybernetwork}Multiple moving average (MA) plots in a single script.
Can select between different MA types, and enable/disable a particular MA in the settings.
Enjoy. :)
