Trading Range ExpansionThis script is trading for the false breakout of the trading range. Once the price makes a break out and get rejected back into the range. The signal triggered for the opposite direction.
Signals

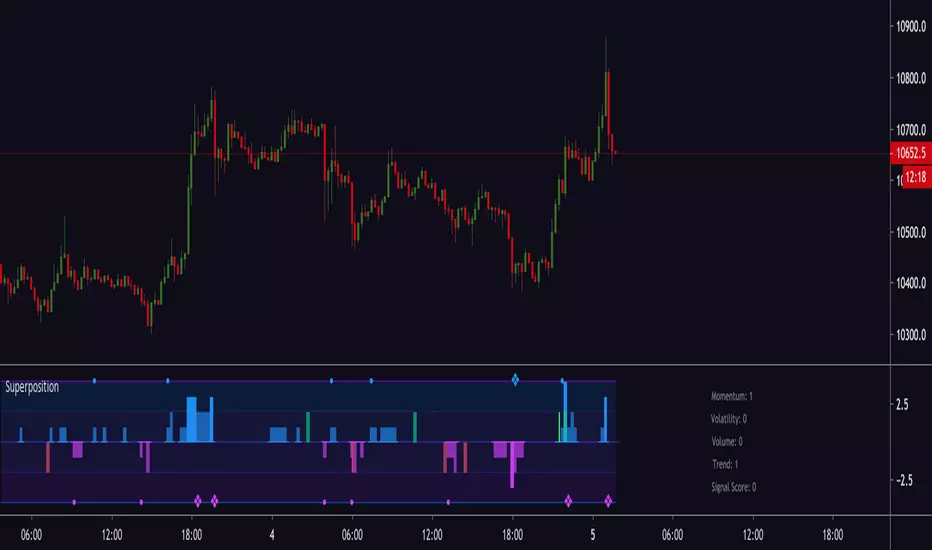
Magick SuperpositionExperimental histogram based on multi indicator signals.
Generates a score based on:
Trend
Volatility
Momentum
Price and volume changes
Candlestick patterns
and many more.
Can be used to detect top and bottoms, reversals, trend, best moments to enter a trade and more.
Invite-only.
Trial available.
Implied Volatility Rank & Model-Free IVRThis is an update to my previous IV Rank & IV Percentile Script.
I originally made this script for binary/digital options, but this also can be used for vanilla options too.
There are two lines on this script, one plotting Model-Based IV rank and Model-Free IV Rank.
How it works:
Model-Based IV Rank:
1. Take whatever timeframe you're using and multiply it by 252. This is done because typically IV is calculated over a year, which has 252 days. But this can be used for any timeframe, so just multiply you're timeframe by 252. In the picture above I'm using a 30 min chart, so I multiplied 30 min by 252 and got 7 days, 14 hrs , and 30 min.
2. Next input the result you got from step 1 into the corresponding input boxes.
3. Then input the timeframe you are using into the input box labeled timeframe. I'm using 30 min so I put 30.
4.Finally choose the delta that you want to use and input its standard deviation into the input box. There is a list of common deltas and their corresponding standard deviations in the menu so you don't have to go looking them up. Typically 16D or 1 standard deviation is used when calculating IV, but you can choose whichever one you want.
*FYI. For people trading binary/digital options, the delta of a vanilla option is the same as the price of a binary/digital option. This is because the delta is the first-order mathematical derivative of the vanilla option's price, and a binary/digital option is a mathematical derivative of a vanilla option. So when you see the list of deltas and their corresponding standard deviations values, just know that 40D=$40 binary, 30D=$30 binary, 20D=$20 binary, and so on. But again typically the 16D or $16 binary's standard deviation value would be used*
This calculation of IV rank is useful for vanilla option traders who use Tradingview and don't have access to this metric.
This calculation of IV rank is useful for binary/digital option traders using Tradingview because the only two regulated binary options exchanges: the CBOE and Nadex, do not offer advanced options data, such as IV rank. On the CBOE and Nadex only the market-makers have this data, which they get from their own in-house pricing models. So at least now any binary option traders can have the same data as the market makers that they are trading against. Also if your wondering how accurate my pricing model is; just know that I have have compared the prices given by the pricing model to realtime prices on Nadex (live account) and the prices that my model shows for differing strike prices matches the prices that the market-makers set. So the pricing model, upon which this IV rank is based, is accurate.*
Model-Free IV Rank:
This IV Rank is based off the VixFix and just ranks the VixFix's values over the past 252 periods. In the menu you can see the recommended periods for calculating the VixFix, with 22 being the one most people use. This is the exact same methodology used in my original IV Rank script.
Which should you use?
This is up to you and each have their own pros and cons.
The main pro of using the model-free version is that because it does not rely on a pricing model, it does not take as many steps to calculate IV and therefore can update its IV projections much quicker than the model based approach. This is why if you zoom out the model-free version will have a more choppy appearance than the model based.
The main pro of using the model based version is that this is what the overwhelming majority of options traders use, and can be applied to any option delta you want, while the model-free version only calculates IV rank on the 16D aka $16 binary aka 1 standard deviation strike.


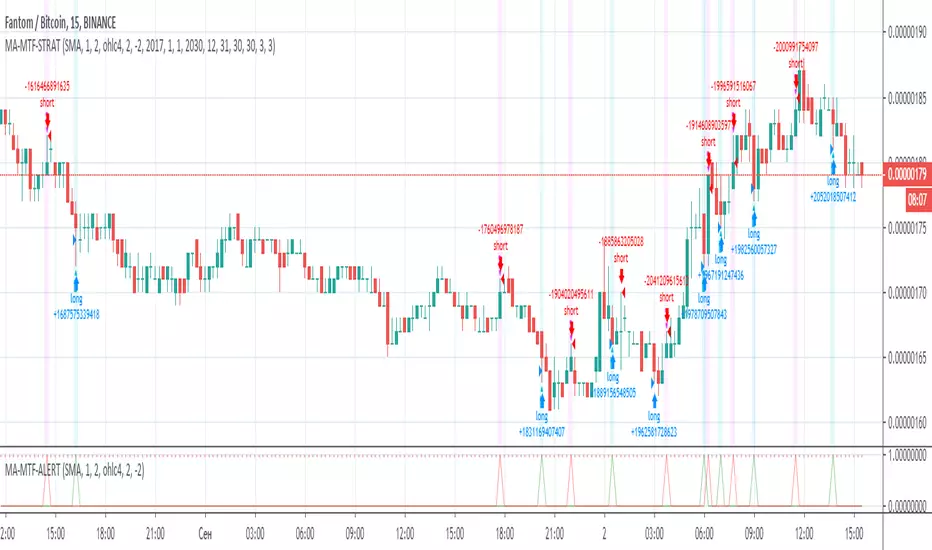
MA-MTF-ALERT// Alerts based on SMA strategy
// Time frame 5M, 10M, 15M
// Created and based on Binance chart
// Working with comission
// No repaints
CoinExpert OscillatorCombined Oscillator with amazingly accurate Buy/Sell signals and alerts.
Includes warnings for possible tops, possible bottoms , etc.
Also contains many perfectly refined indicator s ( VWAP , MFI, MOM, EMA distance) that help serve making the right decisions .
Combined with CoinExpert Overlay and CoinExpert Trend it is possibly the best trading tool up to now .
This is not an indicator, this is a WINdicator!
For access and prices, add me on Discord, Amnesio#0001 or message me here, on Tradingview.

CoinExpert TrendTrend Analysis, shows clear direction of the market
Includes automatic Zig-Zag tracement to show reversals coming up & also has a refined version of different variants of MA's to show really strong support/resistance channels.
Combined with CoinExpert Oscillator and CoinExpert Overlay it is possibly the best trading tool up to now.
This is not an indicator, this is a WINdicator!
For access and prices, add me on Discord, Amnesio#0001 or message me here, on Tradingview.

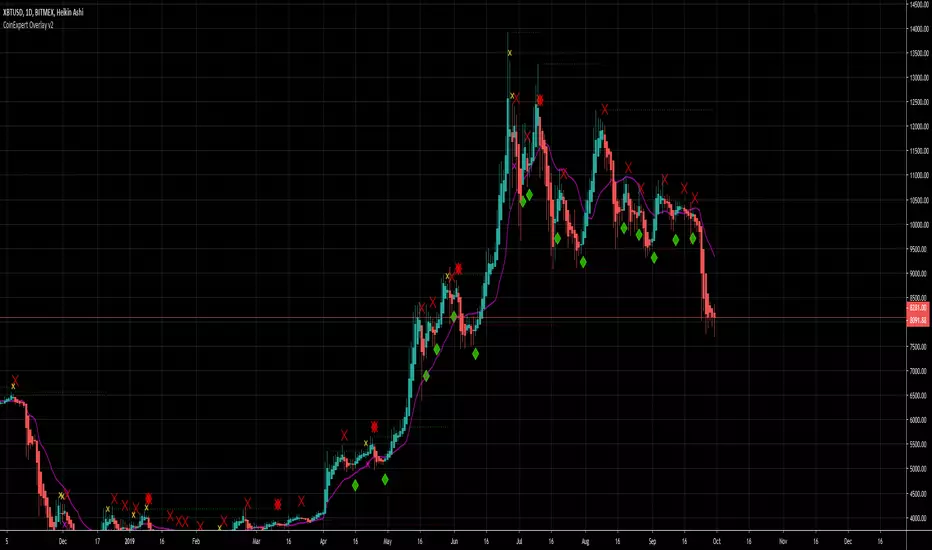
CoinExpert OverlayCandlestick and Trend Analysis with amazingly accurate Buy/Sell signals and alerts.
Includes warnings for possible tops, market manipulation , etc.
Also contains many perfectly refined indicator s ( VWMA , fast/slow EMAS/SMAS, parabolic SAR flip, auto Support/Resistance levels) that help serve making the right decisions .
Combined with CoinExpert Oscillator and CoinExpert Trend it is possibly the best trading tool up to now .
This is not an indicator, this is a WINdicator!
For access and prices, add me on Discord, Amnesio#0001 or message me here, on Tradingview.
Magick Trading SuiteWelcome to Magick Trading Suite!
One of the most powerful indicators! Customizable to your heart’s content. No repainting!
Includes:
Candlestick analysis
Pivots
Reversal detection
4+ bar color types
Supports combined instruments
Supports different sources
Trend median - amazing way to detect support and resistances
Daily open
Top and bottom detection
Adaptive ATR stop loss/trend
2+ special moving averages
and more!
Overwhelmed? You can turn off what you don't like!
Comes with manual.
Shout-out to @Nico.Muselle, @alexgrover, @JustUncleL, @ucsgears, @writner for creating great scripts that give me ideas for my indicators.

CoinStudio Signals Full (read the description)CoinStudio Signals Full displays long and short, as well as reasonable targets and allows to set custom alerts based on them.
Possible targets are flagged as "C" for the most previously occurred signal. These targets indicate chances to sell before an expected reversal.
If the signals switch from let's say Short to Long and there are no targets between them, it either means the signal failed or the target is falling together with a new signal.
CoinstudioSignals work for any asset (crypto, stocks, gold , silver , etc.) and work for every time-frame.
However, daily and 4hr usually give the best results.
To add this script, please send me a message and ask for an invite!

CS Signals Full (read the description)CoinStudio Signals Full displays long and short entries and allows to set custom alerts based on them.
The signals work for any asset (crypto, stocks, gold, silver, etc.).
In principle, the signals work for every time-frame but depending on the asset some work better than others.
However, daily and 4hr usually give the best results.
To enable this script, please head to our Discord and ask for an invite:
discord.gg

ape[x] gooseBangerPowered by apeX trading algorithm
Suitable for all 5m time frame and every market of this world including cryptocurrencies, forex, traditional stocks and options.
Discord for more info : discord.gg/3NXpFYB

Composite Movement Indicator w/ Volume-Weighted Balance of PowerThe CMI+ is a composite indicator based on numerous other indicators and some special sauce that helps identify imminent directional changes in an asset's price. While CMI+ was designed for crypto assets, it is also quite useful in traditional markets.

B3 FisherTransformThis is the indicator from the trading strategy I posted recently. I do like Fisher Transform a lot on day bar charts. However, the smaller you go in bar interval, the less I feel it is as usable. At that point, any oscillator will usually do. When comparing the slope of the line and direction to the chart price action using day bars, I get a great sense of when to enter into a swing.
The indicator is often earlier to turn than other indicators, therefor, occasionally a trade may take a day to 3 days to start moving well in the desired direction, but it is never late which is very nice!
Use in conjunction with your support and resistance levels to find great entry points on reversals.
Use in conjunction with moving averages to find the reentry into a continuing trend.
Features include bar paint, zero line, and adjustable deviation values to target trend continuation and possible max oscillation reversal trades.
Enjoy! ~B3 d^.^b

Hull Trend with KahlmanThis is an update to the idea of
The Kahlman smoother makes the signal more precise (by one candle).

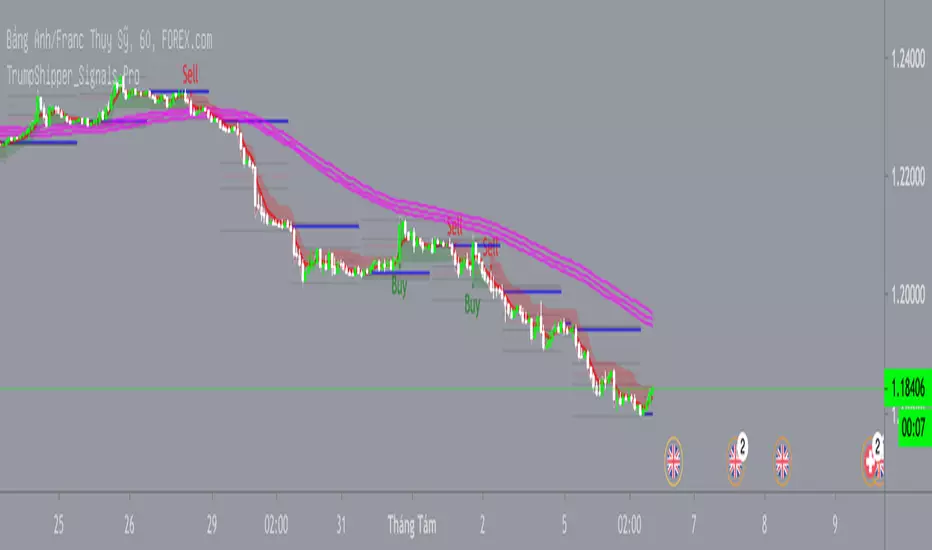
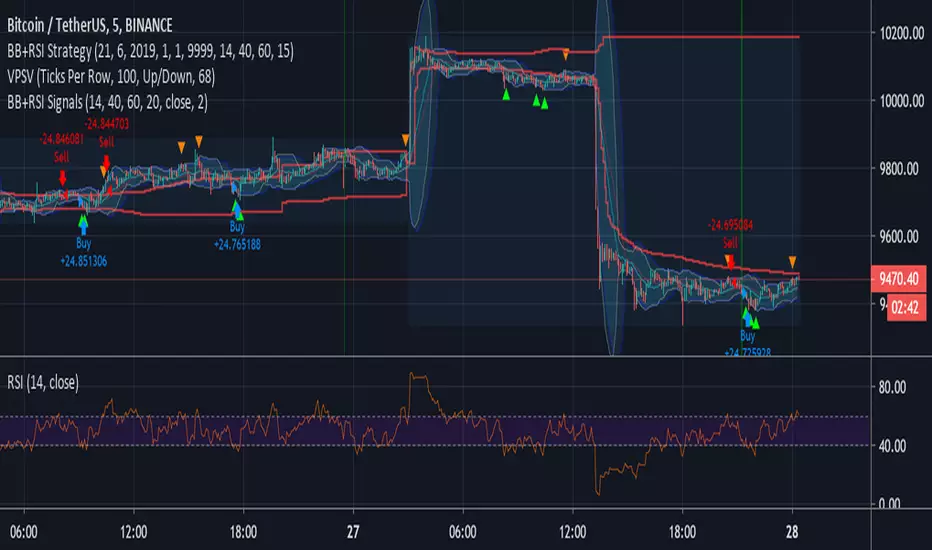
Bollinger + RSI Signals (by Bader Kamal)This idea originally by ChartArt on January 14, 2015 as Strategy, and I modify it to become as Signals on 26 July 2019.
This signals uses a modified RSI to sell when the RSI increases over the value of 60 (or to buy when the value falls below 40), with the classic Bollinger Bands strategy to sell when the price is above the upper Bollinger Band (and to buy when this value is below the lower band).
This signals only triggers when both the RSI and the Bollinger Bands indicators are at the same time in a overbought or oversold condition.
Crypto Fund indicatorThis indicator is just a slight modified version of the godmode indicator developed by xSilas.
It helps to spot and extreme building selling or buying pressure.
I use it mainly for BTC on the 1h chart but can do the job on other crypto-assets and timeframes such as 5min, 30min etc.

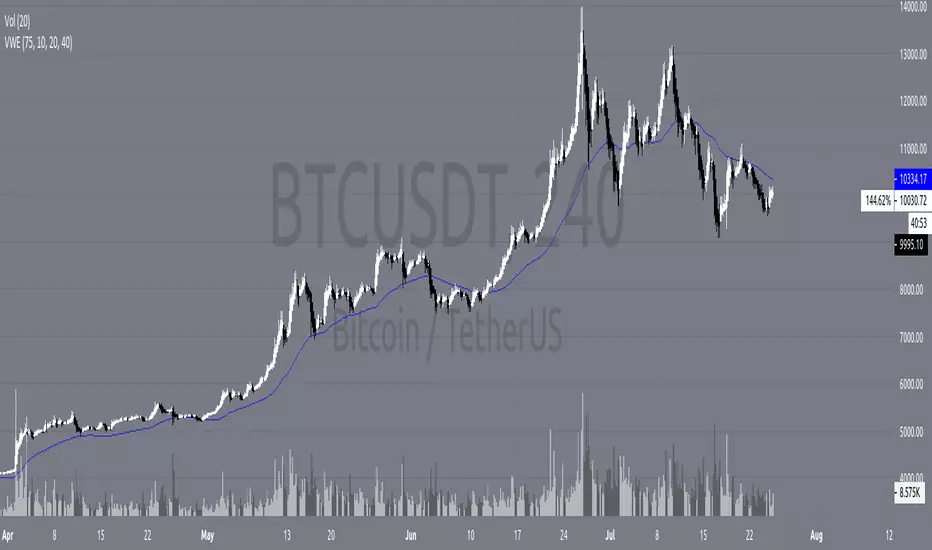
Volume Weighted EMAAn EMA using the Volume Oscillator to integrate volume fluctuations into the EMA calculations.
Especially useful for Crypto and Forex
Oasis Trading SuiteOasis Trading Suite
Introduction: The Oasis Trading Suite is a TradingView indicator designed to make following trend and finding key pivot points very easy. It provides the trader with advanced trend coloring for candles, pivot points both high and low, and a trail that will follow price and give signals when a “buy the dip” or “sell the rally” opportunity is presented.
Part One: Candle Coloring
The Oasis Trading Suite colors candles based on a trending bullish or bearish bias; this will override the default red/green coloring of candles which is based on closes.
Bullish Candles will be denoted with a green color by default.
Bearish Candles will be denoted with a red color by default.
Neutral Candles will be denoted with a gray candle by default. These are candles that do not have a trending bias.
Part Two: Pivots
In addition to the normal red/green/gray candles there are also blue and orange candles. These candles are pivot bars.
Blue bars denote Bottom Pivots
Orange bars denote Top Pivots
These pivots are not exactly support and resistance, but more of a zone of influence. They can act as support and resistance, swing zones, and breakout points. These are not standard pivots, they do not repaint, they form live and once closed will not move candles.
Part Three: Trail
Finally, the Oasis Trading Suite gives the trader a trailing line that will turn green or red depending on trend. If price falls to the trail and the low (for green trail) is the only thing below the trail it will give a “buy the dip” signal. If the high (for red trail) is the only thing above the trail it will give a “sell the rally” signal. This trail is slightly lagging, so when trend is shifting there will sometimes be false signals at the final shifting point. I am experimenting with removing as many as possible using the “Strict Mode” found in the input settings for the Oasis Trading Suite.
Buy the Dip will be denoted by a Blue Arrow
Sell the Rally will be denoted by an Orange Arrow
For Access or Questions: Private message us. Thank you.

Oasis Trend StrategyThis is a simple script developed to give a quick visual of trend on any given time frame.
This is a script that gives signals of trend switches. Can be used to for buying and selling signals.
On larger time Frames we use the Aqua and Fuchsia Clouds to express the larger time frame trends.
This can be used for long term swing trades especially useful with the 4hr, 6 hr, and daily chart to cancel out all the noise within the larger trends. The smaller Blue/Red Clouds can be used within trend if you are a skillful trader.
On smaller time frames (Intraday), we used the Blue and Red intraday price action. Is meant to be used
alongside with the Aqua/Fuchsia to create short term trades decisions within the short term trends indicated by the Aqua and Fuchsia.
The 9 ema is used to keep a close eye on short term directional changes.
You would want to see if price stays above or below this level along with its price action.
This should give you initial signs of strength or weakness.
The 55 ema (Black) is used to determine larger trend directional changes and for confirmation of trend shifts.
If interested, you can learn a lot just by watching the price react to these levels and can really visualize the price action that encompasses these averages.
We recommend that all traders study Technical patterns, Price action, Financial risk management, and other pre-trade planning strategies to minimize drawdown risk.
Please give us a like and a follow if you like this indicator. Its simple and very easy to use.
We are not financial advisors. We do not give financial advise. Please use this indicator at your free will.
We are not responsible for any financial losses or claims.
If you find this indicator very useful as I have, we do appreciate any amount of tips.
This will fund us to create more indicators to be made for your use.
BTC - 3PmVmmsnuLedg7umzVkLnarKRo43g6P5Tp
ETH - 0x9a1Ba8809687D8d9A1D32Ed1602abEef48060aF1
LTC - MAgqbC6Kev1x3L2GvNwzhZacyBRxCKJ8Mi
ZCash - t1UYRLzQxeaHCNYfA9cLChfBX5mbcNqworA
0x - 0x2B07D8BFB20b6eDb9A498113764082211cdFA2cE
Many free Tradingview users can benefit from our indicators as we employ many many useful indicators that can be toggled in each script to surpass the indicator limits.


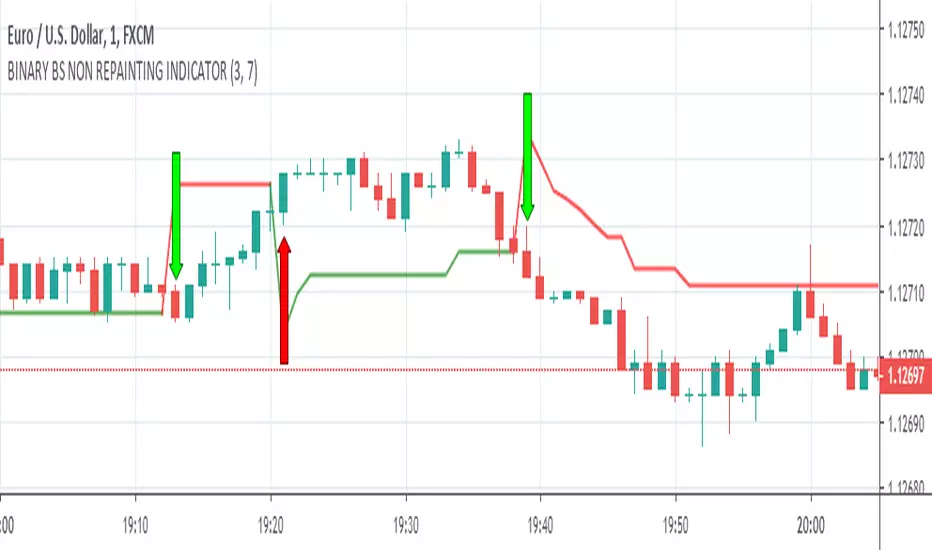
BINARY BS NON REPAINTING INDICATOR
Hello Binary Options traders, do you worry about loss in binary, now no need to worry, search my page in Fb, named "IQ Option Traders PK " ,like my page and send me a message, i will send you details of my strategy free of cost.
or comment below i will respond you.
thanks