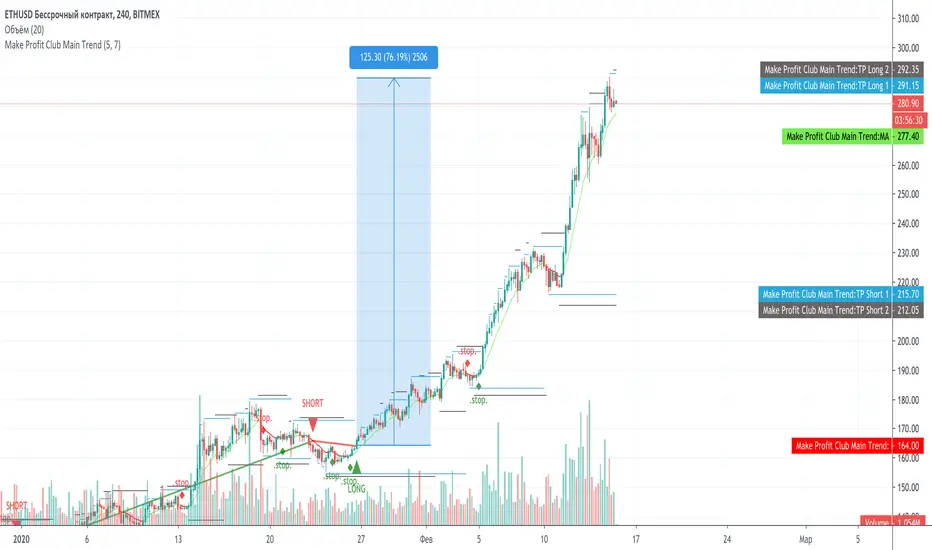
Make Profit Club Main TrendThe main trend indicator.
Suitable for 1H-1D, on any exchange and on any coin, currency pair, index.
There are basic settings that allow you to adjust the indicator individually for each situation.
Signals
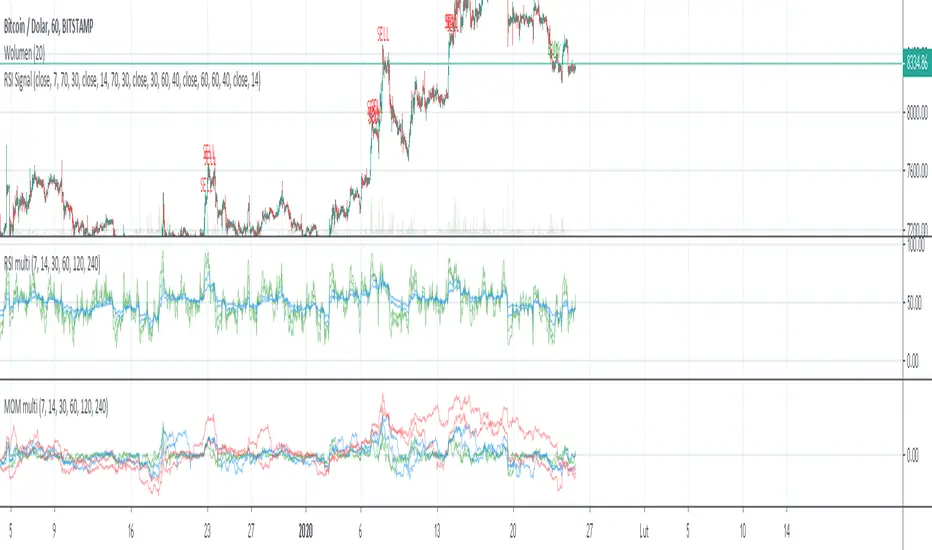
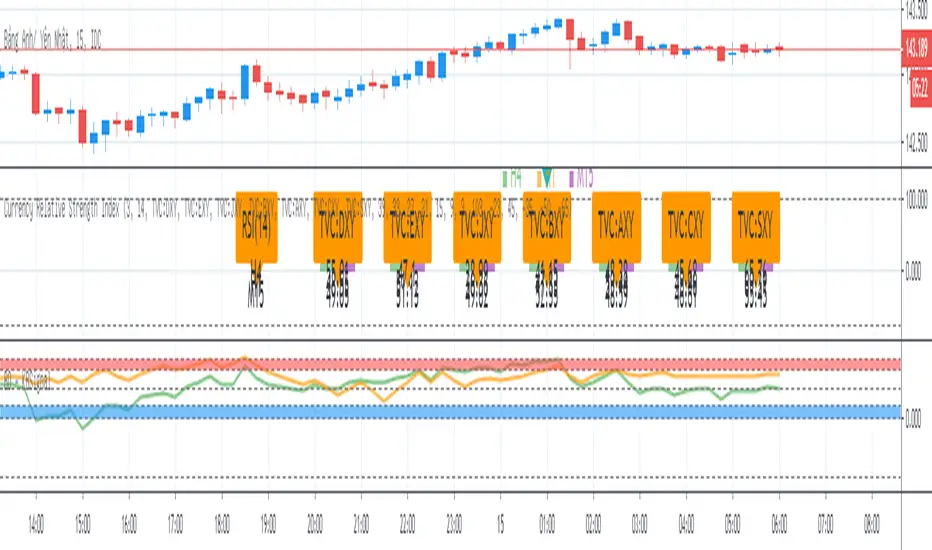
Multi RSI + Signal OB/OSSignal of Overbought and Oversold based on 4x interval of RSI and Momentum. You can change interval and source
Simple Reversal PointThis indicator finds possible points of reversion, you can use it to stack positions and get a good average price for when the price changes direction, it is the trader responsibility to manage the position and make a profit.
-Added alerts
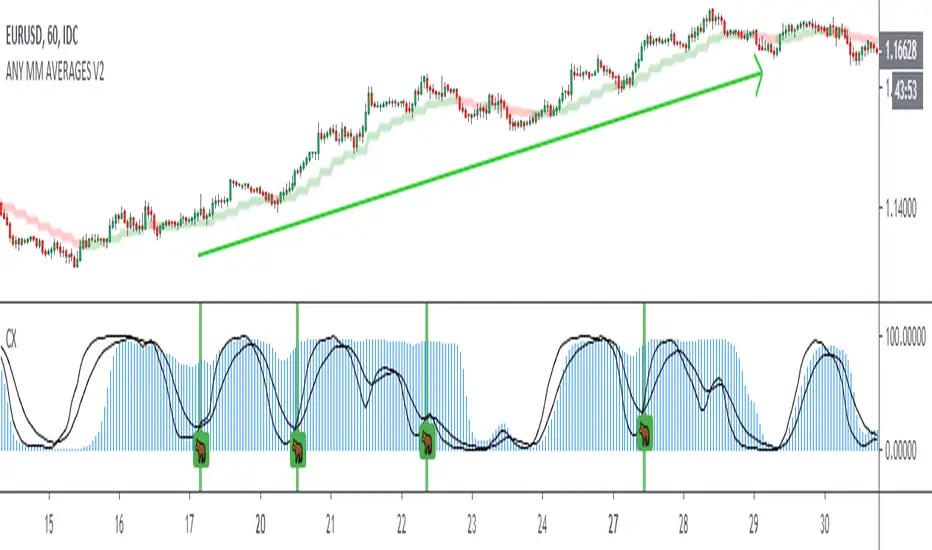
Crack XThis indicator looks for cracks (de-correlation of 2 indicators), what you have to do is simple, first look at the trend in a higher frame, there are many indicators for this, then look for cracks as wide as possible (you can configure the size in the configuration) and that they are not close to important supports / resistances. This indicator can be very useful for Swing, Coverages, to increase existing positions.The confirmation of the crack occurs when the black lines cross + bar closure.
- Added Alerts
Premium Stochastic OscillatorThe PSO is a rewired version of a short-period stochastic. Unlike a standard stochastic oscillator, this indicator is normalized to register neutral values at zero while providing greater sensitivity to short-term price moves. This indicator uses a central zero line as a reference point and will oscillate above and below this point as price fluctuates. In addition, the PSO is smoothed by using a double exponential moving average to provide a more even response to turns in the market.
(from TASC magazine, August 2008 issue).
The Premium Stochastic Oscillator was introduced by technical analyst Lee Leibfarth.

BO - KBSignalBO - KBSignal show Put or Call Signal inoder to trade Binary Option.
A. Indicators
1. Keltner Channel %K (indicator was published in my scripts)
2. OBV's %B (indicator was published in my scripts)
B. Rule of Signal
1. Rule 1: No Signal
- %K is the highest of 3 periods => Possible a Pivot High
- %K is the lowest of 3 periods => Possible a Pivot Low
- Previous %K is greater than or equal 0.8 => Touch Resistance Zone
- Previous %K is less than or equal 0.2 => Touch Support zone
2. Rule 2: Sell and Buy Zone depend on 2 Indicators mentioned in A
- Sell zone = %K<0.45 and Obv's %B <0.45
- Buy zone = %K>0.55 and Obv's %B >0.55
3. Rule 3: Put and Call Signal
- Put Signal = Sell zone and not No Signal
- Call Signal = Buy zone and not No Signal
C. Alert
1. Signal alert = Put Signal or Call Signal alert
2. Put alert = Put Signal alert
3. call alert = Call Signal alert
Moving Averages CrossThis Indicator helps you spot crosses between moving averages.
Thought to combine short term and long term strategies.
A complementary element for your trading tool belt.
The First study (short term):
Helps you visualise the relation between two simple moving averages (9,21) by default.
The Second study (long term):
Helps you identify the relation between three simple moving averages (50,100, 200) by default.
Spot Golden Crosses and Death Crosses from far.

Gucci Sniper Trading BotA simple Buy/Sell signal algo designed for a trading bot.
Uses ATR and EMA cross to get signals.
Seems to be doing best on 4H charts.
Have not done any backtesting on it yet.

Quadratic SemaphoreThe quadratic semaphore indicator is an indicator that find confirmed market u-turn with the help of 2 quadratic regression calculated with Highs and Lows over the last “length” periods.
- “p” setting is candlesticks quantity to confirmed the quadratic regression has formed a High or Low parabola, such as Fractals. Consecutive same signals can happen due to the use of different price values for upper and lower semaphore.
- Adjust the settings to your instrument and time frame.
- Alerts included.
Success with your trade¡¡
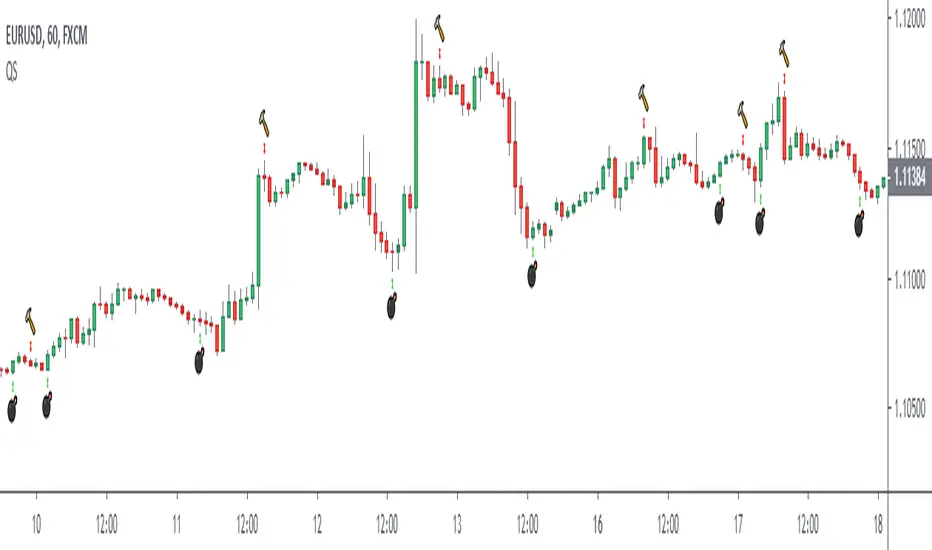
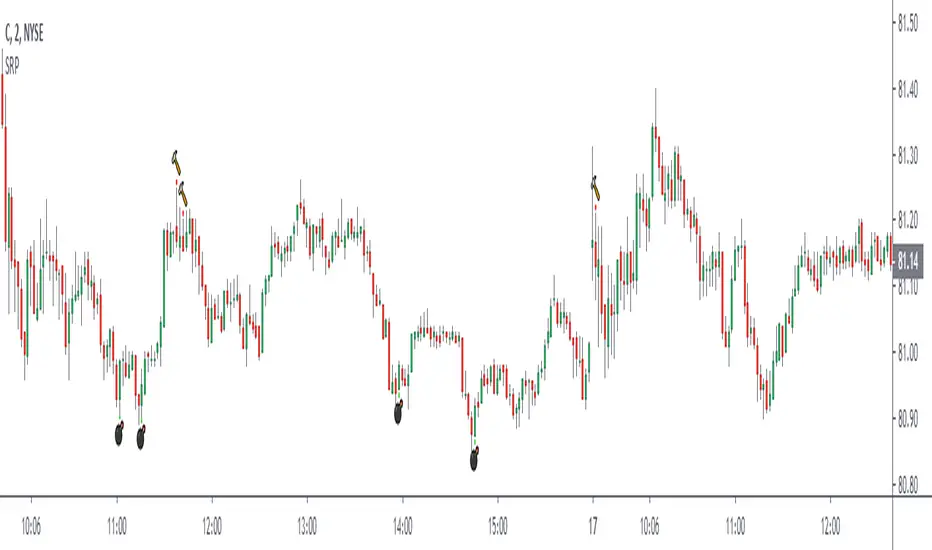
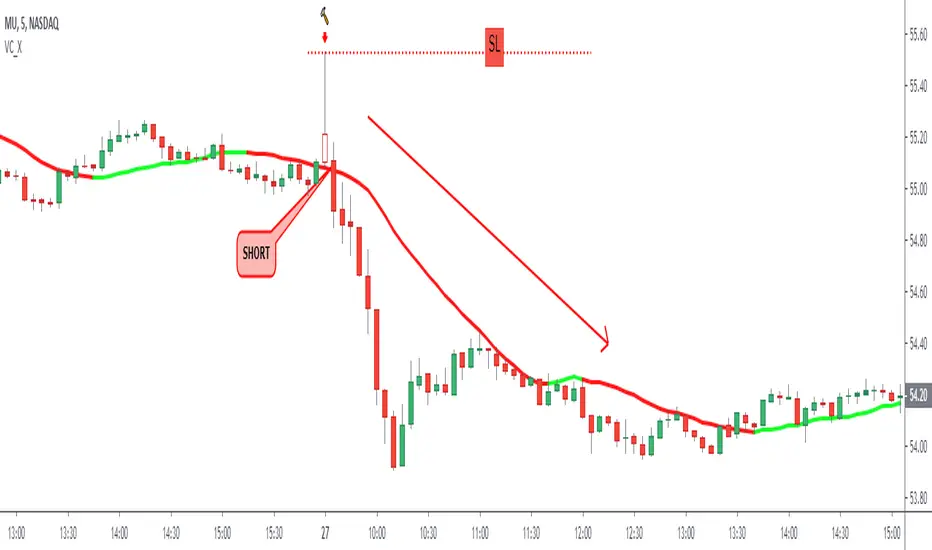
Long Tail Candle by Oliver VelezThis script detects an event created by Oliver Velez, it is a wide-range candle with a small body and a long tail (hammer-type candle), its range is noticeably larger than previous candles, as a rule it can be taken that the body should be maximum of 30% of the total range of the candle with a long tail. The stop goes under the tail and the signal is given when the next candle followed by the long tail candle exceeds its body, do not program this condition so that the alert indicates that a long tail candle was generated and the trader has some Time to visualize the graph and wait for the signal.
The default configuration is very basic, each trader must adjust to their needs.
- Trend filters can be activated.
- Alerts available.
Thumbs up
TMMS OscillatorThe TMMS oscillator (aka “Trading Made More Simpler”) is an indicator made of conditions based on both 2 separated Stochastic and 1 RSI.
Bullish zone is green and bearish one is red. When the histogram is grey, no signals is available at that time.
The indicator has an option to show the current trend of an Hull moving average (ascending or descending curve). When the trend is up, green dots are plotted on the zero line. When the trend is down, the dots are coloured in red.
Greetings, success with your trade!!!

High – Low Trend Indicator Signal (Expo)High - Low Trend Indicator Signal - (Expo)
DESCRIPTION
This indicator is derived from my previous one called High – Low Trend Indicator (Expo) , but the difference is that this one generates Long signals and detects market changes. These two indicators are intended to be used in the same chart for better accuracy and validation of signals. The indicator is perfectly used to identify pullbacks in positive trends!
HOW TO USE
When a signal appears, consider enter long, or look for confirmation patterns. Such confirmation could be seen in the High – Low Trend Indicator (Expo) when the red cloud disappears or when the black price line crosses out from the red cloud, or when the black price line crosses up over the blue midline.
So,
1. Use the indicator to identify Long signals.
2. Use the indicator to find Entry points in positive trends.
3. Use the indicator to detect market changes.
4. Combine it with High – Low Trend Indicator (Expo).
INDICATOR IN ACTION
The indicator is best presented live, the graphs below are a good guide.
EURUSD
DAX
WALL STREET
GOLD
I hope you find this indicator useful , and please comment or contact me if you like the script or have any questions/suggestions for future improvements. Thanks!
I will continue to work on this indicator, so please share your experience and feedback with me so that I can continuously improve it. Thanks to everyone that have contacted me regarding my scripts. Your feedback is valuable for future developments!
ACCESS THE INDICATOR
• Contact me on TradingView or use the links below
-----------------
Disclaimer
Copyright by Zeiierman.
The information contained in my scripts/indicators/ideas does not constitute financial advice or a solicitation to buy or sell any securities of any type. I will not accept liability for any loss or damage, including without limitation any loss of profit, which may arise directly or indirectly from use of or reliance on such information.
All investments involve risk, and the past performance of a security, industry, sector, market, financial product, trading strategy, or individual’s trading does not guarantee future results or returns. Investors are fully responsible for any investment decisions they make. Such decisions should be based solely on an evaluation of their financial circumstances, investment objectives, risk tolerance, and liquidity needs.
My scripts/indicators/ideas are only for educational purposes!
High - Low Trend Indicator - (Expo)High - Low Trend Indicator - (Expo)
DESCRIPTION
This trend indicator is derived from the highest (High) and lowest (Low). The unique formula enables clarity in trends and fast response to market changes.
Negative trend
The market could be considered to be in a negative trend when the black price line is under the blue Midline and a major red cloud is created. For some markets, the orange- trendline can be switched on to identify the long-term trend in the market. So, if the price line is under the orange trendline the market is in a negative trend.
Positive trend
The market could be considered to be in a positive trend when the black price line is above the blue Midline and close to the upper-line. For some markets, the orange-trendline can be switched on to identify the long-term trend in the market. So, if the price line is above the orange trendline the market is in a positive trend.
The indicator should be used in combination with High – Low Trend Indicator Signal (Expo) to identify market changes.
HOW TO USE
1. Use the indicator to identify trends.
2. Use the indicator to find Entry points in trends.
3. Combine it with High – Low Trend Indicator Signal (Expo).
INDICATOR IN ACTION
The indicator is best presented live, the graphs below are a good guide.
EURUSD
DAX
WALL STREET
EURJPY
GOLD
I hope you find this indicator useful , and please comment or contact me if you like the script or have any questions/suggestions for future improvements. Thanks!
I will continue to work on this indicator, so please share your experience and feedback with me so that I can continuously improve it. Thanks to everyone that have contacted me regarding my scripts. Your feedback is valuable for future developments!
ACCESS THE INDICATOR
• Contact me on TradingView or use the links below
-----------------
Disclaimer
Copyright by Zeiierman.
The information contained in my scripts/indicators/ideas does not constitute financial advice or a solicitation to buy or sell any securities of any type. I will not accept liability for any loss or damage, including without limitation any loss of profit, which may arise directly or indirectly from use of or reliance on such information.
All investments involve risk, and the past performance of a security, industry, sector, market, financial product, trading strategy, or individual’s trading does not guarantee future results or returns. Investors are fully responsible for any investment decisions they make. Such decisions should be based solely on an evaluation of their financial circumstances, investment objectives, risk tolerance, and liquidity needs.
My scripts/indicators/ideas are only for educational purposes!

Rúnar V2 - Trend Strength, Confirmation and ExhaustionHi guys,
So after a lot of feedback on the initial Runar script, I have finally completed V2 as per your feedback. The original script had some issues with repainting as this is a multi-time frame script and the periods we included on the original were far too large. This actually addresses the other issue of the script originally being quite slow or very specific around which dots/signals it would print. The new script is therefor a lot more reactive and responsive to market behavior especially crypto.
I have re-introduced the Certainty score as a result for you to modify and play with. Right now its set to its highest variable, but you can choose lower. I recommend no lower than 2 as dots prints will become meaningless to me but may be helpful to others.
How to use the indicator:
Something I get asked a lot, so lets break it down in full. The indicator comes with two primary areas and two secondary. The first two primary is the actual waves we see in the center oscillating around 0. These waves measure market direction and strength and will print a dot (its secondary) to signify a larger move. This makes some qualities of Runar predictive, but remember sudden moves will not be picked up on higher time frames.
The color of the wave will signify the color of the dot. We will not currently get a green dot printing during a red wave. This is intentional to avoid flip flopping too much during market movement and allows us to confidently follow trend instead.
The second part of the indicator consists of the top 3 lines osculating between 0 and 100. This part of the indicator measures the markets expansion and volatility allowing us to spot early exhaustion during trend. The indicator consists of three lines and when all 3 read over 95 we can begin looking for a bottom or reversal. Its secondary area are the solid lines (green/red) at the bottom of the indicator to make spotting these potential areas easier and to keep an eye on the market/orderbook/other indicators to spot the exhaustion.
A green line will print during downtrends and a red line during up trends as this is intended to align with the traditional buy/sell colours.
Finally the indicator comes with alerts for dot prints or a line print so you are free to set these up however you wish. My recommended time frames are 15m/1/2/4H with scalpers welcome to go as low as the 1min.
Epic Market Indicator 2.0 (EMI 2)After months and months of back-testing, I have finally decided to release this update. Would also like to give out a special thanks to Tradingview for making it possible to create scripts and share this with the community. I have occurred a lot of information in this community. I believe that when you take, you should also share. That’s why I am sharing this wonderful indicator for free. Remember, knowledge and experience is the most valuable things in life.
EMI, Epic Market Indicator:
60-74% theoretically profitable trades, depending on the time period. However if you use EMI blindly, the percentage might even go lower. Nevertheless, there should be enough presenting opportunities, if you use her wisely.
This indicator is a combination of different oscillators:
Common:
-MACD
-VWAP
-RSI
-Stochastic
-Volume Flow
-Buy & Sell signals
-Bottom & Top signals
-Volume Flow heat map
RSI turns green or red when entering overbought or oversold territories.
Dots on wave crossings are buy or sell signals.
Diamonds above are possible bottoms and tops.
Green = Bull signals
Red = Sell signals
These signals are buy & sell conditions based on different oscillators, known by many traders.
ALWAYS wait for the candle to close and another confirmation before taking any consideration nor actions. No signals means trend continuation.
Using EMI 2 in combination with EMI 1, traditional authentic pattern formations and darkened theme is recommended. Good luck fellow traders and don't forget to tap the like button. Thanks in advance.
Epic Market Indicator 3.0 (EMI 1)After months and months of back-testing, I have finally decided to release this update. I would also like to give out a special thanks to Tradingview for making it possible to create indicators and share this with the community. I have occurred a lot of information in this community. I believe that when you take, you should also share. That’s why I am sharing this wonderful indicator for free. Remember, knowledge and experience is the most valuable things in life.
EMI, Epic Market Indicator:
60-74% theoretically profitable trades, depending on the time period. However if you use EMI blindly, the percentage might even go lower. Nevertheless, there should be enough presenting opportunities, if you use her wisely.
Like in the movie Inception, the deeper and longer you thread into dream within a dream etc., the more dangerous or riskier it becomes. It is recommended to use EMI on 15 min. charts and above. I do not recommend using EMI on altcoin markets.
Tip: People = Psychology > Patterns > Indicators. They are all important nonetheless and explicitly keep this order in the back of your mind when using EMI.
EMI 1 is actually a combination of diverse indicators such as EMA, SMA, Pivots etc. I have turned of certain indicators by default, those I do not need to see most of the time:
- Tesla EMA Ribbon: Periods based upon Nikola Tesla's favorite numbers, 3, 6, 9. (Enabled by default)
- Fibonacci EMA Ribbon: Periods based upon Fibonacci frequency; 13, 21, 55, 89. (Enabled by default)
- Pivots (Disabled by default).
-Bollinger bands (Disabled by default).
- SMA 100 & 200 (Disabled by default).
- Bar trend color: red = bearish & green = bullish (Disabled by default).
-Buy & Sell signals, which makes EMI a unique indicator: Based upon diverse indicators & oscillators. Not predictions, but high probabilities. (Enabled by default, obviously ^^ )
Red symbols are sell or short signals / Green symbols are buy or long signals.
Dots represents possible price action trend reversals and the diamond symbols could be a possible confirmation and the big X is even a stronger confirmation signal. (A top or bottom, not THE bottom or top). These signals are based upon certain buy & sell conditions by a diversity of indicators known by most traders. Think for example, crossing EMA’s, Stochastic RSI, MACD, oversold and overbought territories.
ALWAYS wait for the candle to close and another confirmations before taking any consideration nor actions. No signals means trend continuation.
Using EMI1 in combination with EMI 2, traditional authentic patterns and darkened theme is recommended. Good luck fellow traders and don't forget to smash that like button! Thanks in advance.

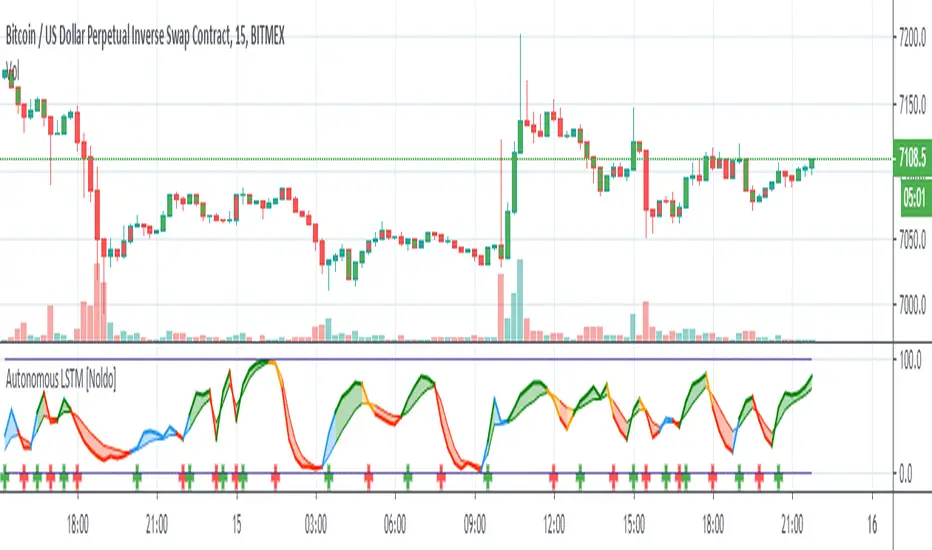
Autonomous LSTM [Noldo] Structure
Feature Layer 1 : Formulation :
The Autonomous LSTM adaptive period equation is a multivariate equation created by averaging a table based on market weights and optimizing it for each time period, by specially Artificial Neural Networks (ANN) training and taking note of the instruments chosen from Foreign exchange instruments, Stock markets , Futures and Commodities , Interest Rates and Yields all over the Global Markets.
Market weights and liquidities were taken into consideration and included in the calculations.
Feature Layer 2: Forecast Algorithm :
When we apply only the first item, we only get the buy and sell signals in reverse.
In other words, since we measure the expectation, the positive signal informs the bear market and the negative scenario informs the bull market.
If we only act according to the expectations market, our system will be very sensitive.
When we associate this with real prices, both our accuracy increases and the reverse market returns to the normal market.
In other words, as in the indicators with standard average, the upward crosses are buy and the downward crosses are sell signal.
Examples:
a -) The normal deep learning script (ANN), which is only created according to expectations:
Unlike standard market, it gives reverse signals.
Original script :
b-) Script with Forecast Algorithm but it only uses valid and standard periods for certain instruments :
Original script :
Feature Layer 3 : Composite of Two Layers : Adaptive Period (Length) Algorithm
This layer is the most important layer.
Outputs the period.
It adjusts itself to market conditions and provides a more agile trading environment under all circumstances.
Display of smart period function and standard period :
Where the market is stagnant, the period increases automatically and reduces unnecessary trade, while in trendy markets the period decreases automatically and allows to see positions first.
The degree of stagnation of the instrument concerned is not calculated solely by volatility.
We may perceive this in relation to several factors, but yes volatility is one of these factors.
When we put the script system under the MACD (Moving Average Convergence Divergence) roof, I did the tests.
Where both averages were positive, they could report accurate harsh trend news, or vice versa.
But I decided to give it up and put it on the Stochastic Money Flow Index .
First of all , Stochastic Money Flow Index function takes the volume into account.
The reason for this is a very important factor, which is naturally contained in the structure of High - Low conditions related codes.
And by using this factor, it could be superfast adaptive in both stagnant and trendy markets.
Feature Layer 4 : High - Low Selection Algorithm
The High-Low Selection Algorithm does not depend on a specific period but scans all periods backwards.(Lookback Function - Lkb )
Outputs the lowest or highest values in the specified new period.
This algorithm was written by me with the concern that if everyone trades according to the same threshold values, it will cause problems and choosing between values of the whole period length will slow down the signals.
This algorithm consists of two functions.
a - Lkb (Lookback Function) :
The lookback function scans back all periods from 0 to Smart Period bars at the same time.
In order to show the effect of the function, it was done between 0 and 84 bars.
However, the scan period of the function is normally at the same time: 0 to adaptive period time.
If the adaptive period includes a fractional day, it can also scan it.
There is no need to be an integer.
All functions are written to make mutable variables appropriate.
And what this function will scan depends on the second feature.
The special selection algorithm is in this function.And the output is given in this function.
b-) High - Low Selection Algorithm
Outputs the lowest or highest values in the specified new period.
This function allows you to select the most advantageous low or high values, even though the adaptive period remains the same.
And the signals are even more accurate.
This is a comparison of the High-Low selection algorithm and the Function: Stochastic Money Flow Index in the standard period.
For the codes of the Stochastic Money Flow Index function:
Speed may not be clear here.
So let's take a look at on chart.
So I would like to show a comparison values of the standard and special selection algorithms on Standard Highest - Lowest Function (All effort goes to RicardoSantos)
Note: This function is the standard function and freed from integer loads.
Blue = Function Highest - Lowest (length = 10 )
Yellow = Smart High-Low Selection Algorithm (length = 10 )
You can better observe the different results in the same period on the chart.
***
4 layers are interdependent.
And when the inter-layer operations are completed, output is given.
*** - Usage of Autonomous LSTM
Plot Rules
Blue Zones = Crossover condition where the average of long and short lines is less than 50.
Orange Zones = Crossunder condition where long and short lines averages more than 50.
Green Zones = Crossover condition where the average of long and short lines is greater than 50.
Red Zones = Crossunder condition where long and short lines averages less than 50.
*** Autonomous LSTM Settings :
It is just the barcolor to be colored according to the crossover and crossunder conditions or not (I / 0) option.
*** Autonomous LSTM Alerts :
As an alert, it only reports crossover and crossunder status as "Long Signal" and "Short Signal" as a warning after the first bar closure.
*** CONCLUSION :
Autonomous LSTM Designed to be used in any time frame.
Does not repaint in any time frame.
Script is independent of constant coefficients.No period adjustment is necessary.
Each layer transfers the information in its own layer to the next layer and the results are reflected in the Stochastic Money Flow Index function built on the resultant.
Regards.
Macroeconomic Artificial Neural Networks
This script was created by training 20 selected macroeconomic data to construct artificial neural networks on the S&P 500 index.
No technical analysis data were used.
The average error rate is 0.01.
In this respect, there is a strong relationship between the index and macroeconomic data.
Although it affects the whole world,I personally recommend using it under the following conditions: S&P 500 and related ETFs in 1W time-frame (TF = 1W SPX500USD, SP1!, SPY, SPX etc. )
Macroeconomic Parameters
Effective Federal Funds Rate (FEDFUNDS)
Initial Claims (ICSA)
Civilian Unemployment Rate (UNRATE)
10 Year Treasury Constant Maturity Rate (DGS10)
Gross Domestic Product , 1 Decimal (GDP)
Trade Weighted US Dollar Index : Major Currencies (DTWEXM)
Consumer Price Index For All Urban Consumers (CPIAUCSL)
M1 Money Stock (M1)
M2 Money Stock (M2)
2 - Year Treasury Constant Maturity Rate (DGS2)
30 Year Treasury Constant Maturity Rate (DGS30)
Industrial Production Index (INDPRO)
5-Year Treasury Constant Maturity Rate (FRED : DGS5)
Light Weight Vehicle Sales: Autos and Light Trucks (ALTSALES)
Civilian Employment Population Ratio (EMRATIO)
Capacity Utilization (TOTAL INDUSTRY) (TCU)
Average (Mean) Duration Of Unemployment (UEMPMEAN)
Manufacturing Employment Index (MAN_EMPL)
Manufacturers' New Orders (NEWORDER)
ISM Manufacturing Index (MAN : PMI)
Artificial Neural Network (ANN) Training Details :
Learning cycles: 16231
AutoSave cycles: 100
Grid
Input columns: 19
Output columns: 1
Excluded columns: 0
Training example rows: 998
Validating example rows: 0
Querying example rows: 0
Excluded example rows: 0
Duplicated example rows: 0
Network
Input nodes connected: 19
Hidden layer 1 nodes: 2
Hidden layer 2 nodes: 0
Hidden layer 3 nodes: 0
Output nodes: 1
Controls
Learning rate: 0.1000
Momentum: 0.8000 (Optimized)
Target error: 0.0100
Training error: 0.010000
NOTE : Alerts added . The red histogram represents the bear market and the green histogram represents the bull market.
Bars subject to region changes are shown as background colors. (Teal = Bull , Maroon = Bear Market )
I hope it will be useful in your studies and analysis, regards.

Bull Bear Power TrendDo you find it difficult to analyze trends?
This indicator will help you to have an objective analysis of the trend.
Let's start .....
In this indicator Bears and Bulls go their separate ways.
-The Bull line (bullish green) always goes above zero.
-The Bear line (bearish red) always goes below zero.
With a quick glance, you will know who is winning.
There are two zones of tendency force:
- Above 2 for bulls: when the Bull line crosses its + 2 level upwards, an uptrend begins to have strength.
- Below 2 for bears: when the Bear line crosses its -2 level down, a downward trend begins to gain strength.
Trend Confirmation:
- When a histrogram bar appears the trend is confirmed.
When a positive histogram appears, it indicates that the Bull line is above its + level and the Bear line is above its level -.
When it is a negative histogram that appears, it indicates that the Bear line is below its level - and the Bull line is below its + level.
The TREND line (in black) is the difference between the Bull line and the Bear line.
Its crosses above / below zero serve us to track the trend, as well as turning points where we could put a stop loss .
This indicator generates multiple signals as position management, I leave it to fall in love with it and find all that.
Thanks to Jose Callao for this great idea.
Thumbs up

Red and Green Ignored Bar by Oliver VelezOn this occasion I present a script that detects Ignored Red Candles and Ignored Green Candles, basically it is a Price Action event that indicates a possible continuation of the current trend and gives the opportunity to climb it with a Very tight risk, before delving into detail I would like to leave this note:
Note: the detection of this event does not guarantee that the signal will be good, the trader must have the ability to determine its quality based on aspects such as trend, maturity, support / resistance levels, expansion / contraction of the market, risk / benefit, etc, if you do not have knowledge about this you should not use this indicator since using it without a robust trading plan and experience could cause you to partially or totally lose your money, if this is your case you should train before If you try to extract money from the market, this script was created to be another tool in your trading plan in order to configure the rules at your discretion, execute them consistently and have AUTOMATIC ALERTS when the event occurs, which is where I find more value because you can have many instruments waiting for the event to be generated, in the time frame you want and without having to observe the mer When the alert is generated, the Trader should evaluate the quality of the alert and define whether or not to execute it (higher timeframes, they can give you more time to execute the operation correctly).
Let's continue….
This event was created by Oliver Velez recognized trader / mentor of price action, the event has a very interesting particularity since it allows to take a position with a very limited risk in trend movements, this achieves favorable operations of good ratio and small losses when taking An adjusted risk, if the trade works, a good ratio is quickly achieved and we agree with a key point in the “Keep small losses and big profits” trading, this makes it easier to have a positive mathematical hope when your level of Success is not very high, so leave you in the field of profitability.
THE EVENT:
The event has a bullish configuration (Ignored Red Candle) and a bearish configuration (Ignored Green Candle), below I detail the “Hard” rules (later I explain why “Hard”):
1- Last 3 bars have to be GREEN-RED-GREEN (possible bullish configuration) or RED-GREEN-RED (possible bearish configuration), the first bar is called Control Bar, the second is called Ignored Bar and the third Signal Bar as shown in the following image:
2- Be in a trend determined by simple moving averages (Slow of 20 periods and Fast of 8 periods), as a general rule you can take the direction of MA20 but the Trader has to determine if there is a trend movement or not.
3- Control bar of good range, little tail and with a body greater than 55%.
4- Ignored bar preferably narrow range, little tail and that is located in the upper 1/3 of the control bar.
5- Signal bar cannot override the minimum of the ignored bar.
6- Activation / Confirmation of event by means of signal bar in overcoming the body of the ignored bar.
Some examples of ignored bars (with “Hard” and “Flexible” rules):
Features and configuration of the indicator:
To access the indicator settings, press the wheel next to the indicator name VVI_VRI "Configuration options".
- Operation mode (Filtering Type):
• Filtering Complete: all filters activated according to the configuration below.
• Without Filtering: all filters deactivated, all VRI / VVI are displayed without any selection criteria.
• Trend Filter only: shows only VRI / VVI that are in accordance with what is set in “Trend Settings”
- Configuration Moving Averages:
• See Slow Media: slow moving average display with direction detection and color change.
• See Fast Media: display of fast moving average with direction detection and color change.
• Type: possibility to choose the type of media: DEMA, EMA, HullMA, SMA, SSMA, SSMA, TEMA, TMA, VWMA, WMA, ZEMA)
• Period: number of previous bars.
• Source: possibility to choose the type of source, open, close, high, low, hl2 hlc3, ohlc4.
• Reaction: this configuration affects the color change before a change of direction, 1 being an immediate reaction and higher values, a more delayed reaction obtaining les false "changes of direction", a value of 3 filters the direction quite well.
- Trend Configuration
• Uptrend Condition P / VRI: possibility to select any of these conditions:
o Bullish MA direction
o Quick bullish MA direction
o Slow and fast bullish MA direction
o Price higher than slow MA
o Price higher than fast MA
o Price higher than slow and fast MA
o Price higher than slow MA and bullish direction
o Price higher than fast MA and bullish direction
o Price higher than slow, fast MA and bullish direction
o No condition
• Condition P / VVI bear trend: possibility of selecting any of these conditions:
o Slow bearish MA direction
o Fast bearish MA direction
o Slow and fast bearish MA direction
o Price less than slow MA
o Price less than fast MA
o Price less than slow and fast MA
o Price lower than slow MA and bearish direction
o Price less than fast MA and bearish direction
o Price less than slow, fast MA and bearish direction
o No condition
- Control bar configuration
• Minimum body percentage%: possibility to select what body percentage the bar must have.
• Paint control bar: when selected, paint the control bar.
• See control bar label: when selected, a label with the legend BC is plotted.
- Configuration bar ignored
• Above X% of the control bar: possibility to select above what percentage of the control bar the ignored bar must be located.
• Paint ignored bar: when selected, paint the ignored bar.
- Signal bar configuration
• You cannot override the minimum of the ignored bar: when selected, the condition is added that the signal bar cannot override the minimum of the ignored bar.
• Paint signal bar: when selected, paint the signal bar.
• See arrow: when selected it shows the direction arrow of the possible movement.
• See bear and arrow: when selected it shows bear and arrow label
• See bull and arrow: when selected it shows bull and arrow label
The following image shows the ignored bar and painted signal:
- Take profit / loss
The profit / loss taking varies depending on the trader and its risk / monetary plan, the proposal is a recommendation based on the nature of the event that is to have a small risk unit (stop below the minimum of the ignored bar), look for objectives in ratios greater than 2: 1 and eliminate the risk in 1: 1 by taking the stop to BE, all parameters are configurable and are the following:
• See recommended stop loss and take profit: trace the levels of Stop, BE, TP1 and TP2, as well as their prices to know them quickly based on the assumed risk
• To: select which event you want to draw the SL and TP (VRI, VVI)
• Extend stop loss line x bars: allows extending the stop line by x number of bars
• Extend take profit line x bars: allows extending the stop line by x number of bars
• Ratio to move to break even: allows you to select the minimum ratio to move stop to break even (default 1: 1)
• Take profit 1 ratio: allows you to select the ratio for take profit 1 (default 2: 1)
• Take profit 2 ratio: allows you to select the ratio for take profit 2 (default 4: 1)
- Alerts
• It is possible to configure the following alerts:
-VRI DETECTED
-VVI DETECTED
-VRI / VVI DETECTED
Final Notes:
- The term hard rules refers to the fact that an event is sought with the rules detailed above to obtain a high quality event but this brings 2 situations to consider, less
number of events and events that are generated in a strong impulse may be leaked, a very large control bar followed by an ignored narrow body away from moving averages, despite having a good chance of continuing, taking a stop very tight in a strong impulse you can touch it by the simple fact of the own volatility at that time.
- The setting of the parameters “Minimum body percentage% (control bar)”, “Above x% of the control bar (bar ignored)” and “Cannot override the minimum of the ignored bar” can bring large Benefits in terms of number of events and that can also be of high quality, feel free to find the best configuration for your instrument to operate.
- It is recommended to look for trending events, near moving averages and at an early stage of it.
- The display of several nearby VRIs or VVIs in an advanced trend may indicate a depletion of it.
- The alerts can be worked in 2 ways: at the closing of the candle (confirms event but the risk unit may be larger or smaller) or immediately the body of the ignored bar is exceeded, in case you are operating from the mobile and miss many events because of the short time I recommend that you operate in a superior time frame to have more time.
- The indicator is configured with “flexible” rules to have more events, but without any important criteria, each trader has to look for the best configuration that suits his instrument.
- It is recommended to partially close the operation based on the ratio and always keep a part of the position to apply manual trailing stop and try to maximize profits.
The code is open feel free to use and modify it, a mention in credits is appreciated.
If you liked this SCRIPT THUMB UP!
Greetings to all, I wish you much green!

MACD Pro Suite (Zeiierman)█ Overview
MACD Pro Suite (Zeiierman) redefines the classical MACD by transforming it into an adaptive market-behavior engine, instead of relying on a static fast–slow EMA configuration, the suite channels price through an efficiency matrix, a momentum acceleration core, and a multi-regime normalization layer. The result is a MACD architecture capable of shifting seamlessly between a volatility-conditioned oscillator, a probabilistic compression model, or a smooth, distribution-aware trend profiler, all emerging from the same underlying structure.
The MACD Pro Suite extends far beyond traditional MACD behavior by interpreting market structure in real time and adapting its responses to shifting conditions. It can detect subtle momentum transitions, quantify trend stability, reveal hidden inefficiencies in price movement, and highlight early regime shifts that standard oscillators completely overlook. Its dynamic normalization engine ensures consistency across different market environments, allowing the signal to remain clear during high volatility, low volatility, compression phases, expansions, and trend accelerations.
The system is designed to identify high-quality momentum turns, confirm trend continuity, and expose weakening market pressure before it becomes visible in price. It also reveals imbalances, impulses, and structural breaks with a level of precision that makes it valuable for discretionary traders seeking refined context and for systematic traders building rule-based models.
A built-in dashboard consolidates these behavioral states into an intuitive visual panel, making it easy to read market conditions at a glance and convert complex internal analysis into actionable insight.
⚪ Why This One Is Unique
MACD Pro Suite runs on a Hybrid Efficiency–Momentum engine that reshapes how the MACD responds to trend quality, noise, and impulse strength. This engine can operate in three distinct modes, letting the indicator shift between efficiency-driven behavior, momentum-driven behavior, or a balanced hybrid.
A multi-regime normalization system transforms the MACD into a stable, adaptive signal. It can operate as a volatility-balanced measure, a probability-styled compression model, a distribution-aware signal, or an ultra-smooth structural trend reader, all from the same core data. A real-time acceleration mechanism continuously adjusts the internal smoothing weights based on momentum intensity, giving the engine dynamic responsiveness as market conditions evolve.
Additional layers enhance this behavioral core:
Divergence mapping
Price inefficiency detection
Impulse markers
Adaptive exit structures
Significant move gradient zones
A multi-timeframe dashboard for immediate state awareness
█ Main Features
⚪ Efficiency Sources
Each efficiency source delivers a different style of structural interpretation, letting the MACD engine emphasize trend, pressure, or cyclical rotation depending on the chosen configuration and market environment.
Hybrid Efficiency–Momentum Core
In this mode, the MACD engine blends an efficiency-weighted price stream with momentum-based acceleration. The indicator adapts simultaneously to trend cleanliness, directional strength, and impulse intensity, giving it a balanced and highly reactive behavior profile.
Enhanced Momentum Core
Here, the engine uses raw price as the base input but applies a dynamic acceleration mechanism that adjusts internal EMA responsiveness in real time. The MACD becomes more reactive during strong momentum phases and more controlled during choppy, low-quality movement.
Efficiency Core
This framework routes the input through an efficiency pipeline where price, directional strength, or cyclic momentum is transformed into a cumulative efficiency path before MACD is calculated. It emphasizes structural clarity by suppressing noise and amplifying meaningful movement within the market.
⚪ MACD Shaping & Normalization Framework
Volatility Balanced Modes
These modes transform the MACD into a volatility-adjusted signal that automatically adapts to changing market conditions. The result is a cleaner and more stable read that adjusts naturally to expanding and contracting volatility while still preserving clear directional intent.
Tight Compression Modes
These shaping options re-scale MACD into compact 0 to 1 style ranges that are re-centered into a clean negative one to positive one structure. They produce a tightly controlled oscillator that highlights relative movement rather than raw amplitude.
Position Centered Modes
Here, the MACD is normalized using distribution-based scaling, allowing it to understand where it sits within its own movement range. This makes shifts in pressure and momentum easier to read and highlights when the indicator is moving into unusually strong or weak conditions.
Distribution Aware
These modes apply distribution-based transforms and robust statistical scaling. They stabilize MACD during irregular or skewed market conditions while preserving high-quality turning points
Volatility Filtered and Ultra Smooth Modes
These variants use multi-component volatility estimates and smoothed normalization to produce an exceptionally smooth MACD line. They maintain structure and trend behavior while filtering out low-value noise.
Robust Volatility Filtered
Ultra-Smooth Volatility Filter
⚪ Significant MACD Move
The Significant MACD module identifies when the MACD line enters a meaningful high-importance zone by evaluating its recent amplitude and confirming that momentum has held inside a defined activity region. Once active, a thicker overlay highlights periods where MACD is operating within this significant regime, while neutral phases use a base color for clear visual separation.
These highlights show when MACD is pressing into one of its internal pressure zones, helping you distinguish between ordinary momentum rotation and moments when the underlying push becomes strong enough to deserve attention. It is especially useful for spotting expansion phases, confirming breakouts, or identifying trend legs with real follow-through potential.
⚪ Signals
The suite includes directional signals that track meaningful shifts in market pressure and help highlight emerging turns or continuation strength, offering clear guidance when the market begins to turn or strengthen.
⚪ Divergences
When enabled, the suite automatically scans for regular bullish and bearish divergence between MACD and price. It identifies and marks structural pivot points where momentum and price begin to disagree. Because the MACD engine is built on efficiency and momentum rather than raw price alone, it can surface uncommon or non-traditional divergence structures that do not appear on standard indicators, often with noticeably higher accuracy.
Regular Bullish Divergence
MACD forms a higher low while price sets a lower low, signaling potential upward rotation.
Regular Bearish Divergence
MACD forms a lower high while price sets a higher high, indicating possible weakening momentum.
⚪ Price Inefficiency
The Price Inefficiency engine evaluates how balanced or imbalanced market movement is by analyzing a composite stream built from price, normalized MACD, normalized Signal, and smoothed structure. It measures how efficiently the market is progressing and identifies when movement becomes unstable, irregular, or out of sync with its underlying trend profile.
Blue diamonds plotted along the MACD zero line highlight periods where inefficiency is detected. This layer exposes subtle structural imbalances that often precede volatility bursts, failed moves, or regime transitions, giving traders early insight into when the market is behaving cleanly and when it is slipping into disorder.
⚪ Impulse Markers
The Impulse module identifies statistically extreme expansions in a smoothed, price-derived momentum stream. It highlights moments when momentum surges beyond normal behavior, marking them as either positive or negative impulses.
⚪ Visual Multi-Timeframe Dashboard
Along the right edge of the pane, a compact dashboard summarizes the MACD environment across 5M, 15M, 1H, 2H, 4H, and 1D. Each column reflects a key behavioral element derived from the MACD Pro Suite:
MACD Value – raw MACD pressure showing strength, weakness, or extreme displacement
MACD Signals – directional bias such as Long, Short, or neutral transitions
Histogram Signals – bull/bear momentum pulses extracted from the histogram structure
Divergence – bullish or bearish conflicts between MACD behavior and price movement
Inefficiency – imbalance zones where price behaves unstably or inefficiently
Impulse Moves – active bullish or bearish momentum bursts detected in real time
Think of it as a “MACD climate map.” Instead of flipping through multiple charts, you get an instant visual read on whether lower timeframes support the higher-timeframe environment or move against it. This makes multi-timeframe alignment straightforward and helps you decide when conditions favor aggressiveness, patience, or stepping aside entirely.
█ How to Use
The MACD Pro Suite is built to be exceptionally flexible. Because its core engine adapts to trend quality, volatility conditions, structural efficiency, and momentum strength, it can be shaped into almost any style of MACD behavior you need. From smooth trend-profiling to tight compression signals, from volatility-balanced structure to aggressive momentum tracking, the suite can be tuned to match your strategy, timeframe, and market environment.
Rather than forcing you into one interpretation of MACD, the framework gives you a set of behavioral modes that respond intelligently to changing conditions. It can act as a trend tool, a reversal detector, a structure mapper, or a regime classifier depending on how you configure it. This agility is what makes the suite useful for discretionary traders and system builders alike.
⚪ Classic MACD Trading
In its traditional form, MACD is used to track shifts in momentum and trend direction. The MACD line crossing above the Signal line often signals upward pressure, while crossing below suggests momentum is weakening or rotating downward. The histogram shows the distance between the two, making acceleration or deceleration easy to see at a glance.
These same interpretations apply directly within the MACD Pro Suite. Even with its advanced engines and normalization layers, the MACD and Signal lines still behave intuitively: crossovers mark directional shifts, zero-line transitions indicate broader trend bias, and histogram contractions or expansions reveal early momentum changes. This means you can trade it just like a classic MACD while benefiting from a far more adaptive and stable internal engine.
⚪ Fading Momentum Trading
MACD helps you spot fading momentum by watching the MACD line lose its slope and drift back toward the signal line. When the line stops accelerating and starts flattening, it’s a clear sign the trend is running out of strength. You also see fading momentum when both lines start moving back toward the midline, showing the impulse behind the trend is weakening even if the price hasn’t reversed yet.
Fading Momentum + Signals
If you spot fading momentum together with one of our Signals, it becomes a much stronger confirmation that the move is losing strength. When MACD momentum fades at the same time a Signal fires, the probability of a pullback or reversal increases significantly.
Fading Momentum + Divergences
The same applies when fading momentum aligns with divergences. If price makes a new high or low but the MACD line or histogram makes a weaker high/low, the divergence confirms that momentum is not supporting the move. Combined with fading MACD momentum, this is one of the strongest early warnings of an upcoming reversal.
⚪ Volatility and Breakout Trading
Volatility and breakout trading focus on how the market expands and contracts rather than on direction alone, and MACD Pro reacts beautifully to these shifts. When volatility increases, the MACD line tends to widen, steepen, or oscillate more aggressively. This makes it easier to see when the market is entering a high-energy phase that can lead to sharp breakouts or fast directional moves. As volatility cools, the MACD Pro begins to tighten and compress, with both the line and histogram pulling back toward equilibrium. This compression signals a contraction phase, often the calm before the next expansion.
You can spot volatility expansion when the MACD line or histogram behaves noticeably differently from recent behavior, such as sudden widening, rapid swings, or strong impulse signatures. These changes often highlight a volatility burst building beneath the surface. When that burst fades and the MACD compresses again, the market is usually preparing for a decisive move.
Settings used for Volatility and Breakout Trading:
Example Setting 1
MACD Moving average type: WMA
MACD Shaping: Raw MACD Behaviour
Momentum Multiplier: 6
Example Settings 2
MACD Shaping: Robust Volatility Filter
Momentum Multiplier: Increase toward 5
Example Setting 3
MACD Shaping: Distribution Balanced
Increase Momentum Multiplier: to exaggerate volatility bursts
Increase Efficiency Length: to filter minor fluctuations
⚪ Overbought / Oversold Trading
Overbought and oversold trading focuses on identifying when the price has stretched too far and is likely to rotate back toward balance. With the right shaping, the MACD can behave more like a bounded oscillator, making it easier to spot exhaustion on both sides of the range. When using tighter shaping or position-weighted behavior, the MACD becomes more responsive to market extremes while suppressing noise.
You can interpret overbought conditions when the MACD begins pressing into the upper region of its shaping range, showing that bullish momentum is becoming stretched. When it leans into the lower region, it signals oversold conditions and weakening bearish pressure. These zones help highlight exhaustion points, mean-reversion opportunities, and areas where a reversal or rotation is becoming increasingly likely.
Example settings:
MACD Shaping: Volatility Balanced
MACD Shaping: Tight 0–1 Band
MACD Shaping: Position Weighted
█ How It Works
⚪ Hybrid Efficiency–Momentum Engine
The core engine blends efficiency analysis with momentum dynamics, creating an adaptive MACD input stream that shifts between efficiency-centric, momentum-driven, or hybrid behavior depending on the selected mode.
Calculation: Builds the MACD input from either an efficiency-weighted cumulative path or a momentum-driven price stream, chosen by the engine mode.
⚪ Adaptive Momentum Response
A real-time responsiveness layer adjusts how quickly MACD reacts based on changes inside its structure. It becomes more responsive during fast-moving phases and naturally smooths itself during slower or noisy conditions.
Calculation: Computes a normalized responsiveness factor from structural deviation and injects it into the smoothing weights of the MACD EMAs.
⚪ Normalization & Behavior Shaping
A multi-regime shaping system re-scales and re-centers MACD using volatility filters, distribution transforms, compression modes, and ultra-smooth normalization to create consistent behavior across assets and volatility regimes.
Calculation: Applies shaping formulas to both MACD and Signal, then re-centers outputs to zero for unified interpretation.
⚪ Directional Signals
A lightweight structural reversal system highlights meaningful directional shifts, assisting with entries, exits, and bias confirmation during momentum transitions.
Calculation: Uses volatility-adjusted logic to detect directional flips and plot Up or Down markers.
⚪ Divergence Layer
The divergence engine detects structural disagreement between MACD and price, often surfacing uncommon divergence patterns thanks to the efficiency–momentum architecture.
Calculation: Identifies MACD pivots, aligns them with price pivots, and validates divergence through comparative structural thresholds.
⚪ Price Inefficiency Engine
This module evaluates imbalance in market structure by merging price behavior with internal MACD signals, highlighting unstable or disordered movement phases.
Calculation: Computes an inefficiency score from a blended composite source and maps imbalance intensity through adaptive thresholds.
⚪ Impulse Module
A momentum-intensity detector reveals statistically significant bursts in directional pressure, marking early expansion phases or exhaustion points.
Calculation: Extracts local extremes from a smoothed momentum field and confirms persistent surges through a cluster-based filter.
⚪ Significant MACD
This layer isolates high-importance momentum zones, making strong structural moves stand out clearly against routine oscillation.
Calculation: Evaluates MACD’s recent amplitude range and confirms when it enters a significant activity region, then applies enhanced visual styling.
-----------------
Disclaimer
The content provided in my scripts, indicators, ideas, algorithms, and systems is for educational and informational purposes only. It does not constitute financial advice, investment recommendations, or a solicitation to buy or sell any financial instruments. I will not accept liability for any loss or damage, including without limitation any loss of profit, which may arise directly or indirectly from the use of or reliance on such information.
All investments involve risk, and the past performance of a security, industry, sector, market, financial product, trading strategy, backtest, or individual's trading does not guarantee future results or returns. Investors are fully responsible for any investment decisions they make. Such decisions should be based solely on an evaluation of their financial circumstances, investment objectives, risk tolerance, and liquidity needs.

Stochastic Pro Suite (Zeiierman)█ Overview
Stochastic Pro Suite (Zeiierman) is a full stochastic trading framework built on top of an Efficient Price engine. Instead of feeding the oscillator with raw price data, the script first converts price into a volatility-aware, efficiency-weighted path called Efficient Price and then builds a stochastic on that foundation. Every major component, including EP Stochastic, Significant Stochastic Moves, divergence logic, inefficiency regimes, momentum impulses, and the multi-timeframe dashboard, reads from this refined stream.
The result is a stochastic that still behaves like the familiar 0–100 %K/%D oscillator, but with far more context behind every move. It doesn’t simply tell you where the price is within a recent high–low range; it tells you how reliable that move is, how clean the underlying regime is, and when the internal rotation is stretched. The tool works equally well for traders who like classic overbought/oversold swings and those who prefer higher-level context such as pressure bands, regime shifts, and impulse-driven moves.
⚪ Why This One Is Unique
Most stochastic indicators calculate %K and %D directly from the recent high–low range. Stochastic Pro Suite goes a step earlier in the chain. It first runs the chosen EP source (Close, Mean-reversion, or Trend) through a two-stage Efficient Price model that adapts to volatility, filters out random zigzags, and emphasizes directional quality. Only then is the stochastic calculation applied.
This means that when the oscillator hugs the top of its range, it’s not just reacting to any move up; it’s reacting to price movement that has already passed through an efficiency filter. Shallow, noisy moves tend to be down-weighted; clean, committed pushes stand out more. Around this EP Stochastic core, the script layers:
Significant Stochastic Moves to track internal pressure zones,
Divergence detection based on EP-Stochastic pivots,
An inefficiency layer that flags distorted regimes,
A momentum impulse engine focused on unusually strong surges, and
A dashboard that stitches everything together across multiple timeframes.
█ Main Features
⚪ EP-Based Stochastic
At the core is an EP-Stochastic built on Efficient Price instead of raw highs and lows. The oscillator keeps the classic stochastic look:
0–100 scale,
Upper and lower tension zones,
A midline representing balance,
Signal line via several moving-average types.
What changes is the input: instead of loosely tracking every tick, the EP engine compresses noisy swings and lets structured moves dominate the signal. This makes the stochastic more stable in directionally clean phases and more revealing when the market truly rotates.
You can choose between three EP behaviors to shape how the oscillator responds:
Close
The engine follows price almost one-to-one, but with the benefit of efficiency filtering. This setting is ideal if you want a familiar, general-purpose stochastic feel with fewer random spikes and more meaningful tests of the bands.
Mean-reversion
Here, the EP source emphasizes swing turns and back-and-forth rotation. The stochastic becomes a dedicated swing tool: transitions between upper and lower zones become more pronounced, and range-bound behavior is easier to read. This mode is well-suited for traders who fade extremes or trade oscillations inside a broader sideways structure.
To get better mean-reversal signals, increase the Stochastic Length to 200 and the Efficiency Length to 20.
Trend
In Trend mode, the EP source is smoothed to emphasize directional movement. When a trend is strong, the oscillator stays mostly in one half of its range and usually remains there until the trend begins to weaken. This makes it easier to see whether a pullback is just a pause in the trend or a sign that the structure is starting to roll over.
If you increase the EP Length, a more filtered trend will appear.
⚪ Significant Stochastic Moves
Instead of only watching fixed numerical levels like “80” or “20,” the suite identifies where the oscillator is trading within its own evolving range. Significant Stochastic Moves appear when the EP Stochastic pushes into internally important zones, areas where the market has historically shown heightened reaction or follow-through.
These highlights show when the stochastic is pressing into one of its key pressure zones. This helps you distinguish between normal rotation and moments where the internal push becomes strong enough to deserve attention. To identify significant moves, switch to Mean-reversion mode.
⚪ Divergence Detection
The script includes automatic detection of regular bullish and bearish divergences between the EP-Stochastic and price:
Bullish divergence: price makes a lower low while the EP-Stochastic prints a higher low.
Bearish divergence: price makes a higher high while the EP-Stochastic prints a lower high.
These are drawn directly on the oscillator pane with clear labels. Because the oscillator is driven by Efficient Price, many of the “random” divergences you see with standard stochastic are filtered out, leaving fewer but more structurally relevant signals, especially around extended trends, tight ranges, and turning points. To detect divergence, switch to Mean Reversion mode.
Since this divergence function is based on price-efficiency rather than traditional momentum swings, some divergences may appear a bit unconventional; however, the accuracy is on an entirely different level.
⚪ Momentum Impulses
Momentum impulses focus on moments when the oscillator accelerates unusually quickly relative to its own recent behavior.
Green circles near the upper region highlight powerful bullish surges.
Red circles near the lower region highlight powerful bearish surges.
The underlying logic exaggerates only the strongest deviations and ignores routine oscillation. These impulses often coincide with breakout thrusts, exhaustion spikes, sharp squeezes, or capitulation moves, places where the market briefly abandons its usual rhythm. They’re not a stand-alone trading system, but a visual cue that something unusually strong just happened in the stochastic structure.
⚪ Inefficiency Regime
The inefficiency engine monitors how orderly or distorted the combined price–stochastic behavior is. When the internal regime becomes noisy, spiky, or unbalanced, the script marks blue diamonds around the mid-region of the oscillator.
These diamonds tend to cluster when:
A previously clean trend starts to fragment,
A range becomes unstable and prone to fake breakouts,
Moves extend beyond what the recent structure would consider “normal.”
Used together with Significant Stochastic Moves, impulses, and divergence, these inefficiency markers help you distinguish between healthy follow-through and movement that is increasingly fragile.
⚪ Visual Multi-Timeframe Dashboard
On the right edge of the pane, a compact dashboard summarizes several key elements across 5M, 15M, 1H, 2H, 4H, and 1D:
Signals: immediate directional bias from the stochastic context,
OB/OS flags: stretched conditions by timeframe,
Divergence: where the structure disagrees with price,
Impulse: active momentum bursts,
Inefficiency: unstable or imbalanced regimes,
Explosive: high-energy conditions highlighted by Significant Stochastic Moves.
Think of it as a “stochastic climate map.” Instead of checking six separate charts, you get a quick snapshot of whether lower timeframes are in sync with the higher backdrop, or whether they are fighting each other. This is extremely helpful for multi-timeframe alignment and for deciding when to be aggressive versus when to stay defensive.
█ How to Use
⚪ Classic Stochastic Trading
Interpreting EP-Stochastic is similar to classic stochastic, but cleaner:
Sustained time above the midline signals a bullish rotational bias in the Efficient Price space.
Sustained time below the midline signals a bearish rotational bias.
When the oscillator repeatedly leans against the upper zone with a strong signal line, it indicates firm buyer control; when it leans against the lower zone with a soft or falling signal line, it indicates firm seller control.
When using “Close” as the EP Source, consider increasing the Efficiency Length to above 10 to produce more trend-like behavior.
⚪ Trend Trading
For trend trading, Trend mode is your core setting:
Use Trend mode with a moderate or slightly longer stochastic length.
Watch whether the oscillator lives mostly in the top or bottom half of its range.
Use the dashboard to see if higher timeframes show similar directional signals and OB/OS flags.
Impulse markers and Significant Stochastic Moves can be treated as continuation confirmations when they appear in the direction of the trend. Inefficiency diamonds and fading impulses act as early warnings that the current leg is losing coherence and may transition into consolidation or reversal. Inefficiency diamonds also signal imbalance in the market, where price can move quickly as the structure becomes unstable.
⚪ Pullback Trading
One useful workflow:
Run EP-Stochastic in Trend mode to define the dominant direction and regime.
Overlay a shorter, standard stochastic to spot pullbacks inside that regime.
When the EP-Stochastic clearly favors one side (mostly upper-half behavior in an up move, lower-half in a down move), wait for the short stochastic to cycle into its opposite extreme (oversold in an uptrend, overbought in a downtrend).
Entries during those counter-swings, especially when they coincide with impulse exhaustion in the opposite direction, often give cleaner, better-timed participation in the ongoing trend.
⚪ Overbought/Oversold Trading
Overbought zones represent strong buying pressure. When the stochastic becomes overbought, start watching for signs that buying pressure is fading.
If buying pressure continues, it typically indicates a strong bullish trend.
If the stochastic starts to decline and crosses back under the upper band, it can signal that buying pressure is weakening and a potential reversal is forming.
Oversold zones represent strong selling pressure. When the stochastic becomes oversold, start looking for signs that selling pressure is easing.
If selling pressure persists, it usually indicates a strong bearish trend.
If the stochastic begins to rise and crosses back above the lower band, it can signal that selling pressure is fading and a potential reversal is developing.
⚪ Mean-reversion Trading
Switch to Mean-reversion mode, increase the EP Source Length to 200, and reduce the Stochastic Length to 20 when you’re primarily focused on turning points and range rotation.
Look for clear spikes or peaks in the indicator, short-term bursts that quickly reverse. These moments often signal market conditions with a high likelihood of mean reversion, making a snapback in the opposite direction more likely.
⚪ Divergence Trading
When you want to focus on structural turning points rather than trend following:
Enable divergence detection.
Focus on divergences that form after extended moves or near the outer zones of the oscillator.
Bullish divergences emerging from deep lower regions can confirm early long ideas or justify scaling in as pressure transitions from aggressive selling to rotational buying. Bearish divergences out of extended upper regions can support profit-taking or exploratory short positions. The EP-Stochastic basis helps reduce “false” divergences that arise from random noise.
To get more divergence signals, consider switching to Mean-reversion mode and increasing the Efficiency Length to 20. Keep in mind that some divergences may appear “weird” or different from traditional divergence patterns—this is because they are based on Efficient Price, which uses a completely different detection engine in the background.
⚪ Breakout Trading
For breakout and breakdown scenarios, use:
Significant Stochastic Moves as evidence of a meaningful internal shift,
Impulse markers to confirm that the move is carried by strong momentum,
Inefficiency diamonds to recognize when the structure is becoming unstable.
When price breaks a level and the EP Stochastic prints a Significant Move in the direction of the break, backed by fresh impulses, it signals that the breakout is supported by internal strength.
⚪ Reversal Trading
Enable the reversal signals to identify potential turning points. Use them together with quick peaks in the stochastic oscillator. If the oscillator forms a peak and a reversal signal appears nearby, it strengthens the case for a reversal. However, if a reversal signal prints while the stochastic is simply leaning toward the upper or lower band without forming a clear peak, the signal carries less significance.
⚪ Interpreting Inefficiency Diamonds
Inefficiency diamonds highlight imbalance points in the market. When they appear, they signal that price and order flow are no longer in harmony, creating unstable conditions. These imbalance points often lead to sharp or sudden moves as the market snaps to correct the inefficiency.
Clusters of diamonds indicate a stronger imbalance and a higher likelihood of fast movement or abrupt shifts in direction.
⚪ Overview Panel
Use the multi-timeframe dashboard as a context checklist rather than a mechanical entry system. It quickly answers:
Are lower and higher timeframes pointing in the same direction?
Are multiple frames overbought or oversold at once?
Are impulses and inefficiency regimes showing up in isolation or in clusters?
█ How It Works
⚪ EP Source and Pre-EP Layer
The system begins by selecting an internal driver such as Close, Mean-reversion, or Trend. This source is evaluated through an efficiency model that measures how clean or noisy recent movement has been. Each increment is weighted by its structural quality and volatility conditions, producing a preliminary Efficient Price stream that favors meaningful directional progress over random chop.
Calculation: Applies efficiency weighting, volatility normalization, and adaptive length control. The output is a first-stage EP path that encodes directional reliability.
⚪ Main EP Engine and Adaptive Refinement
The preliminary EP stream is passed through a second refinement stage. This step smooths irregularities, boosts consistent movement, and remains sensitive to shifts in volatility regimes. The result is a fully refined Efficient Price path that forms the input for the EP-Stochastic rather than using raw highs and lows.
Calculation: Uses a second ER pass with volatility moderation and cumulative weighting. The output is the core Efficient Price trajectory used to build the EP-Stochastic.
⚪ EP-Stochastic Construction
Instead of calculating %K from raw price highs and lows, the oscillator is derived from where the refined Efficient Price sits within its own recent EP range. This keeps the stochastic familiar in shape but far more structurally coherent.
Calculation: Determines the EP range over the selected window, computes %K from EP’s position within that range, and applies optional smoothing for the signal line.
⚪ Inefficiency–Trend
This component evaluates the Efficient-Price-driven stochastic through two behavioral lenses: inefficiency and trend. Inefficiency highlights spike-driven, unstable, or imbalanced movement, while the trend component captures underlying slope, persistence, and regime strength. A smooth transition blends these two views depending on the system’s efficiency state.
Calculation: Computes an inefficiency score from ER deviation and a trend score from normalized regression slope. A smoothstep blend transitions between them, and diamond markers appear when the oscillator confirms it is operating inside an inefficiency regime.
⚪ Momentum Impulse
Momentum impulses isolate powerful rotations inside the EP-Stochastic. Only the sharpest acceleration bursts make it through, while routine oscillation is suppressed.
Calculation: Applies chained non-linear transforms to exaggerate extreme deviations, compares them to local historical envelopes, performs a cluster check to avoid false bursts, and marks impulses only when the deviation is structurally significant.
-----------------
Disclaimer
The content provided in my scripts, indicators, ideas, algorithms, and systems is for educational and informational purposes only. It does not constitute financial advice, investment recommendations, or a solicitation to buy or sell any financial instruments. I will not accept liability for any loss or damage, including without limitation any loss of profit, which may arise directly or indirectly from the use of or reliance on such information.
All investments involve risk, and the past performance of a security, industry, sector, market, financial product, trading strategy, backtest, or individual's trading does not guarantee future results or returns. Investors are fully responsible for any investment decisions they make. Such decisions should be based solely on an evaluation of their financial circumstances, investment objectives, risk tolerance, and liquidity needs.
