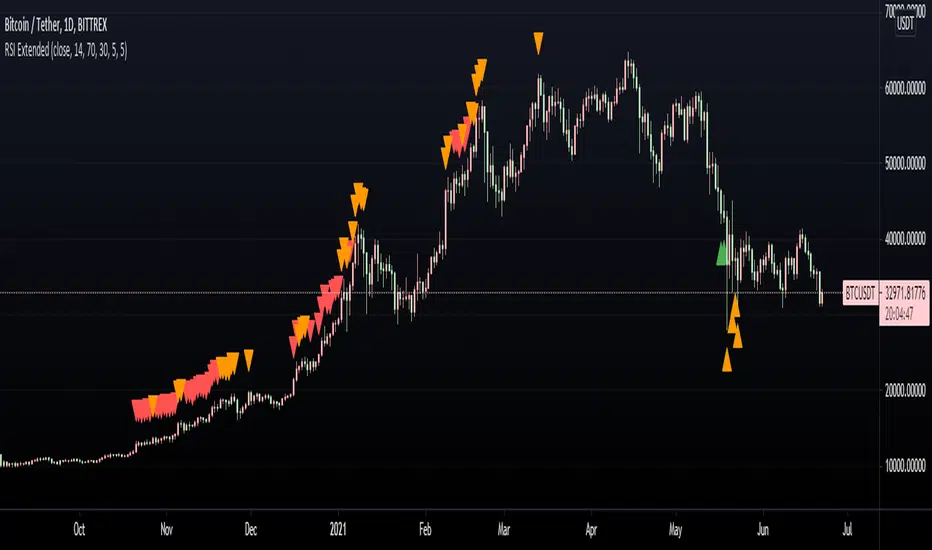
RSI ExtendedThis script is intended to print signals on the main price chart and send alerts when the RSI is overbought or oversold.
You can customize the source of the signal (open, close, etc), as well as oversold/overbought levels, and RSI length.
Signals
MechaOscillatorWhat is MechaOscillator?
MechaOscillator was created as a companion to our main script MechaAlgo. Using MechaOscillator along with MechaAlgo will allow you to boost your overall understanding of any market, and make more informed decisions as a trader.
Feature List
Built-In Improved WaveTrend Oscillator
Buy & Sell Signals
Bullish and Bearish Divergences
Short and Long Term Trend Indicators
Trend Strength Indicator
Market State Indicator
Real Time Informational Dashboard
Bullish and Bearish Breakout Indicator
Many More Features to Come!
By using this script you acknowledge that MechaOscillator cannot guarantee you profit, and that this product was only created in attempt to benefit traders. You also acknowledge that past performance is not indicative of future results, and that the experience of other users or what you see online may not always be your experience.

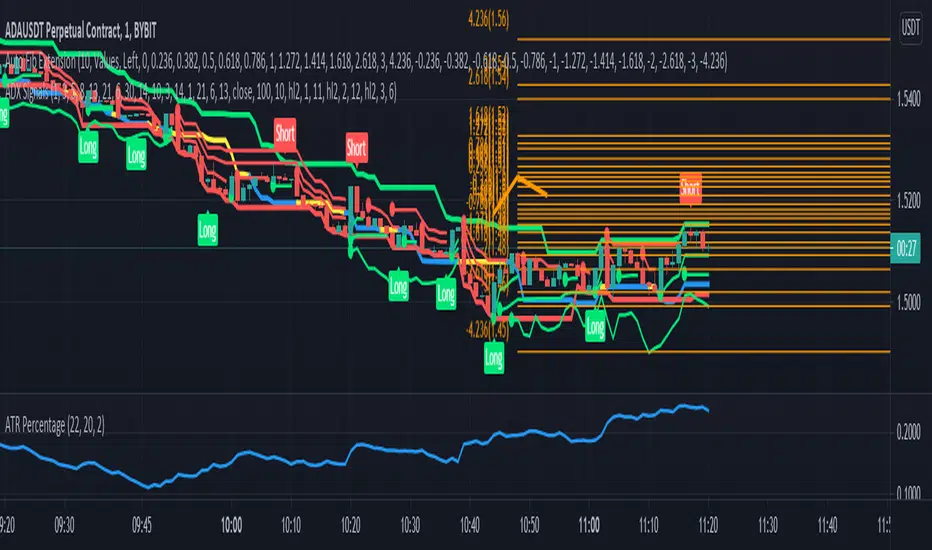
ADX SignalsThis script uses the Average Direction Index, On Balance Volume, and Exponential Moving Average, Moving Average Cross, MACD, Donchian Channels and two Parabolic SARs for stop loss, a normal one and a line one.
I tried to make the script as straightforward as possible, Buy when there is a buy signal and sell when there is a sell signal. I like using it on the smaller time-frames because I'm a scalper and I like going in and out quickly, but this indicator can be used on any timeframe and works on any instrument. The buy signal is triggered when the DI+ goes above the 30 level, the ADX is not increasing, on balance volume is at it's lowest, the price is above the lower Donchian Channel and last MACD hist bar is lower than the previous one. The sell signal is triggered when the DI- goes above the 30 level, the ADX is not increasing, on balance volume is at it's highest, the price is below the upper Donchian Channel and last MACD hist bar is upper than the previous one.
If you have any suggestions feel free to leave them in the comments below or Message me directly.
[GJ]IFRSITHE INVERSE FISHER TRANSFORM STOCH RSI
HOW IT WORKS
This indicator uses the inverse fisher transform on the stoch RSI for clear buying and selling signals. The stoch rsi is used to limit it in the range of 0 and 100. We subtract 50 from this to get it into the range of -50 to +50 and multiply by .1 to get it in the range of -5 to +5. We then use the 9 period weighted MA to remove some "random" trade signals before we finally use the inverse fisher transform to get the output between -1 and +1
HOW TO USE
Buy when the indicator crosses over –0.5 or crosses over +0.5 if it has not previously crossed over –0.5.
Sell when the indicator crosses under +0.5 or crosses under –0.5 if it has not previously crossed under +0.5.
We can see multiple examples of good buy and sell signals from this indicator on the attached chart for QCOM. Let me know if you have any suggestions or thoughts!

AIOC Indicator [Armand Snyman] V7All In One Chart Indicator V7
The All In One Chart Indicator (AIOC) consists of the following:
-BB is a Big Buy signal which means the price is going to go up really fast. The BB is there to alert you if the price goes up a lot and that it is going to happen fast.
-BS is a Big Sell signal which means the price is going to go down really fast. The BS is there to alert you if the price goes down a lot and that it is going to happen fast.
-Buy
-Sell
-Pump zones is the blue background color.
-Dump zones is the purple background color.
HOW TO USE THIS INDICATOR!
It is very simple to use this indicator. If a buy signal comes through you long or enter the market and if a sell signal comes through you short or exit the market.
If a Big buy signal comes through you long or enter the market and if a Big sell signal comes through you short or exit the market.
If a pump zone (the blue highlighted color on the background) comes in, then it is safe to enter the market or to enter a long position.
If a dump zone (the purple highlighted color on the background) comes in, then it is safe to exit the market or to enter a short position.
HOW THE BUY, SELL, PUMP AND DUMP SIGNALS ARE CALCULATED!
Using a combination of moving averages and the rsi and the macd.

SuperTrend Oscillator [LuxAlgo]This oscillator is made of three components, all derived from the SuperTrend indicator. This approach allows the user to easily determine overbought/sold zones, identify whether a retracement is present or if the price is ranging or trending. It also allows for the anticipation of the potential price cross with the SuperTrend.
We provide additional information including whether a signal returned by the SuperTrend was false, as well as the percentage of false signals.
Settings
Length: Period of the "average true range" used in the calculation of the SuperTrend
Mult: Multiplicative factor for the "average true range"
Smooth: Determines the degree of smoothing of the histogram
Misc:
Fixed Transparency: Use a fixed transparency for the main oscillator
Show Lines: Show the lines displayed by the indicator
Show Labels: Show the labels displayed by the indicator
Usage
The indicator is in a range of (-100,100) with values closer to 100/-100 indicating a stronger trend. The main oscillator value above 0 indicates that the price is above the SuperTrend.
It is possible to identify when a retracement is present in a trend. This is often indicated by an oscillator value moving within 50/-50.
Each overbought/oversold level can be used to determine potential exit points.
The indicator also includes two additional oscillators derived from the main oscillator. A smoothed version of the main oscillator (Signal), and a smoothed version of the difference between the Main and Signal oscillators (Histogram), thus making the oscillator part of the indicator more similar to MACD.
One can use the histogram to anticipate when the price might cross the SuperTrend by comparing the sign between the main and histogram. Potential false signals can also be filtered with this method.
Certain crosses between the price and SuperTrend can be filtered out when the histogram and main oscillator have a different sign (here main = 1, histogram = -1).
We include various indications in order to analyze the signals returned by the SuperTrend. The indicator displays symbols indicating whether a signal was false or not.
A cross symbol will be displayed at the top of the displayed lines when the previous Buy signal was false, else a checkmark is displayed. Symbols displayed at the bottom of the lines are referring to sell signals. We also provide a percentage of false signals, calculated over the entire chart history.
Details
The scaling method used is similar to max-min normalization. We first compute the difference between the price and SuperTrend and divide the result by the difference between the upper and lower extremity used to compute the SuperTrend. Values higher than (1,-1) can occur when price crosses the SuperTrend and as such we use the max and min functions to attenuate these.
The filter used to compute the signal line is based on exponential averaging and is fully adaptive. The smoothing factor used for its computation is the squared value of the main oscillator, divided by length . Since higher values of the oscillator are associated with trending markets, the filter will be closer to the main oscillator when the market is ranging.

[TS] ScalperThis indicator is our oscillator-based scalper.
In order to detect a trend reversal (for a scalping trade), the script is checking multiple oscillators ( Stochastic RSI, RSI, TS Oscillator, etc) looking for Overbought or Oversold scenarios.
After such a scenario is detected, the indicator verifies the state of the Volume, BollingerBands, the candle size and/or pattern in order to trigger a signal.
*The indicator will not work on exchanges that do not provide volume data!
The only adjustable input is the lookback length, which adjusts the maximum allowed distance (number of candles) between the Oscillator Overbought/Oversold states, BollingerBands state and candle size/pattern condition.

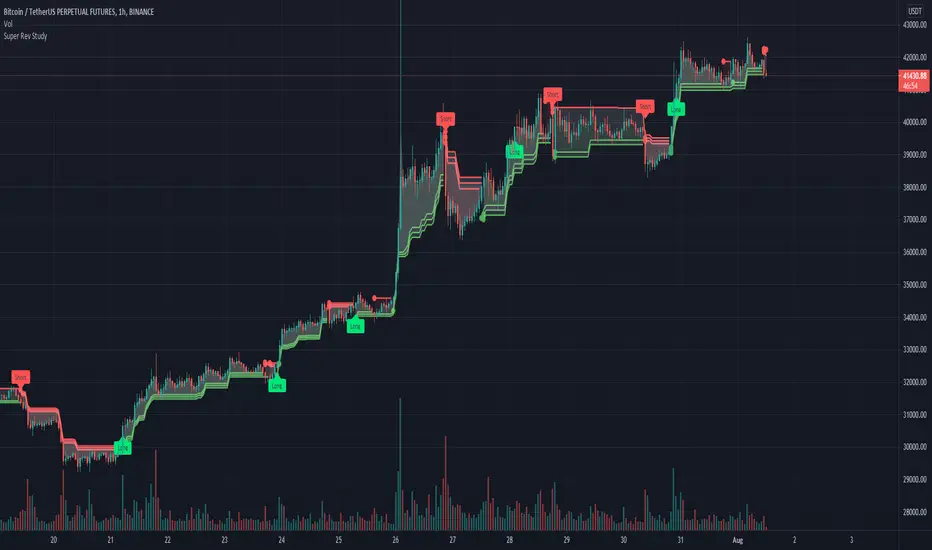
Super Rev StudyThe super Rev Study is a buy sell indicator that uses a combination of 3 super trend lines , EMA, Williams %R and the squeeze momentum indicator.
The super trend lines and ema are utilised to locate the trend.
The williams %R has been incorporated to determine overbought/oversold conditions.
The buy and sell flags are generated based on the following conditions:
The location of the price in relation to the super trend lines
if the price is above or below the EMA.
If the Williams %R is oversold/overbought
The squeeze momentum indicator can be added as a filter to only allows trade in certain conditions i.e bullish and above the 0 line or avoid trades if bearish and above the 0 line for example.
All the indicators involved can be customised to created a unique indicator
Created by manomanomano, Developed by @badshah_e_alam
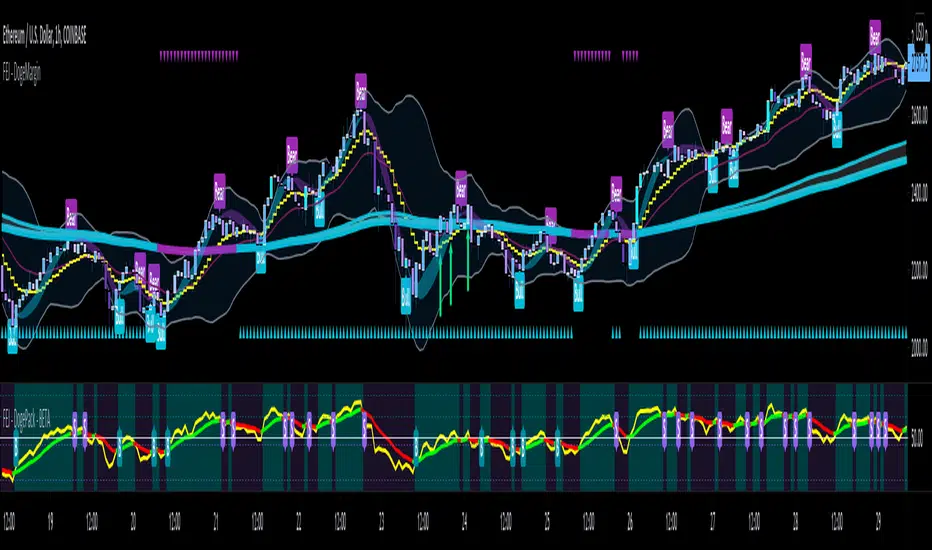
FEJ - DogePack by FiatEaterJens Buy/Sell - BETABETA
Dieses Script ist eine einfache Kombination aus RSI und EMA .
Es erlaubt euch zu erkennen in welche Richtung der Trend in dem aktuellen
TimeFrame geht und wie stark dieser aktuell ist.
Außerdem zeigt es euch ob gerade eher die Bullen oder die Bären den Markt
dominieren. Mit Hilfe des Indikators lassen sich Top und Bottom des aktuellen
Time Frames erkennen.
Ich Empfehle nur eine Nutzung bei BTC um Wellen besser zu erkennen.
Erinnert euch daran, das ist nur eine Beta und gibt immer noch viele Fehlsignale aus, also testet es für euch selber in verschiedenen TimeFrames.
This script is a simple combination of RSI and EMA .
It allows you to see in which direction the trend is going in the current
time frame and how strong it is currently. It also shows you whether the
bulls or the bears are dominating the market. With the help of the indicator,
the top and bottom of the current time frame can be recognized.
recommended only use in BTC to better detect waves.
remember that it is in beta and still sends many false signals so you have to test it well in several time periods.
Angle Attack Follow Line Indicator This indicator works with Follow Line Indicator , evaluates the angle for possible additions or reductions of the position. Many settings to play with:
s3.tradingview.com
- FOLLOW LINE CURRENT CHART RESOLUTION
- FOLLOW LINE HIGHER TIME FRAME
- FILTER HIGHER TIME FRAME
- NO FILTER HIGHER TIME FRAME
- ANGLE CONFIGURATION
- ANGLE LEVELS
- BUY / SELL
- OPTIONS TO ADD
- OPTIONS TO REDUCE
- BAR COLOR
- LABELS
-ALERTS
MANAGE YOUR RISK AND CAPITAL WELL IF YOU DO NOT WANT TO LOSE EVERYTHING¡¡¡
TO PLAY¡¡¡

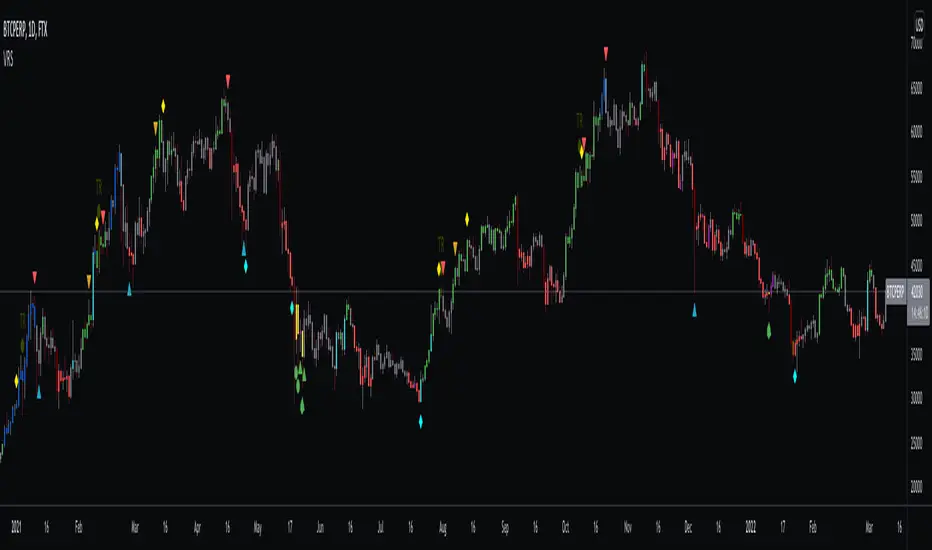
VR Crayons (Signals, Trend and Reversal Indicator)This indicator is a combination of many different basic technical analysis tools, such as RSI, Bollinger Bands, Moving Averages and others.
It's main goal is to provide a fast and reliable visual representation of the current price action and possible entry and exit points for trades.
Explanation of the individual functions:
The indicator includes 2 different functions:
1) The crayons (colors of the candles) show the current state of price action and trend
and can be used to find oversold or overbought areas as well price reversal points.
The colors can be turned off and/or changed in the settings.
2) The signals that can be used to enter or exit trades. There are 4 different types of signals:
Mini signals, high/low timeframe signals and special signals.
All of them can be turned on and off in the settings.
Further explanations
Crayons:
There are 3 general colors, gray, green and red.
Red signals a general downtrend,
Green a general uptrend,
Gray sideways action.
There are also multiple other colors to visualize special situations:
Blue signals overbought areas
Orange signals oversold areas
Yellow and purple signalling heavy oversold areas and a possible trend reversal to the upside
Dark Green signals heavy overbought areas and a possible trend reversal to the downside (Also marked with "R")
Lastly there are two special candle colors, dark red and light blue.
Those are volume weighted indicators of heavy dumping/pumping. I implemented them to signal higher than
average volume which dan be useful when looking for breakouts/-downs or to avoid fomoing into huge pumps or dumps
Signals:
As mentioned above, there are 4 different signal categories.
Signals for Lower Timeframes (5-30m) and Higher Timeframes (1h-D), special signals working on all timeframes
and mini signals which can be taken as TP points but also as entry points for trades.
The placement of the signals shows if it's a "BUY" (below the candles) or a "SELL" (above the candles).
Even-though signals are named "LTF signals", from my experience they can be used on all timeframes.
HTF signals do not work as good on lower timeframes.
For the best visualisation, disable candle borders in settings and turn the wick color to gray.
!! DISCLAIMER !!
All of these signals and bar colors are just visual helpers to find possible entry and exit points for your trades
and to get a quick overview of the current market conditions.
I would always recommend to use at least some basic technical analysis in combination.
And as always in trading, please use proper risk management! None of these signals can an will be 100% accurate!
!! All of these signals and colors are only valid AFTER candle close !!
!! This indicator is NOT repainting !!
Please don't use the comment section to ask for access to this indicator, you can always write me a PM.
QFLOW SUITE QFLOW SUITE is a signal-based comprehensive trading suite for trading across all timeframes. It is designed to be a tool for discretionary traders and there are numerous ways to utilize this trading suite.
INCLUDES :
Buy / Sell Signals
Candle Coloring
Automatic Level Plotting
Trend Following System
Stop Loss Management System
Trend Reversal Mechanisms
Volatility Breakout Algorithm
Mean Reversion Algorithm
Buy / Sell Signals
There are multiple conditions detected by QFLOW Algorithm which are constantly worked on and improved
Candle Coloring
Color coding allows information compression and helps traders analyze the charts in a simple and intuitive manner. The base coloring is meant for trend following and consists of 3 colors :
Green - Trend up
Grey - Rangebound Consolidation
Red - Trend down
The second type of candle coloring is for the special conditions like buy / sell signals or divergences.
Volatility Breakout Algorithm
This part of the algorithm identifies a volatility breakout before it happens by showing a colored shaded squeeze which happens during consolidation. When a potential breakout is detected, an arrow is printed below or above that candle depending on the direction. Most times a second arrow is needed to signal a confirmed breakout. This arrow will be plotted with a 'B' or 'S' in the same color as the arrow.
False Breakout Detection
The algorithm is taught to detect these kind of false breakouts and prints a signal as an arrow with an 'F' below or above the candle.
Mean Reversion Algorithm
A hybrid algorithm that takes both momentum and mean reversion into account for high accuracy.
Automatic Level Plotting
Stop Loss Management System
QFLOW SUITE contains an adaptive trailing ATR system that can be used for stop loss management. It is plotted as a line below the price when the trend is up and above the price when the trend is down. It is highly effective because it is designed to adapt both to the true range ( a measure of the degree of price volatility ) as well as to the average direction change.
Extreme Background Highlighting
The algorithm is taught to analyze multiple technical components. When this option is turned on it will highlight the background when these extreme conditions are met. These highlights will often occur at the tops or bottoms and during times of high volatility. A trader can use this option as extra confluence when making certain trading decisions like taking profits or closing out trades.

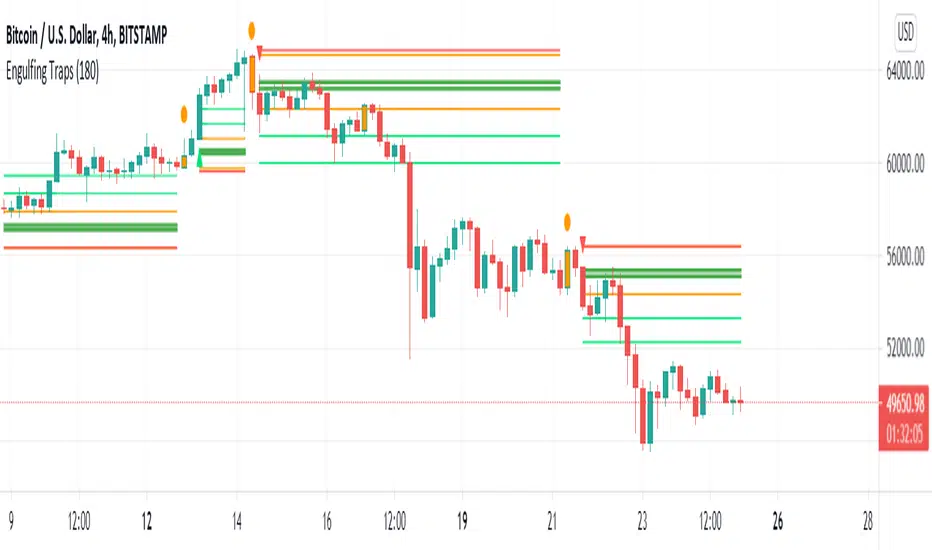
Engulfing Traps (Beta)This indicator scans the market for entries based on engulfing candles that "trap" candles (in terms of orders and price)
The indicator also detects killzones, which are basically supply and demand zones. We like to think of these as areas of which banks are placing their orders.
The indicator gives the 2 entry lines once the a breakout candle has appeared (red or green arrow on the engulfing)
Once the arrow appears on the breakout candle, the indicator will then draw:
-2 orange lines to box up the engulfing candle
-2 entry lines (dark green)
-SL line (red)
-2 Take profit lines (bright green)
New traps are not taken when a current trap is still active
*This indicator in no way is meant to be 100% accurate, please do your own analysis before placing any trades and trade with proper risk, as this market is extremely volatile and risky. Past profits don't guarantee future results*
FOR ACCESS: Please send us a private message to gain access to this indicator.
Roc & Atr
Roc & Atr Orders
My indicator, where I compare the 20 bar change percentage with the 14 bar atr band, I hope it will be useful to everyone. the green zones can be interpreted as BUY and the red zone as SELL zone. In graphs with high motion and low atr, the channel narrowing can be interpreted as BUY and the channel opening as SELL.
No indicator shows you the right way ... The best way is your own thoughts

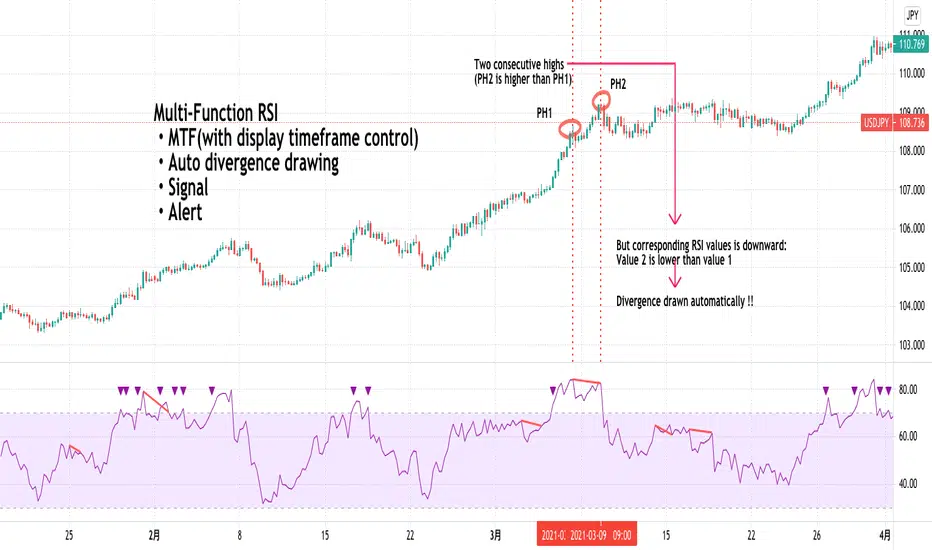
Multi-Function RSI(MTF, divergence, signal and alert)Japanese below / 日本語説明は下記
Overview
Multi-function RSI indicator with functions below.
1.MTF with display timeframe control
2.Auto divergence drawing incl. hidden divergence
3.Signal when RSI crosses over upper band/crosses under lower band
4.Color background when MTF RSI crosses over/under lower band
5.Alert when RSI crosses over upper band/crosses under lower bands
Please see the details below.
Functions:
1.MTF with display timeframe control
You can display daily, 4hour or 1 hour RSI or all of them as upper timeframe MTF RSI.
How is it different from other MTF indicators?
Problems with other MTF RSI indicators are;
-If you set higher timeframe RSI, it will also be shown on further higher timeframes.
i.e. If you set 4hour chart’s RSI on 1 hour or lower time frame charts, it will also appear on daily and weekly chart, which is not necessary.
To tackle these problems, this indicator has incorporated functions below.
-To show MTF RSI on timeframe lower than the upper timeframe you set as MTF timeframe.
For example, if you select daily timeframe for MTF RSI , the RSI will be shown only on 4 hour or lower timeframes(1H, 30M, 15M, 5M, 1M).
Left: 4hour chart, Middle: Daily chart, Right: Weekly chart
If you look at 4hour chart, daily chart’s RSI is shown(pale blue and orange) but weekly chart does not show daily chart’s RSI.
2.Auto divergence drawing incl. hidden divergence
Regular divergence line and hidden divergence line will be automatically drawn for current timeframe RSI as per the logic below.
Bearish : When two consecutive pivot highs go up but RSI values corresponding to each high go down.
Bullish: When two consecutive pivot lows go down but RSI values corresponding to each low go up.
Pivot highs(lows) are identified when those are preceded by n lower highs(lows) and proceeded by n lower highs(lows).
* n is parameterized.
See the diagram below.
Bearish : When two consecutive pivot highs go down but RSI values corresponding to each highs go up.
Bullish : When two consecutive pivot lows go up but RSI values corresponding to each low go down.
3.Signal when RSI crossing upper/lower bands
Signal will be shown when;
-RSI(current timeframe) crosses over upper band
-RSI(current timeframe) crosses under lower band
Example:
Purple triangle is signals.
4.Color background when MTF RSI crosses over/under lower band
Background color can be applied when MTF RSI crosses over upper band/under lower band.
Example:
Pale purple is daily RSI on 4 hour chart. Background color applied while daily RSI is outside upper/lower bands.
5.Alert when RSI crosses over upper band/under lower band
Alert can be set when;
-RSI crosses over upper band
-RSI crosses under lower band
How to use this indicator?
This indicator is paid indicator and invited-only indicator.
Please contact me via private chat or follow links in my signature so that I can grant the access right to the indicator.
Comment section is only for comments on the indicator or updates. Please refrain from contacting me using comments to follow TradingView house rules.
———————————————————————————————————————
多機能RSIインジケーターです。以下の機能が搭載されています。
1.マルチタイムフレーム機能(表示時間足制御機能付き)
2.ダイバージェンス自動描画機能(ヒドゥンダイバージェンス対応)
3.RSIがアッパーバンド、ロワーバンドとクロスした時にシグナル表示
4.上位足RSI(MTF RSI)がアッパーバンドより上にある時、ロワーバンドより下にある時に背景をハイライト
5.RSIがアッパーバンド、ロワーバンドとクロスした時にアラート設定
機能詳細は以下の通りです。
機能詳細
1.マルチタイムフレーム機能(表示時間足制御機能付き)
日足、4時間足、1時間足のいずれか、もしくは全てをRSIをマルチタイムフレームRSIとして表示することができます。(不要な場合は非表示可能)
他のマルチタイムフレームRSIとの違い
他のマルチタイムフレームRSIのインジケーターでは、以下の問題に直面します。
・上位足のRSIを表示すると、さらに上位足でもそのRSIが表示され見にくくなる。
例: 4時間足のRSIを下位足で表示可能な様に設定すると、日足や週足でも表示され、チャートが見にくくなる。
この問題に対して、このインジケーターでは、
・上位足のRSIを表示する時間軸を制御することで上位足で不必要な情報を表示させない。
という機能を加えることでこの問題を解決しています。
具体的には、マルチタイムフレーム用に選択した上位足のタイムフレームより小さいタイムフレームでのみ上位足のRSIが表示されるようになっています。
例えば、上位足として日足を選択した場合、日足のRSIは4時間足、1時間足、30分足、15分足、5分足、1分足にのみ表示されます。
<サンプルチャート>
左から4時間足、日足、週足です。
4時間足では日足のRSI(薄いパープルのライン)が表示されていますが、週足には表示されません。これはオシレーターが表示される時間軸を裏側のロジックで制御しているためです。
2.ダイバージェンス自動描画機能(ヒドゥンダイバージェンス対応)
以下のロジックに基づきダイバージェンスを自動描画します。(不要な場合は非表示可能)
<通常のダイバージェンス>
下降示唆:2つの連続する高値(*)が切り上げられているが、 それぞれの高値に対応するRSIの値は切り下げている場合
上昇示唆:2つの連続する安値(*)が切り下がっているが、 それぞれの安値に対応するRSIの値は切り上がっている場合
*高値(安値)は、左右n本(**)ずつのローソク足の高値(安値)より高い(低い)高値(安値)をピボットハイ・ローとして算出しています。
** nはユーザ設定値です。
<例: ダイバージェンス>
高値PH1はPH1のローソクの高値より左側にn個のより低い高値、右側にn個のより低い高値があった場合に高値として認識されます。
上記の例では高値がPH2>PH1と切り上がっていますが、対応するRSIの値はvalue2
下降継続示唆:2つの連続する高値(*)が切り下がっているが、 それぞれの高値に対応するRSIの値は切り上がっている場合
上昇継続示唆:2つの連続する安値(*)が切り上がっているが、 それぞれの安値に対応するRSIの値は切り下がっている場合
言うまでもないことですが、ダイバージェンスが出たから逆張り、などの安易な発想は避けるべきです。
環境認識の一つの要素として見るべき指標でしょう。
3.RSIがアッパーバンドを上抜いた時、ロワーバンドを下抜いた時にシグナル表示
アッパーバンド(初期値70)とロワーバンド(初期値30)の数値は変更可能です。
サンプルチャート:
4.上位足RSI(MTF RSI)がアッパーバンドより上にある時、ロワーバンドより下にある時に背景をハイライト
サンプルチャート:
日足のRSI(薄いパープルのライン)がアッパーラインより上にある時に背景がグレーがかっています。
このように上位足のRSIの状況を視覚的に認識したい時に役立つでしょう。
日足RSIラインは非表示にすることができますので、背景色だけ表示しておいて、背景に色が付き、かつダイバージェンスも出たら反転を警戒といった状況判断が可能です。
5.RSIがアッパーバンド、ロワーバンドとクロスした時にアラート設定
アラートを設定したいタイムフレームを開いた状態で、アラート設定の画面を開き以下の条件を選択することができます。
・RSIがアッパーバンドを上抜いた時
・RSIがロワーバンドを下抜いた時
インジケーターの使用について
当インジケーターは招待制インジケーター(有料)となっています。
使用を希望される方はプライベートチャットや下記リンクのDMでご連絡ください。
このページのコメント欄はインジケーターそのものに対するコメントやアップデートの記載のためのものとなっております。Tradingviewのハウスルールを守るためにもコメント欄からの連絡はご遠慮ください。
T3 Gold Sniper [RickAtw]Gold Sniper based on support and resistance looks for a sniper entry for trades. Used together with EMA
Key signal
Buy ------> Green Line
Sell ------> Red Line
Functional
The system was made for gold and everything is tuned for it.
I am a professional investor and I test each system for how long. If the system makes an income, it gets to my page. Use it for gold, cryptocurrencies and pairs AUD/USD GBP/USD
TV Community AlgoTV Community Algo is a free TradingView script that I designed from the ground to benefit the traders of this community. It has plenty of features that you will enjoy, and I have included documentation for how to use this below!
Settings:
Basic:
Turn the Void Lines on or off
Turn the Dashboard on or off
Turn the Signal Bars on or off
Turn the Support & Resistance Lines on or off
Turn the EMA 8 and EMA 200 on or off
Turn the Buy & Sell Signals on or off
Turn the Fibonacci Retracement Tool on or off
Style:
Change the Dashboard's distance from the price action
Change the Dashboard's Color and Transparency
Change the Dashboard Text Color
Change the Fibonacci Deviation
Make the Fibonacci Retracement Tool reverse
Make the Fibonacci Lines extend left, right, both directions, or none
Turn Fibonacci Prices on or off
Turn Fibonacci Levels on or off and change between percent or value
Change Fibonacci Label Position from the left or the right
Usage:
This algo has many uses including but not limited to:
Finding entries and exits using the EMA 8 and EMA 200 crossovers
Using the Void Lines to identify bounces or reversals
Using the Signal Bars to identify trend and confirmation for entries and exits
Using the Dashboard information for confirmation and informational purposes
In the images below, I give a few examples of the many uses of the TV Community Algo!
VOID LINES
The Void Lines are very helpful when it comes to identifying reversals.
TV COMMUNITY ALGO DASHBOARD
The Dashboard is filled with useful information that all traders can benefit from!
SIGNAL BARS
The colored candles known as Signal Bars inform you of when the price action is above or below the midpoint of the Void Lines.
AUTO SUPPORT & RESISTANCE LINES
These lines help traders find accurate levels of support & resistance on all time frames, and the lines change color depending on if the price is above or below them.
EMA 8 AND 200
The EMA 8 and EMA 200 crossovers can be used as entry and exit signals.
BUY & SELL SIGNALS
The BUY & SELL signals can be used to find optimal entries and exits for trades on any time frame. Smaller time frames are best for scalping, while larger time frames are more suited for longer trades. When combined with the EMA lines and Dashboard information, these signals can produce incredibly profitable trades.
AUTO FIBONACCI RETRACEMENT TOOL
The Auto Fibonacci Retracement Tool allows you to plot perfect Fib Lines every time.
Conclusion:
I truly hope that the TV Community Algo benefits the TradingView community and that you all find some value in it. I worked very hard on this product and I would love to see it put to good use.
with love,
-Lemon 🍋
This work is licensed under a Attribution-NonCommercial-ShareAlike 4.0 International (CC BY-NC-SA 4.0) creativecommons.org

BitcoinNinjas NINJASIGNALS V4 (Script)BitcoinNinjas NINJASIGNALS V4 (Script)
(for Cryptocurrencies, Forex, GunBot, ProfitTrailer, Autoview, CryptoHopper, manual or automated trading, and more)
This is version 4 of our Ninja Signals trading script, with accompanying backtesting strategy.
BitcoinNinjas NINJASIGNALS V4 (Strategy)
•Allows users to easily set automated buy/long and sell/short alerts on TradingView for use with automatic and manual trading of cryptocurrencies, Forex securities, and more (alerts are compatible with automatic trading software such as GunBot, ProfitTrailer, Autoview, CryptoHopper, and more).
•Synthesizes many powerful indicators [e.g., Relative Strength Index (RSI), Stochastic RSI, Money Flow Index (MFI), Moving Average Convergence Divergence (MACD), etc.) into one powerful script to generate very precise buy and sell signals in virtually all market conditions.
•Features user-defined adjustable calibration settings, allowing traders to customize the script to fit any currency / security on any exchange available through TradingView.com, simply by adjusting settings.
•Buy/Long arrows, Sell/Short arrows, & EMA trendline can be customized or hidden, if desired.
•Complete with backtesting strategy version of script which allows users to test various trading strategies based on the alerts the script generates (see information and screenshots below).
•Backtesting strategy features a user-defined adjustable date range, so traders can estimate performance of the script over specific periods of time, such as the last week, month, or year.
•Script and backtesting strategy feature many user-adjustable settings including stop loss and take profit alerts, an ‘only sell for profit’ option (Gunbot-specific), many different buy and sell filters, and more. Simply adjust the script settings and the backtesting results will automatically refresh.
•Backtesting strategy allows for pyramid buying to test various average down / dollar cost average trading strategies. Simply adjust the number of pyramid buys and the quantity of each buy.
•Fully compatible with margin and futures trading for any currency / security on TradingView.com.
DISCLAIMER: By using our BitcoinNinjas ‘Ninja Signals’ planning script, you agree to the BitcoinNinjas 'Terms of Use'. No sharing, copying, reselling, modifying, or any other forms of use are authorized for our documents, script / strategy, and the information published with them. This informational planning script / strategy is strictly for individual use and educational purposes only. This is not financial or investment advice. Investments are always made at your own risk and are based on your personal judgement. BitcoinNinjas is not responsible for any losses you may incur. Please invest wisely.

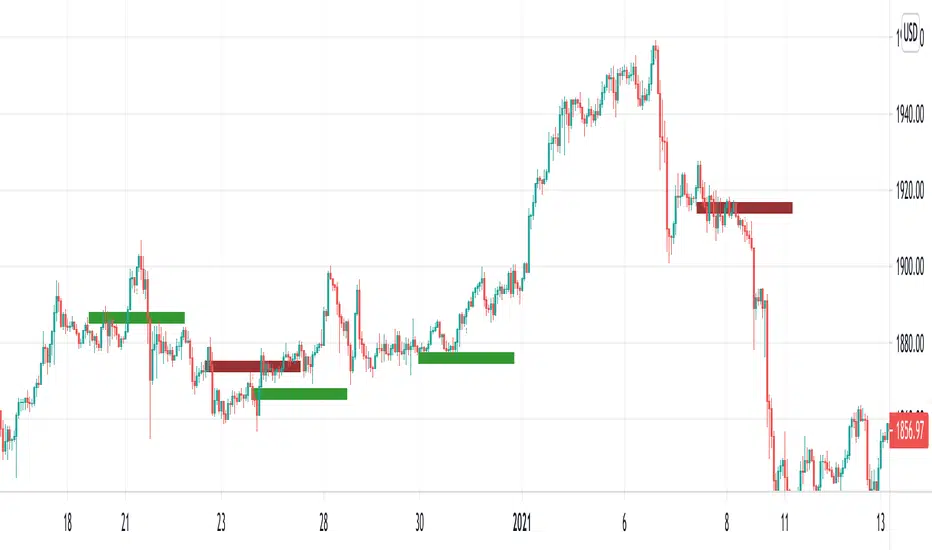
LIZ AUTO PILOT+W-ENVELOPEThe envelope indicating the deviation from the moving avarage line should be changed depending on the investment target and time scale.
This indicator displays the appropriate envelope line depending on the brand and time you want to analyze, because it presets those settings.
You can also adjust envelope settings according to your market environment, so you can always display lines that fit your current situation.
This indicator includes not only the envelope, but also the signature tool.
The sign tool lights up according to the relationship with the moving average line.There are three types of signs: short-term sign, medium-term sign, and long-term sign, indicating a clear trend when all are aligned in the same direction.
In addition, you can create a trading strategy by taking advantage of the tendency to align the directions in the order of short, medium, and long.
移動平均線からの乖離を示すエンベロープは、銘柄や時間足に応じて設定を変える必要があります。
このインジケーターはそれらの設定をプリセットしている理由で、あなたが分析したい銘柄と時間足に応じて、適切なエンベロープラインを表示してくれます。
またマーケット環境に応じてエンベロープの設定をアジャストできますので、常に現在の状況にフィットしたラインを表示する事が可能です。
このインジケーターには、エンベロープだけでなく、サインツールも搭載されています。
サインツールは移動平均線との関係に応じて点灯します。サインの種類は短期サイン、中期サイン、長期サインの3つで、全てが同じ方向に揃ったらトレンドがはっきり出ている事を表します。
また、短期、中期、長期の順に方向が揃って行く性質を利用して、あなたはトレード戦略を立てる事ができます。

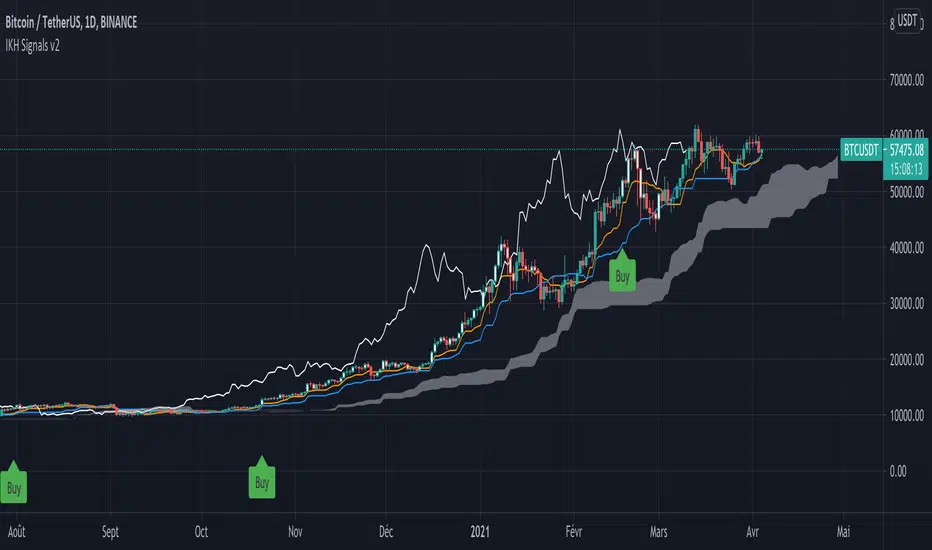
IKH Signals v2Hi,
I'm happy to release this new update after few weeks working.
Fixes
Fix kumo break-out of Chiku span and close price
Fix buy trigger and strong buy trigger
Improvement
Signals take now the kumo thickness and kumo angle
Signals does not trigger on doji candles
Multi time frame validation is now available
I hope this fixes and new features will improve the signals for you too.
Let me know if you find strange behavior or possible improvments.
Multi-Function Stochastic(MTF, divergence, signal and alert)Japanese below / 日本語説明は下記
Overview
Multi-function Stochastic indicator with functions below.
1.MTF with display timeframe control
2.Auto divergence drawing incl. hidden divergence
3.Signal when % K crosses over %D incl. MTF %K and %D
4.Alert when % K crosses over %D
Please see the details below.
Functions:
1.MTF with display timeframe control
You can select one upper timeframe from monthly, weekly, daily, 4hour, 1hour, 30mins, 15mins, 5mins to display upper timeframe’s Stochastic as MTF Stochastic.
How is it different from other MTF indicators?
Problems with other MTF Stochastic indicators are;
-If you set higher timeframe Stochastic, it will also be shown on further higher time frames.
i.e. If you set 4hour chart’s Stochastic on 1 hour or lower time frame charts, it will also appear on daily and weekly chart, which is not necessary.
To tackle these problems, this indicator has incorporated functions below.
-To show MTF Stochastic on timeframe lower than the upper timeframe you set as MTF timeframe.
For example, if you select daily timeframe for MTF Stochastic , the Stochastic will be shown only on 4 hour or lower timeframes(1H, 30M, 15M, 5M, 1M).
Left: 4hour chart, Middle: Daily chart, Right: Weekly chart
If you look at 4hour chart, daily chart’s Stochastic is shown(pale blue and orange) but weekly chart does not show daily chart’s Stochastic.
2.Auto divergence drawing incl. hidden divergence
Divergence line and hidden divergence line will be automatically drawn for the current timeframe Stochastic as per the logic below.
Bearish : When two consecutive pivot highs go up but %K values corresponding to each high go down.
Bullish: When two consecutive pivot lows go down but %K values corresponding to each low go up.
Pivot highs(lows) are identified when those are preceded by n lower highs(lows) and proceeded by n lower highs(lows).
* n is parameterized.
See the diagram below.
Bearish : When two consecutive pivot highs go down but %K values corresponding to each highs go up.
Bullish : When two consecutive pivot lows go up but %K values corresponding to each low go down.
3.Signal when % K crossing %D
Signal will be shown when;
-%K crosses over %D below lower band
-%K crosses under %D above upper band
-%K(MTF) crosses over %D(MTF) below lower band
-%K(MTF) crosses under %D(MTF) above upper band
4.Alert when % K crossing %D
Alert can be set when;
-%K crosses over %D below lower band
-%K crosses under %D above upper band
How to use this indicator?
This indicator is paid indicator and invited-only indicator.
Please contact me via private chat or follow links in my signature so that I can grant the access right to the indicator.
Comment section is only for comments on the indicator or updates. Please refrain from contacting me using comments to follow TradingView house rules.
———————————————————————————————————————
多機能ストキャスティクスインジケーターです。以下の機能が搭載されています。
1.マルチタイムフレーム機能(表示時間足制御機能付き)
2.ダイバージェンス自動描画機能(ヒドゥンダイバージェンス対応)
3.%Kが%Dをクロスした時にシグナル表示(MTFの%Kと%Dでも同様)
4.%Kが%Dをクロスした時にアラート設定可能
機能詳細は以下の通りです。
機能詳細
1.マルチタイムフレーム機能(表示時間軸制御機能付き)
月足、週足、日足、4時間足、1時間足、30分足、15分足、5分足の中から一つを選択し、上位足のストキャスティクスとして表示することができます。(不要な場合は非表示可能)
他のマルチタイムフレームストキャスティクスとの違い
他のマルチタイムフレームストキャスティクスのインジケーターでは、以下の問題に直面します。
・上位足のストキャスティクスを表示すると、さらに上位足でもそのストキャスティクスが表示され見にくくなる。
例: 4時間足のストキャスティクスを下位足で表示可能な様に設定すると、日足や週足でも表示され、チャートが見にくくなる。
この問題に対して、このインジケーターでは、
・上位足のストキャスティクスを表示する時間軸を制御することで上位足で不必要な情報を表示させない。
という機能を加えることでこの問題を解決しています。
具体的には、マルチタイムフレーム用に選択した上位足のタイムフレームより小さいタイムフレームでのみ上位足のストキャスティクスが表示されるようになっています。
例えば、上位足として日足を選択した場合、日足のストキャスティクスは4時間足、1時間足、30分足、15分足、5分足、1分足にのみ表示されます。
<サンプルチャート>
左から4時間足、日足、週足です。
4時間足では日足のストキャスティクスが表示されていますが、週足には表示されません。
2.ダイバージェンス自動描画機能(ヒドゥンダイバージェンス対応)
以下のロジックに基づきダイバージェンスを自動描画します。(不要な場合は非表示可能)
<通常のダイバージェンス>
下降示唆: 2つの連続する高値(*)が切り上げられているが、 それぞれの高値に対応するストキャスティクスの値は切り下げている場合
上昇示唆: 2つの連続する安値(*)が切り下がっているが、 それぞれの安値に対応するストキャスティクスの値は切り上がっている場合
*高値(安値)は、左右n本(**)ずつのローソク足の高値(安値)より高い(低い)高値(安値)をピボットハイ・ローとして算出しています。
** nはユーザ設定値です。
<例: ダイバージェンス>
高値SH1はSH1のローソクの高値より左側にn個のより低い高値、右側にn個のより低い高値があった場合に高値として認識されます。
上記の例では高値がSH1>SH2と切り上がっていますが、対応する%Kの値はvalue2>value1と切り下がっているためダイバージェンスと認識されダイバージェンスラインが自動描画されます。
<ヒドゥンダイバージェンス>
下降継続示唆: 2つの連続する高値(*)が切り下がっているが、 それぞれの高値に対応するストキャスティクスの値は切り上がっている場合
上昇継続示唆: 2つの連続する安値(*)が切り上がっているが、 それぞれの安値に対応するストキャスティクスの値は切り下がっている場合
言うまでもないことですが、ダイバージェンスが出たから逆張り、などの安易な発想は避けるべきです。
環境認識の一つの要素として見るべき指標でしょう。
3.%Kが%Dとクロスした時にシグナル表示(MTFの%Kと%Dでも同様)
以下の条件を満たした時にシグナルを表示します。
-ロワーバンドより下で、%Kが%Dを上抜けた時
-アッパーバンドより上で、%Kが%Dを下抜けた時
-ロワーバンドより下で、%K(MTF)が%D(MTF)を上抜けた時
-アッパーバンドより上で、%K(MTF)が%D(MTF)を下抜けた時
4.%Kが%Dとクロスした時にアラート設定
以下の条件でアラート設定が可能です。
-ロワーバンドより下で、%Kが%Dを上抜けた時
-アッパーバンドより上で、%Kが%Dを下抜けた時
インジケーターの使用について
当インジケーターは招待制インジケーター(有料)となっています。
使用を希望される方はプライベートチャットや下記リンクのDMでご連絡ください。
このページのコメント欄はインジケーターそのものに対するコメントやアップデートの記載のためのものとなっております。Tradingviewのハウスルールを守るためにもコメント欄からの連絡はご遠慮ください。

The Bayesian Q OscillatorFirst of all the biggest thanks to @tista and @KivancOzbilgic for publishing their open source public indicators Bayesian BBSMA + nQQE Oscillator. And a mighty round of applause for @MarkBench for once again being my superhero pinescript guy that puts these awesome combination Ideas and ES stradegies in my head together. Now let me go ahead and explain what we have here.
I am gonna call it the Bayesian Q Oscillator I suppose. The goal of the script is to solve an issue both indicators on their own suffer from. QQE signals are not new and often the problem has always been false signals for them. They are good for scalping but the difference between a quality move and a small to nearly nonexistent move following a signal is not so clear. Kivanc made his normalized version to help reduce this problem by adding colors to his histogram type verision that would essentially represent if price was a trending move or in a ranging structure. As you can see I have kept this Idea but instead opted for lines as the oscillator. two yellow line (default color) is a ranging sideways area and when there is red or green it is trending up or down. I wanted to take this to the next level with combining the Bayesian probability oscillator that tista put together.
The Bayesian indicator is the opposite for its issue as it is a probability indicator that shows which candle or price movement is more likely to come next. Red rising means possibly down move soon and green means up soon. I will not go into the complex details of this indicator but will suggest others take a look at his and others to understand the idea behind them. The point I am driving at is that it show probabilities or likelyhood without the most effecient signal device to match it. This original was line form and now it is background filled colors.
The idea. is that you can potentially get some stronger and more accurate reversal signals with these two paired together. when you see a sell signal or cross with the towering or rising red... maybe it is a good jump potentially. The same for green. At the same time it is a double added filter effect from just having yellow represent it is ranging... but now if you get a buy signal (example) and have yellow lines (example) along wi5h a red rising or mountain color background... it not only is an indication of ranging, but also that there is potentially even a counter move coming based on the probabilities. Also if you get into a good trade and see dual yellow qqe crosses with no color represented by the bayesian background... it is possible it might only be noise.
I have found them to work decently in the 1 hour timframe. Let me know your experience.
I hope everyone takes a look at the originals to understand them. Full credit goes to those guys for this to be here. Let me know how it is working out for you.
Here are the original links.
bayesian
Normalized QQE

