Swing Failure Zones and Signals [AlgoAlpha]Elevate your trading strategy with the Swing Failure Zones and Signals indicator by AlgoAlpha! This powerful tool helps you identify potential swing failure zones, offering clear bullish and bearish signals to guide your trading decisions. 📈💡
🎨 Bullish/Bearish Color Customization : Easily set the colors for bullish and bearish signals to match your chart preferences.
🧹 Mitigated Zone Removal : Option to remove mitigated zones from the chart for a cleaner view.
🔍 Range High/Low Lookback : Adjustable lookback period for determining significant highs and lows.
🖌 Dynamic Zone Creation : Automatically draws zones based on swing failure criteria.
🔔 Alert Conditions : Set alerts for both bullish and bearish swing failure conditions to stay informed without constant monitoring.
Quick Guide to Using the Swing Failure Zones and Signals Indicator
🛠 Add the Indicator : Search for "Swing Failure Zones and Signals " in TradingView's Indicators & Strategies. Customize settings like lookback period, colors, and zone removal options to fit your trading style.
📊 Market Analysis : Watch for the appearance of the zones and the directional arrows for potential reversal signals. Use these signals to identify key market entries and exits.
🔔 Alerts : Enable alerts for bullish and bearish swing failure conditions to capture trading opportunities without constant chart monitoring.
How it works
The indicator calculates the direction and length of each candle to identify swing failure points by comparing current high and low prices with those from the lookback period. A bullish swing failure is detected when the current low is lower than the previous low and the close is higher than the previous high, while a bearish swing failure occurs when the current high is higher than the previous high and the close is lower than the previous low. Upon detection, the script creates zones on the chart to indicate these failure points and manages them by removing invalidated zones based on the user's settings. Visual signals are plotted on the chart as arrows, and alerts are set for these conditions to help traders capture potential entry opportunities efficiently.
Enhance your trading edge with this robust tool designed to spotlight critical swing failure points in the market! 💪📈
Signals

Linear Regression Oscillator [ChartPrime]Linear Regression Oscillator Indicator
Overview:
The Linear Regression Oscillator is a custom TradingView indicator designed to provide insights into potential mean reversion and trend conditions. By calculating a linear regression on the closing prices over a user-defined period, this oscillator helps identify overbought and oversold levels and highlights trend changes. The indicator also offers visual cues and color-coded price bars to aid in quick decision-making.
Key Features:
◆ Customizable Look-Back Period:
Input: Length
Default: 20
Description: Determines the period over which the linear regression is calculated. A longer period smooths the oscillator but may lag, while a shorter period is more responsive but may be noisier.
◆ Overbought and Oversold Thresholds:
Inputs: Upper Threshold and Lower Threshold
Default: 1.5 and -1.5 respectively
Description: Define the upper and lower bounds for identifying overbought and oversold conditions. Values outside these thresholds suggest potential reversals.
◆ Candlestick Color Plotting:
Input: Plot Bar Color
Default: false
Description: Option to color the price bars based on the oscillator's value, providing a visual representation of market conditions. Bars turn cyan for positive oscillator values and blue for negative.
◆ Mean Reversion and Trend Signals:
Visual markers and labels indicate when the oscillator suggests mean reversion or trend changes, aiding in identifying key market turning points.
◆ Invalidation Levels:
Tracks the highest and lowest prices over a recent period to set levels where the current trend signal would be considered invalidated.
◆ Gradient Color Coding:
Utilizes gradient color coding to enhance the visualization of oscillator values, making it easier to interpret overbought and oversold conditions.
◆ Usage Notes:
Setting the Look-Back Period:
Adjust the "Length" input based on the timeframe and the type of trading you are conducting. Shorter periods are more suited for intraday trading, while longer periods can be used for swing trading.
Interpreting Thresholds:
Use the upper and lower threshold inputs to fine-tune the sensitivity of the overbought and oversold signals. Higher absolute values reduce the number of signals but increase their reliability.
Candlestick Coloring:
Enabling the "Plot Bar Color" option can help quickly identify the current state of the oscillator in relation to the zero line. This visual aid can be particularly useful in fast-moving markets.
Mean Reversion and Trend Signals:
Pay attention to the symbols and labels on the chart indicating mean reversion and trend changes. These signals are designed to highlight potential entry and exit points.
Invalidation Levels:
Use the plotted invalidation levels as stop-loss or signal invalidation points. If the price moves beyond these levels, the current trend signal is likely invalid.
This indicator helps traders identify overbought and oversold conditions, potential mean reversions, and trend changes based on the linear regression of the closing prices over a specified look-back period.

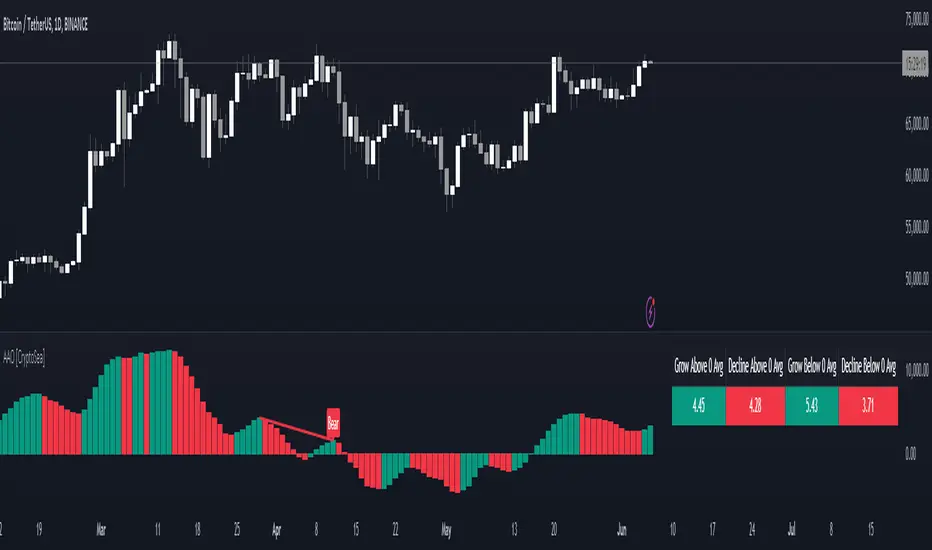
Advanced Awesome Oscillator [CryptoSea]Advanced AO Analysis Indicator
The Advanced AO Analysis indicator is a sophisticated tool designed to evaluate the Awesome Oscillator (AO) in search of regular and hidden divergences that signal potential price reversals. By tracking the intensity and duration of the AO's movements, this indicator aids traders in pinpointing critical points in price action.
Key Features
Divergence Detection: Identifies both regular and hidden bullish and bearish divergences, providing early signs of potential market reversals.
Customizable Lookback Periods: Allows users to set specific lookback windows to define the strength and relevance of detected divergences.
Adaptive Oscillator Display: Features customizable display options for the AO, enabling users to view data in different modes suited to their analysis needs.
Alert System: Includes configurable alerts to notify users of potential divergence formations, helping traders respond promptly.
How it Works
AO Calculation: Computes the AO as the difference between short-term and long-term moving averages of the midpoints of bars, highlighting momentum shifts.
Pivot Point Analysis: Utilizes advanced algorithms to find low and high pivot points based on the oscillator values, crucial for spotting trend reversals.
Range Validation: Verifies that divergences occur within a predefined range from pivot points, ensuring their validity and strength.
Visualisation: Plots AO values and potential divergences directly on the chart, aiding in quick visual analysis.
Application
Strategic Decision-Making: Assists traders in making informed decisions by providing detailed analysis of AO movements and divergence.
Trend Confirmation: Reinforces trading strategies by confirming potential reversals with pivot point detection and divergence analysis.
Behavioural Insight: Offers insights into market dynamics and sentiment by analyzing the depth and duration of AO cycles above and below zero.
The Advanced AO Analysis indicator equips traders with a powerful analytical tool for studying the Awesome Oscillator in-depth, enhancing their ability to spot and act on divergence-based trading opportunities in the cryptocurrency markets.
Enhanced Reversal DetectionScript Description:
The "Enhanced Reversal Detection" indicator is a powerful tool designed to identify potential market reversals across various financial instruments. It incorporates a sophisticated algorithm that analyzes price action along with key technical indicators such as the Relative Strength Index (RSI), Bollinger Bands, and Moving Average (MA).
How to Use:
Adjustable Parameters: The indicator offers a range of adjustable parameters to cater to different trading preferences and market conditions.
RSI Length: Adjusts the length of the RSI calculation to fine-tune sensitivity.
Overbought Level: Sets the threshold for identifying overbought conditions on the RSI scale.
Oversold Level: Sets the threshold for identifying oversold conditions on the RSI scale.
Bollinger Bands Length: Determines the length of the Bollinger Bands calculation.
Bollinger Bands Multiplier: Adjusts the standard deviation multiplier for the Bollinger Bands, influencing band width.
Moving Average Length: Defines the length of the Moving Average calculation to capture trend direction.
Min Bars Between Signals: Sets the minimum number of bars required between consecutive reversal signals.
ADX Length: Adjusts the length of the Average Directional Index (ADX) calculation.
ADX Threshold: Defines the threshold value for ADX, serving as a filter for reversal signals.
Signal Generation: The indicator generates signals for both bullish and bearish reversals based on predefined criteria. A bullish reversal signal is triggered when the closing price exceeds the lower Bollinger Band and RSI falls below the oversold threshold. Conversely, a bearish reversal signal occurs when the closing price falls below the upper Bollinger Band and RSI surpasses the overbought threshold.
Alerts: Traders can opt to receive alerts for bullish and bearish reversal signals, enabling them to stay informed of potential trading opportunities even when away from the platform.
Publication Readiness:
To ensure readiness for publication in the TradingView public library, the script has been meticulously crafted and documented:
The code is extensively commented to provide clear explanations of parameters, calculations, and signal generation logic.
Best coding practices have been followed to enhance readability and maintainability.
Rigorous testing has been conducted to validate the accuracy and reliability of signal generation across various market conditions.
The script adheres to TradingView's guidelines and policies for script publication, ensuring compliance with platform standards and user expectations.
With its comprehensive features and user-friendly design, the "Enhanced Reversal Detection" indicator is poised to become a valuable asset for traders seeking to identify high-probability reversal opportunities in the financial markets.

Bayesian Trend Indicator [ChartPrime]Bayesian Trend Indicator
Overview:
In probability theory and statistics, Bayes' theorem (alternatively Bayes' law or Bayes' rule), named after Thomas Bayes, describes the probability of an event, based on prior knowledge of conditions that might be related to the event.
The "Bayesian Trend Indicator" is a sophisticated technical analysis tool designed to assess the direction of price trends in financial markets. It combines the principles of Bayesian probability theory with moving average analysis to provide traders with a comprehensive understanding of market sentiment and potential trend reversals.
At its core, the indicator utilizes multiple moving averages, including the Exponential Moving Average (EMA), Simple Moving Average (SMA), Double Exponential Moving Average (DEMA), and Volume Weighted Moving Average (VWMA) . These moving averages are calculated based on user-defined parameters such as length and gap length, allowing traders to customize the indicator to suit their trading strategies and preferences.
The indicator begins by calculating the trend for both fast and slow moving averages using a Smoothed Gradient Signal Function. This function assigns a numerical value to each data point based on its relationship with historical data, indicating the strength and direction of the trend.
// Smoothed Gradient Signal Function
sig(float src, gap)=>
ta.ema(source >= src ? 1 :
source >= src ? 0.9 :
source >= src ? 0.8 :
source >= src ? 0.7 :
source >= src ? 0.6 :
source >= src ? 0.5 :
source >= src ? 0.4 :
source >= src ? 0.3 :
source >= src ? 0.2 :
source >= src ? 0.1 :
0, 4)
Next, the indicator calculates prior probabilities using the trend information from the slow moving averages and likelihood probabilities using the trend information from the fast moving averages . These probabilities represent the likelihood of an uptrend or downtrend based on historical data.
// Define prior probabilities using moving averages
prior_up = (ema_trend + sma_trend + dema_trend + vwma_trend) / 4
prior_down = 1 - prior_up
// Define likelihoods using faster moving averages
likelihood_up = (ema_trend_fast + sma_trend_fast + dema_trend_fast + vwma_trend_fast) / 4
likelihood_down = 1 - likelihood_up
Using Bayes' theorem , the indicator then combines the prior and likelihood probabilities to calculate posterior probabilities, which reflect the updated probability of an uptrend or downtrend given the current market conditions. These posterior probabilities serve as a key signal for traders, informing them about the prevailing market sentiment and potential trend reversals.
// Calculate posterior probabilities using Bayes' theorem
posterior_up = prior_up * likelihood_up
/
(prior_up * likelihood_up + prior_down * likelihood_down)
Key Features:
◆ The trend direction:
To visually represent the trend direction , the indicator colors the bars on the chart based on the posterior probabilities. Bars are colored green to indicate an uptrend when the posterior probability is greater than 0.5 (>50%), while bars are colored red to indicate a downtrend when the posterior probability is less than 0.5 (<50%).
◆ Dashboard on the chart
Additionally, the indicator displays a dashboard on the chart , providing traders with detailed information about the probability of an uptrend , as well as the trends for each type of moving average. This dashboard serves as a valuable reference for traders to monitor trend strength and make informed trading decisions.
◆ Probability labels and signals:
Furthermore, the indicator includes probability labels and signals , which are displayed near the corresponding bars on the chart. These labels indicate the posterior probability of a trend, while small diamonds above or below bars indicate crossover or crossunder events when the posterior probability crosses the 0.5 threshold (50%).
The posterior probability of a trend
Crossover or Crossunder events
◆ User Inputs
Source:
Description: Defines the price source for the indicator's calculations. Users can select between different price values like close, open, high, low, etc.
MA's Length:
Description: Sets the length for the moving averages used in the trend calculations. A larger length will smooth out the moving averages, making the indicator less sensitive to short-term fluctuations.
Gap Length Between Fast and Slow MA's:
Description: Determines the difference in lengths between the slow and fast moving averages. A higher gap length will increase the difference, potentially identifying stronger trend signals.
Gap Signals:
Description: Defines the gap used for the smoothed gradient signal function. This parameter affects the sensitivity of the trend signals by setting the number of bars used in the signal calculations.
In summary, the "Bayesian Trend Indicator" is a powerful tool that leverages Bayesian probability theory and moving average analysis to help traders identify trend direction, assess market sentiment, and make informed trading decisions in various financial markets.

FiboSequFiboSequ: Fibonacci Sequence Marking
Leonardo Fibonacci was an Italian mathematician who lived in the 12th century. His real name was Leonardo of Pisa, but he is commonly known as "Fibonacci." Fibonacci is famous for introducing the Hindu-Arabic numeral system to the Western world. This system is the basis of the modern decimal number system we use today.
Fibonacci Sequence
The Fibonacci sequence is a series of numbers that frequently appears in mathematics and nature. The first two numbers in the sequence are 0 and 1, and each subsequent number is the sum of the two preceding numbers.
The sequence is as follows:
0, 1, 1, 2, 3, 5, 8, 13, 21, 34, 55, 89, 144, 233, 377, 610, 987, 1597, 2584, ...
Fibonacci Time Zones:
Fibonacci time zones are used to identify potential turning points in the market at specific time intervals. These time zones correspond to the Fibonacci sequence in terms of consecutive days or weeks.
The Fibonacci sequence has a wide range of applications in both mathematics and nature. Leonardo Fibonacci's work has had a significant impact on the development of modern mathematics and numeral systems. In financial markets, the Fibonacci sequence and ratios are frequently used by technical analysts to predict and analyze market movements.
Description:
Overview:
The FiboSequ indicator marks significant days on a price chart based on the Fibonacci sequence. This can help traders identify potential turning points or areas of interest in the market. The Fibonacci sequence is a series of numbers where each number is the sum of the two preceding ones, often found in nature and financial markets.
Fibonacci Sequence:
The sequence used in this indicator includes: 1, 3, 5, 8, 13, 21, 34, 55, 89, 144, 233, 377, 610, 987, 1597, and 2584.
These numbers represent the days to be marked on the chart, highlighting possible significant market movements.
How It Works:
User Input:
Users can input the starting date (Year, Month, and Day) from which the Fibonacci sequence will begin to be calculated.
This allows flexibility and customization based on the trader's analysis needs.
Calculation:
The starting date is converted into a timestamp in seconds.
For each bar on the chart, the number of days since the starting date is calculated.
The indicator checks if the current day matches any of the Fibonacci sequence days, the previous day, or the next day.
In this indicator, Fibonacci numbers can be displayed on the chart as plus and minus 2 days. For example, for the 145th day, signals start to appear as 143,144 and 145. This is due to dates that sometimes coincide with weekends and public holidays.
Marking the Chart:
When a match is found, a label is placed above the bar indicating the day number from the Fibonacci sequence.
These labels are colored blue with white text for easy visibility.
Usage:
This indicator can be used on any timeframe and market to help identify potential areas where price might react.
It is especially useful for those who employ Fibonacci analysis in their trading strategy.
Example:
If the starting date is January 1, 2020, the indicator will mark significant Fibonacci days (e.g., 1, 3, 5, 8 days, etc.) on the chart from this date onward.
Community Guidelines Compliance:
This indicator adheres to TradingView's Pine Script community guidelines.
It provides customizable user inputs and does not violate any terms of use.
By using the FiboSequ indicator, traders can enhance their technical analysis by incorporating time-based Fibonacci levels, potentially leading to better market timing and decision-making.
Frequently Asked Questions (FAQ)
Q: What is the FiboSequ indicator?
A: The FiboSequ indicator is a technical analysis tool that marks significant days on a price chart based on the Fibonacci sequence. This indicator helps traders identify potential turning points or areas of interest in the market.
Q: What is the Fibonacci sequence and why is it important?
A: The Fibonacci sequence is a series of numbers where each number is the sum of the two preceding ones. The first two numbers are 0 and 1. This sequence frequently appears in nature and financial markets and is used in technical analysis to identify important support and resistance levels.
Q: How do the Fibonacci time zones in the indicator work?
A: Fibonacci time zones are used to identify potential market turning points at specific time intervals. The indicator calculates days based on the Fibonacci sequence (e.g., 1, 3, 5, 8 days, etc.) from the starting date and marks them on the chart.
Q: How can users set the starting date?
A: Users can input the starting date by specifying the year, month, and day. This sets the date from which the indicator begins its calculations, providing flexibility for user analysis.
Q: What do the labels in the indicator represent?
A: The labels mark specific days in the Fibonacci sequence. For example, 1st day, 3rd day, 5th day, etc. These labels are displayed in blue with white text for easy visibility.
Q: Which timeframes can I use the FiboSequ indicator on?
A: The FiboSequ indicator can be used on any timeframe. This includes daily, weekly, or monthly charts, as well as shorter timeframes.
Q: Which markets can the FiboSequ indicator be used in?
A: The FiboSequ indicator can be used in various financial markets, including stocks, forex, cryptocurrencies, commodities, and more.
Q: How can I achieve better market timing with the FiboSequ indicator?
A: The FiboSequ indicator helps identify potential market turning points using time-based Fibonacci levels. This can lead to better market timing and more informed trading decisions for traders.
-Please feel free to write your valuable comments and opinions. I attach importance to your valuable opinions so that I can improve myself.

Breakouts with Tests & Retests [LuxAlgo]The Breakouts Tests & Retests indicator highlights tests and retests of levels constructed from detected swing points. A swing area of interest switches colors when a breakout occurs.
Users can control the sensitivity of the swing point detection and the width of the swing areas.
🔶 USAGE
When a Swing point is detected, an area of interest is drawn, colored green for a bullish swing and red when bearish.
A test is confirmed when the opening price is situated in the area of interest, and the closing price is above or below the area, depending on whether it is a bullish or bearish swing. Tests are highlighted with a solid-colored triangle.
A breakout is confirmed when the price closes in the opposite position, below or above the area, in which case the area will switch colors.
If the opening price is located within the area and the closing price closes outside the area, in the same direction as the breakout, this is considered a retest . Retests are highlighted with a hollow-colored triangle.
Note that tests/retests do not act on wicks. The main factor is that the opening price is in the area of interest, while the closing price is outside.
🔹 Area Of Interest Width
The user can adjust the width of the swing areas. Changing the " Width " is a fast and easy way to find different areas of interest.
A higher "Multiple" setting would return a wider area, allowing price to develop within it for a longer period of time and potentially provide later test signals.
When a swing area is broken, a higher "Width" setting can make it more complicated for the price to break it again, allowing a swing area to remain valid for a longer period of time thus potentially providing more retest signals.
🔶 DETAILS
Generally, only one bullish/bearish pattern can be active at a time. This means that no more than 1 bullish or bearish area will be active.
The " Display " settings, however, can help control how areas of different types are displayed.
Bullish AND Bearish: Both, bullish and bearish patterns can be drawn at the same time
Bullish OR Bearish: Only 1 bullish or 1 bearish pattern is drawn at a time
Bullish: Only bullish patterns
Bearish: Only bearish patterns
🔹 Test/Retest Labels
The user can adjust the settings so only the latest test/retest label is shown or set a minimum number of bars until the next test/retest can be drawn.
🔹 Maximum Bars
Users can set a limit of bars for when there is no test/retest in that period; the area of interest won't be updated anymore and will be available and ready for the next Swing.
An option for pulling the area back to the last retest is included.
🔶 SETTINGS
Display: Determines which swing areas are displayed by the indicator. See the "DETAILS" section for more information
Multiple: Adjusts the width of the areas of interest
Maximum Bars: Limit of bars for when there is no test/retest
Display Test/Retest Labels: Show all labels or just the last test/retest label associated with a swing area
Minimum Bars: Minimum bars required for a subsequent test/retest label are allowed to be displayed
Set Back To Last Retest: When after "Maximum Bars" no test/retest is found, place the right side of the area at the last test/retest
🔹 Swings
Left: x amount of wicks on the left of a potential Swing need to be higher/lower for a Swing to be confirmed.
Right: The number of wicks on the right of a potential swing needs to be higher/lower for a Swing to be confirmed.
🔹 Style
Bullish: color for test period (before a breakout) / retest period (after a breakout)
Bearish: color for test period (before a breakout) / retest period (after a breakout)
Label Size

MetaFOX DCA (ASAP-RSI-BB%B-TV)Welcome To ' MetaFOX DCA (ASAP-RSI-BB%B-TV) ' Indicator.
This is not a Buy/Sell signals indicator, this is an indicator to help you create your own strategy using a variety of technical analyzing options within the indicator settings with the ability to do DCA (Dollar Cost Average) with up to 100 safety orders.
It is important when backtesting to get a real results, but this is impossible, especially when the time frame is large, because we don't know the real price action inside each candle, as we don't know whether the price reached the high or low first. but what I can say is that I present to you a backtest results in the worst possible case, meaning that if the same chart is repeated during the next period and you traded for the same period and with the same settings, the real results will be either identical to the results in the indicator or better (not worst). There will be no other factors except the slippage in the price when executing orders in the real trading, So I created a feature for that to increase the accuracy rate of the results. For more information, read this description.
Below I will explain all the properties and settings of the indicator:
A) 'Buy Strategies' Section: Your choices of strategies to Start a new trade: (All the conditions works as (And) not (OR), You have to choose one at least and you can choose more than one).
- 'ASAP (New Candle)': Start a trade as soon as possible at the opening of a new candle after exiting the previous trade.
- 'RSI': Using RSI as a technical analysis condition to start a trade.
- 'BB %B': Using BB %B as a technical analysis condition to start a trade.
- 'TV': Using tradingview crypto screener as a technical analysis condition to start a trade.
B) 'Exit Strategies' Section: Your choices of strategies to Exit the trades: (All the conditions works as (And) not (OR), You can choose more than one, But if you don't want to use any of them you have to activate the 'Use TP:' at least).
- 'ASAP (New Candle)': Exit a trade as soon as possible at the opening of a new candle after opening the previous trade.
- 'RSI': Using RSI as a technical analysis condition to exit a trade.
- 'BB %B': Using BB %B as a technical analysis condition to exit a trade.
- 'TV': Using tradingview crypto screener as a technical analysis condition to exit a trade.
C) 'Main Settings' Section:
- 'Trading Fees %': The Exchange trading fees in percentage (trading Commission).
- 'Entry Price Slippage %': Since real trading differs from backtest calculations, while in backtest results are calculated based on the open price of the candle, but in real trading there is a slippage from the open price of the candle resulting from the supply and demand in the real time trading, so this feature is to determine the slippage Which you think it is appropriate, then the entry prices of the trades will calculated higher than the open price of the start candle by the percentage of slippage that you set. If you don't want to calculate any slippage, just set it to zero, but I don't recommend that if you want the most realistic results.
Note: If (open price + slippage) is higher than the high of the candle then don't worry, I've kept this in consideration.
- 'Use SL': Activate to use stop loss percentage.
- 'SL %': Stop loss percentage.
- 'SL settings options box':
'SL From Base Price': Calculate the SL from the base order price (from the trade first entry price).
'SL From Avg. Price': Calculate the SL from the average price in case you use safety orders.
'SL From Last SO.': Calculate the SL from the last (lowest) safety order deviation.
ex: If you choose 'SL From Avg. Price' and SL% is 5, then the SL will be lower than the average price by 5% (in this case your SL will be dynamic until the price reaches all the safety orders unlike the other two SL options).
Note: This indicator programmed to be compatible with '3COMMAS' platform, but I added more options that came to my mind.
'3COMMAS' DCA bots uses 'SL From Base Price'.
- 'Use TP': Activate to use take profit percentage.
- 'TP %': Take profit percentage.
- 'Pure TP,SL': This feature was created due to the differences in the method of calculations between API tools trading platforms:
If the feature is not activated and (for example) the TP is 5%, this means that the price must move upward by only 5%, but you will not achieve a net profit of 5% due to the trading fees. but If the feature is activated, this means that you will get a net profit of 5%, and this means that the price must move upward by (5% for the TP + the equivalent of trading fees). The same idea is applied to the SL.
Note: '3COMMAS' DCA bots uses activated 'Pure TP,SL'.
- 'SO. Price Deviation %': Determines the decline percentage for the first safety order from the trade start entry price.
- 'SO. Step Scale': Determines the deviation multiplier for the safety orders.
Note: I'm using the same method of calculations for SO. (safety orders) levels that '3COMMAS' platform is using. If there is any difference between the '3COMMAS' calculations and the platform that you are using, please let me know.
'3COMMAS' DCA bots minimum 'SO. Price Deviation %' is (0.21)
'3COMMAS' DCA bots minimum 'SO. Step Scale' is (0.1)
- 'SO. Volume Scale': Determines the base order size multiplier for the safety orders sizes.
ex: If you used 10$ to buy at the trade start (base order size) and your 'SO. Volume Scale' is 2, then the 1st SO. size will be 20, the 2nd SO. size will be 40 and so on.
- 'SO. Count': Determines the number of safety orders that you want. If you want to trade without safety orders set it to zero.
'3COMMAS' DCA bots minimum 'SO. Volume Scale' is (0.1)
- 'Exchange Min. Size': The exchange minimum size per trade, It's important to prevent you from setting the base order Size less than the exchange limit. It's also important for the backtest results calculations.
ex: If you setup your strategy settings and it led to a loss to the point that you can't trade any more due to insufficient funds and your base order size share from the strategy becomes less than the exchange minimum trade size, then the indicator will show you a warning and will show you the point where you stopped the trading (It works in compatible with the initial capital). I recommend to set it a little bit higher than the real exchange minimum trade size especially if you trade without safety orders to not stuck in the trade if you hit the stop loss
- 'BO. Size': The base order size (funds you use at the trade entry).
- 'Initial Capital': The total funds allocated for trading using your strategy settings, It can be more than what is required in the strategy to cover the deficit in case of a loss, but it should not exceed the funds that you actually have for trading using this strategy settings, It's important to prevent you from setting up a strategy which requires funds more than what you have. It's also has other important benefits (refer to 'Exchange Min. Size' for more information).
- 'Accumulative Results': This feature is also called re-invest profits & risk reduction. If it's not activated then you will use the same funds size in each new trade whether you are in profit or loss till the (initial capitals + net results) turns insufficient. If it's activated then you will reuse your profits and losses in each new trade.
ex: The feature is active and your first trade ended with a net profit of 1000$, the next trade will add the 1000$ to the trade funds size and it will be distributed as a percentage to the BO. & SO.s according to your strategy settings. The same idea in case of a loss, the trade funds size will be reduced.
D) 'RSI Strategy' Section:
- 'Buy': RSI technical condition to start a trade. Has no effect if you don't choose 'RSI' option in 'Buy Strategies'.
- 'Exit': RSI technical condition to exit a trade. Has no effect if you don't choose 'RSI' option in 'Exit Strategies'.
E) 'TV Strategy' Section:
- 'Buy': TradingView Crypto Screener technical condition to start a trade. Has no effect if you don't choose 'TV' option in 'Buy Strategies'.
- 'Exit': TradingView Crypto Screener technical condition to exit a trade. Has no effect if you don't choose 'TV' option in 'Exit Strategies'.
F) 'BB %B Strategy' Section:
- 'Buy': BB %B technical condition to start a trade. Has no effect if you don't choose 'BB %B' option in 'Buy Strategies'.
- 'Exit': BB %B technical condition to exit a trade. Has no effect if you don't choose 'BB %B' option in 'Exit Strategies'.
G) 'Plot' Section:
- 'Signals': Plots buy and exit signals.
- 'BO': Plots the trade entry price (base order price).
- 'AVG': Plots the trade average price.
- 'AVG options box': Your choice to plot the trade average price type:
'Avg. With Fees': The trade average price including the trading fees, If you exit the trade at this price the trade net profit will be 0.00
'Avg. Without Fees': The trade average price but not including the trading fees, If you exit the trade at this price the trade net profit will be a loss equivalent to the trading fees.
- 'TP': Plots the trade take profit price.
- 'SL': Plots the trade stop loss price.
- 'Last SO': Plots the trade last safety order that the price reached.
- 'Exit Price': Plots a mark on the trade exit price, It plots in 3 colors as below:
Red (Default): Trade exit at a loss.
Green (Default): Trade exit at a profit.
Yellow (Default): Trade exit at a profit but this is a special case where we have to calculate the profits before reaching the safety orders (if any) on that candle (compatible with the idea of getting strategy results at the worst case).
- 'Result Table': Plots your strategy result table. The net profit percentage shown is a percentage of the 'initial capital'.
- 'TA Values': Plots your used strategies Technical analysis values. (Green cells means valid condition).
- 'Help Table': Plots a table to help you discover 100 safety orders with its deviations and the total funds needed for your strategy settings. Deviations shown in red is impossible to use because its price is <= 0.00
- 'Portfolio Chart': Plots your Portfolio status during the entire trading period in addition to the highest and lowest level reached. It's important when evaluating any strategy not only to look at the final result, but also to look at the change in results over the entire trading period. Perhaps the results were worryingly negative at some point before they rose again and made a profit. This feature helps you to see the whole picture.
- 'Welcome Message': Plots a welcome message and showing you the idea behind this indicator.
- 'Green Net Profit %': It plots the 'Net Profit %' in the result table in green color if the result is equal to or above the value that you entered.
- 'Green Win Rate %': It plots the 'Win Rate %' in the result table in green color if the result is equal to or above the value that you entered.
- 'User Notes Area': An empty text area, Feel free to use this area to write your notes so you don't forget them.
The indicator will take care of you. In some cases, warning messages will appear for you. Read them carefully, as they mean that you have done an illogical error in the indicator settings. Also, the indicator will sometimes stop working for the same reason mentioned above. If that happens then click on the red (!) next to the indicator name and read the message to find out what illogical error you have done.
Please enjoy the indicator and let me know your thoughts in the comments below.

Higher Timeframe High & Low [ChartPrime]The Higher Timeframe High & Low Indicator plots key levels (high, low, and average price) from a higher timeframe onto the current chart, aiding traders in identifying significant support and resistance zones.
The indicator also detects and labels breakout points and can display trend directions based on these higher timeframe levels breakout points.
Key Features:
◆ Higher Timeframe Levels:
Plots the high, low, and average price from a selected higher timeframe onto the current chart.
Extends these levels into the future for better visualization.
◆ Breakout Detection:
Identifies and labels breakouts above the higher timeframe high or below the higher timeframe low.
Breakout points are clearly marked with labels indicating "High Break" or "Low Break" with timeframe mark.
If the following break out type is the same that previous, it does not marked by labels, but still marked by bar color.
◆ Trend Visualization:
Optionally displays trend direction by changing bar colors and line styles based on breakout conditions.
Trend indication helps in identifying bullish or bearish market conditions.
◆ Support and Resistance Indication:
Marks support and resistance points with '◆' symbols when the current timeframe's high or low interacts with the higher timeframe's levels.
◆ Period separation:
Background color changes to indicate period separation if enabled.
◆ Inputs:
Extension to the right of High and Low: Sets the number of bars to extend the high and low lines into the future.
Timeframe: Selects the higher timeframe (e.g., Daily) to use for plotting high and low levels.
Period Separator: Toggles the visual separator for periods.
Show Trend?: Toggles the trend visualization, changing bar colors and plot styles based on breakouts.
Show Breakout Labels?: Toggles the Breakout Labels visualization.
Indicator Logic:
Historical vs. Real-Time Bars: Adjusts values based on whether the bar is historical or real-time to ensure accurate plotting.
High and Low Prices: Retrieves the high and low prices from the selected higher timeframe.
Breakout Conditions: Determines if the current price has crossed above the higher timeframe high (high break) or below the higher timeframe low (low break).
Color and Trend Logic: Adjusts colors and checks for breakouts to avoid multiple labels and indicate trend direction.
Usage Notes:
This indicator is ideal for traders looking to integrate multi-timeframe analysis into their strategy.
The higher timeframe levels act as significant support and resistance zones, helping traders identify potential reversal or continuation points.
The breakout labels and trend visualization provide additional context for trading decisions, indicating when the price has breached key levels and is likely to continue in that direction.
This indicator enhances chart analysis by providing clear, visual cues from higher timeframe data, helping traders make more informed decisions based on a broader market perspective.

Advanced Stochastic [CryptoSea]The Advanced Stochastic Indicator is a sophisticated tool designed to enhance market analysis through detailed stochastic calculations. This tool is built for traders who seek to identify market divergences and pivot points with higher accuracy.
Key Features
Multi-Layer Stochastic Analysis: Tracks both standard and smoothed stochastic values to provide a granular view of market momentum.
Divergence Detection: Automatically detects both regular and hidden bullish and bearish divergences, offering critical insights into potential market reversals.
Adaptive Oscillator Display: Features customizable display options for the stochastic oscillator, allowing traders to view data in Default, Histogram, or Both modes.
Customizable Lookback Periods: Users can set specific lookback periods for divergence analysis and stochastic calculations, tailoring the tool to fit various trading strategies.
In the example below, there is a bearish divergence above 0. You would first want the stoch to break below the 0 level as a show of strength, this would be an aggressive entry, a higher probability option would be to wait for the stoch to retest and reject from 0 which is what we have a few candles later.
How it Works
Stochastic Calculation: Computes the stochastic oscillator by smoothing the %K line over a user-defined period, then applying a second smoothing for the %D line.
Pivot Point Analysis: Utilizes advanced algorithms to find low and high pivot points based on the oscillator values, crucial for spotting trend reversals.
Colour-Coded Divergence Alerts: Utilizes color codes to highlight divergence signals directly on the chart, aiding in quick visual analysis.
Responsive Threshold Settings: Includes options to adjust the sensitivity of divergence detection, ensuring that only significant divergences are highlighted.
In the example below, we have 2 divergence signals. The first a bullish one which fails to break above 0. The second signal is given above 0 so you would want a retest and a show of strength when the stoch returns to 0 but it fails to hold. Both of these divergence signals are invalidated.
Application
Strategic Decision-Making: Assists traders in making informed decisions by providing detailed analysis of stochastic movements and divergence.
Trend Confirmation: Reinforces trading strategies by confirming potential reversals with pivot point detection and divergence analysis.
Customized Analysis: Adapts to various trading styles with extensive input settings that control the display and sensitivity of oscillator data.
The Advanced Stochastic Indicator by is an invaluable addition to a trader's toolkit, offering depth and precision in market trend analysis to navigate complex market conditions effectively.

MTF Williams Vix Market Bottoms [CryptoSea]MTF Williams Vix Fix Indicator is a dynamic tool tailored for traders looking to capture market extremes with high precision. This multi-timeframe indicator leverages the concept of the Williams Vix Fix to spot potential reversals before they occur.
Key Features
Multi-Timeframe Analysis: Provides simultaneous visibility across multiple timeframes, enabling traders to assess market conditions comprehensively from a single chart.
Advanced Volatility Detection: Utilizes a modified Vix Fix formula to highlight extreme price deviations, which often precede significant market reversals.
Customizable Settings: Offers extensive input options to tweak the lookback periods, percentile thresholds, and visibility settings, aligning with various trading strategies.
Visual Band Indicators: Features upper bands and range highs that signal potential overbought and oversold conditions, enhancing trading decision-making.
Below, you can see how the indicator performs across different timeframes, providing valuable insights into market behavior.
How it Works
Vix Fix Calculation: Determines the worst-case 'panic' sell-offs in price as a percentage of the high, capturing the emotional extremes of the market.
Statistical Bands: Employs Bollinger bands over the Vix Fix values to define normal and extreme volatility conditions.
Color-Coded Indicators: Uses color differentiation to instantly highlight when readings surpass critical upper band or range high thresholds, signaling key trading opportunities.
For instance, in the analysis provided below, notice how the indicator flags significant market moves, allowing traders to anticipate potential entry or exit points.
Application
Risk Management: Aids in identifying extreme market conditions where prices may revert, helping in effective position sizing and risk management.
Strategic Planning: Enhances strategic trading plans by identifying not only when but also where market extremes may occur, considering multiple timeframes.
Customization: Adapts seamlessly to different market environments with adjustable settings for volatility thresholds and visual display preferences.
The MTF Williams Vix Fix Indicator by is an essential tool for traders aiming to leverage market volatility for optimal entry and exit, ensuring they are well-equipped to handle market extremes with confidence.

Turbo Oscillator [RunRox]Introducing Turbo Oscillator by RunRox, our new indicator that combines a multitude of useful and unique features, which we will detail in this post.
List of Advanced Technologies:
Real-Time Divergences: Detects discrepancies between price movements and oscillator indicators to forecast potential price reversals.
Real-Time Hidden Divergences: We identify hidden divergences in real-time. These are not the standard type of divergences; they are opposite to regular divergences, providing unique insights into potential market movements.
Overbought and Oversold Zones: Identifies areas where the market is potentially overextended, suggesting possible entry and exit points.
Signal Line: Indicates the market direction, helping traders to quickly understand current trends.
Money Flow Histogram: Shows the flow of money into and out of the market, providing insights into buying and selling pressure.
Predicted Reversal Zones: Pinpoints areas where the market might experience reversals, aiding in strategic planning and risk management. These zones also serve as potential areas for taking profits, enhancing their utility for exit strategy planning.
Customizable Alerts: You can flexibly set up alerts for any events detected by our indicator, ensuring you stay informed about critical market movements.
To begin with, I would like to describe the difference between classic divergences and hidden divergences.
As you can see, these are opposite situations. Our oscillator identifies both types of divergences and displays them in real-time.
Divergences can serve as points where the price might reverse in the opposite direction, making both classic and hidden divergences powerful tools for spotting reversal points. I'll show a few examples of how divergences are used in our oscillator.
Classic Divergences - which we identify in real-time. As you can see, the price often reacts strongly to the formation of these divergences, frequently changing its direction.
Hidden Divergences - we also observe frequent movement in the opposite direction on the chart. The advantage of our indicator is that we show divergences in real-time without delays, allowing you to react immediately to trend changes.
Overbought and Oversold Zones - These zones allow you to see trend changes when the price is clearly overbought or oversold. When the color changes from a contrasting shade to a neutral one, you can observe the trend shift. The lines work by combining the positivity/negativity of the histogram, the positivity/negativity of the signal line, and the direction of the signal line (red/green). This sophisticated interaction provides precise insights into market conditions, making it an invaluable tool for traders.
Signal Line - This provides insights into trend changes and price reversals. The points on the line better indicate the beginning of a trend shift. These points can vary in size, offering a clearer understanding of the strength of the emerging trend. This feature works in combination with RSI, Stochastic, and MFI. RSI and MFI are top-tier indicators, while Stochastic adds responsiveness and sensitivity to trend changes, ensuring you capture every market movement accurately and promptly.
Money Flow Histogram - As shown in the example, our histogram displays the divergence between money flow and the actual price. You can see that while the price is rising, the money flow is decreasing, indicating insufficient demand for the asset and an imminent trend change. This feature uses MFI with an extended period, providing a more comprehensive and accurate analysis of market conditions. The extended period enhances the reliability of the Money Flow Index, making it an essential tool for identifying subtle shifts in market dynamics.
Predicted Reversal Zones - We automatically identify potential price reversal zones and display them above our overbought and oversold zones. In cases of strong overbought or oversold conditions, we detect potential price pullbacks and mark the beginning of a trend change. This helps you better identify trend shifts. We recommend considering these zones as potential take profit points for your trades.
Customizable Alerts - Our flexible alert system allows you to receive notifications only for the events you are interested in. These can include:
1. Classic Divergences
2. Hidden Divergences
3. Overbought or Oversold conditions on the status line
4. Strong Overbought or Oversold conditions on the status line
5. Signals from the signal line
6. Reversal zones in any direction
Our oscillator is a unique indicator that provides a comprehensive understanding of price movements. It can be used as a standalone tool for analyzing price action.
Here are a few examples of using our Oscillator in practice:
In the example above, you can see three conditions that have formed for a potential trade:
1. Clear overbought condition with a formed reversal point.
2. Decreasing Money Flow Index diverging from the rising price.
3. Formed classic divergence.
The entry point could be the formed divergence, while the exit point could be the overbought condition at the bottom of the oscillator along with the reversal points.
Here's another example of using hidden divergence, where you can see three conditions for a potential trade:
1. Overbought zone
2. Formed hidden divergence
3. Start of bearish movement indicated by the signal line
You can enter the trade either when the hidden divergence forms or wait for confirmation of the trend change by the signal line and enter the trade when the corresponding signal forms on the signal line. The exit point could be the opposite reversal point or the formation of a new hidden divergence.
We have demonstrated a few examples of how you can use our indicator, but we are confident that you will find many more applications in your own strategies.
Oscillator offers a variety of customizable parameters to tailor the indicator to your trading preferences. Here’s what our settings include:
Signal Line
Turn On/Off: Enable or disable the signal line.
Length: Set the length period for the signal line calculation.
Smooth: Adjust the smoothing level of the signal line for more accurate display.
Histogram
Turn On/Off: Enable or disable the histogram.
Length: Set the length period for the histogram calculation.
Smooth: Adjust the smoothing level of the histogram.
Other
Show Divergence Line: Display divergence lines on the chart.
Show Hidden Divergence: Display hidden divergences.
Show Status Line: Show the status line indicating overbought or oversold conditions.
Show TP Signal: Display signals for take profit.
Show Reversal Points: Display potential trend reversal points.
Delete Broken Divergence Lines: Remove broken divergence lines from the chart.
Alerts Customization
Signal Line Bull/Bear: Set alerts for bullish or bearish signals from the signal line.
TP Bull/Bear: Set alerts for take profit signals.
Status Bull/Bear: Set alerts for bullish or bearish status conditions.
Status Bull+/Bear+: Set enhanced alerts for stronger bullish or bearish status conditions.
Divergence Bull/Bear: Set alerts for bullish or bearish divergences.
Hidden Divergence Bull/Bear: Set alerts for hidden bullish or bearish divergences.
With these comprehensive settings, you can fine-tune the Oscillator to perfectly fit your trading strategy and preferences.
Our indicator utilizes technologies such as RSI, Stochastic, and Money Flow Index, with numerous enhancements from our team. It includes exclusive features such as real-time detection of hidden and classic divergences, identification of reversal points using our unique methodology, and much more.
Disclaimer:
While we consider our Turbo Oscillator to be an excellent tool, it is important to understand that past performance is not indicative of future results. We recommend approaching market analysis comprehensively, using a combination of tools and techniques to make well-informed trading decisions. Always consider the full range of market data and risks when using any trading indicator.

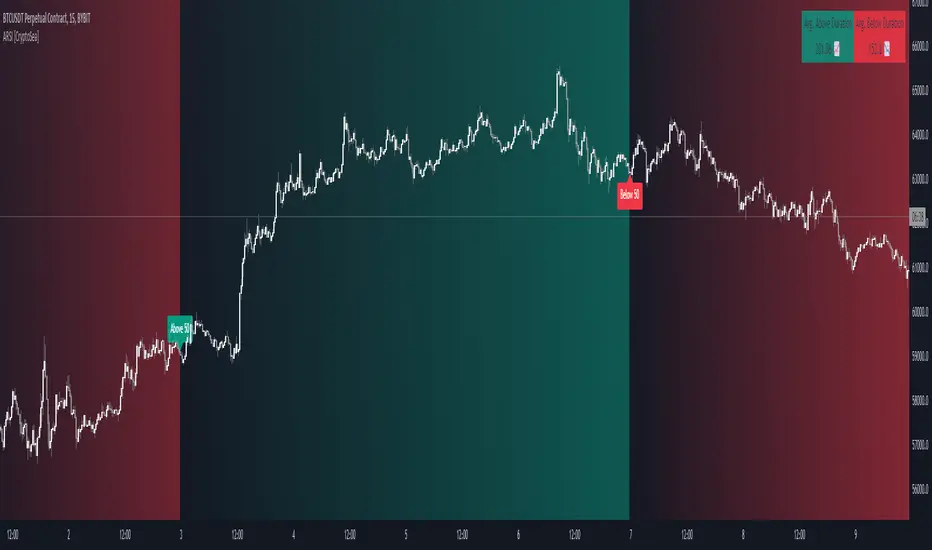
Advanced RSI [CryptoSea]The Advanced RSI Duration (ARSI) is a unique tool crafted to deepen your market insights by focusing on the duration the Relative Strength Index (RSI) spends above or below key thresholds. This innovative approach is designed to help traders anticipate potential market reversals by observing sustained overbought and oversold conditions.
Core Feature
Duration Monitoring ARSI's standout feature is its ability to track how long the RSI remains in overbought (>70) or oversold (<30) conditions. By quantifying these durations, traders can gauge the strength of current market trends and the likelihood of reversals.
Enhanced Functionality
Multi-Timeframe Flexibility : Analyze the RSI duration from any selected timeframe on your current chart, offering a layered view of market dynamics.
Customizable Alerts : Receive notifications when the RSI maintains its position above or below set levels for an extended period, signaling sustained market pressure.
Visual Customization : Adjust the visual elements, including colors for overbought and oversold durations, to match your analytical style and preferences.
Label Management : Control the frequency of labels marking RSI threshold crossings, ensuring clarity and focus on significant market events.
Settings Overview
RSI Timeframe & Length : Tailor the RSI calculation to fit your analysis, choosing from various timeframes and period lengths.
Threshold Levels : Define what you consider overbought and oversold conditions with customizable upper and lower RSI levels.
Duration Alert Threshold : Set a specific bar count for how long the RSI should remain beyond these thresholds to trigger an alert.
Visualization Options : Choose distinct colors for durations above and below thresholds, and adjust label visibility to suit your charting approach.
Application & Strategy
Use ARSI to identify potential turning points in the market
Trend Exhaustion : Extended periods in overbought or oversold territories may indicate a strong trend but also warn of possible exhaustion and impending reversals.
Comparative Analysis : By evaluating the current duration against historical averages, traders can assess the relative strength of ongoing market conditions.
Strategic Entries/Exits : Utilize duration insights to refine entry and exit points, capitalizing on the predictive nature of prolonged RSI levels.
Alert Conditions
The Advanced RSI (ARSI) offers critical alert mechanisms to aid traders in identifying prolonged market conditions that could lead to actionable trading opportunities. These conditions are designed to alert traders when the RSI remains at extremes longer than typical durations, signaling sustained market behaviors.
Above Upper Level Alert: This alert is triggered when the RSI sustains above the upper threshold (usually 70) for more than the configured duration, indicating strong bullish momentum or potential overbought conditions.
Below Lower Level Alert: Similarly, this alert is activated when the RSI stays below the lower threshold (commonly 30) for an extended period, suggesting significant bearish momentum or potential oversold conditions.
These alerts enable traders to respond swiftly to extend market conditions, enhancing their strategy by providing timely insights into potential trend reversals or continuations.
The Advanced RSI Duration Analysis empowers traders with a nuanced understanding of market states, beyond mere RSI values. It highlights the significance of how long markets remain in extreme conditions, offering a predictive edge in anticipating reversals. Whether you're strategizing entries or preparing for shifts in market momentum, ARSI is your companion for informed trading decisions.
Normalised T3 Oscillator [BackQuant]Normalised T3 Oscillator
The Normalised T3 Oscillator is an technical indicator designed to provide traders with a refined measure of market momentum by normalizing the T3 Moving Average. This tool was developed to enhance trading decisions by smoothing price data and reducing market noise, allowing for clearer trend recognition and potential signal generation. Below is a detailed breakdown of the Normalised T3 Oscillator, its methodology, and its application in trading scenarios.
1. Conceptual Foundation and Definition of T3
The T3 Moving Average, originally proposed by Tim Tillson, is renowned for its smoothness and responsiveness, achieved through a combination of multiple Exponential Moving Averages and a volume factor. The Normalised T3 Oscillator extends this concept by normalizing these values to oscillate around a central zero line, which aids in highlighting overbought and oversold conditions.
2. Normalization Process
Normalization in this context refers to the adjustment of the T3 values to ensure that the oscillator provides a standard range of output. This is accomplished by calculating the lowest and highest values of the T3 over a user-defined period and scaling the output between -0.5 to +0.5. This process not only aids in standardizing the indicator across different securities and time frames but also enhances comparative analysis.
3. Integration of the Oscillator and Moving Average
A unique feature of the Normalised T3 Oscillator is the inclusion of a secondary smoothing mechanism via a moving average of the oscillator itself, selectable from various types such as SMA, EMA, and more. This moving average acts as a signal line, providing potential buy or sell triggers when the oscillator crosses this line, thus offering dual layers of analysis—momentum and trend confirmation.
4. Visualization and User Interaction
The indicator is designed with user interaction in mind, featuring customizable parameters such as the length of the T3, normalization period, and type of moving average used for signals. Additionally, the oscillator is plotted with a color-coded scheme that visually represents different strength levels of the market conditions, enhancing readability and quick decision-making.
5. Practical Applications and Strategy Integration
Traders can leverage the Normalised T3 Oscillator in various trading strategies, including trend following, counter-trend plays, and as a component of a broader trading system. It is particularly useful in identifying turning points in the market or confirming ongoing trends. The clear visualization and customizable nature of the oscillator facilitate its adaptation to different trading styles and market environments.
6. Advanced Features and Customization
Further enhancing its utility, the indicator includes options such as painting candles according to the trend, showing static levels for quick reference, and alerts for crossover and crossunder events, which can be integrated into automated trading systems. These features allow for a high degree of personalization, enabling traders to mold the tool according to their specific trading preferences and risk management requirements.
7. Theoretical Justification and Empirical Usage
The use of the T3 smoothing mechanism combined with normalization is theoretically sound, aiming to reduce lag and false signals often associated with traditional moving averages. The practical effectiveness of the Normalised T3 Oscillator should be validated through rigorous backtesting and adjustment of parameters to match historical market conditions and volatility.
8. Conclusion and Utility in Market Analysis
Overall, the Normalised T3 Oscillator by BackQuant stands as a sophisticated tool for market analysis, providing traders with a dynamic and adaptable approach to gauging market momentum. Its development is rooted in the understanding of technical nuances and the demand for a more stable, responsive, and customizable trading indicator.
Thus following all of the key points here are some sample backtests on the 1D Chart
Disclaimer: Backtests are based off past results, and are not indicative of the future.
INDEX:BTCUSD
INDEX:ETHUSD
BINANCE:SOLUSD

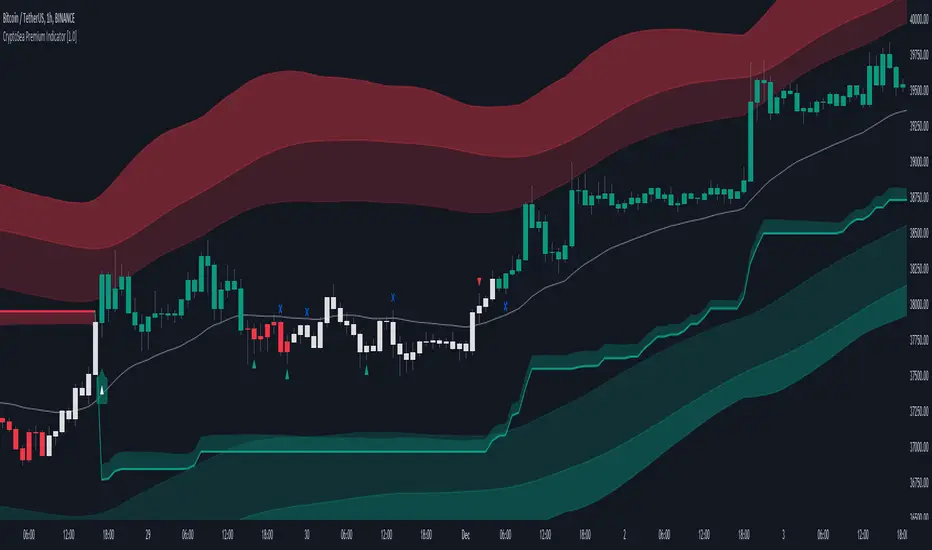
CryptoSea Premium IndicatorCryptoSea Premium Indicator: Enhanced Trading Precision through Advanced Integration
The CryptoSea Premium Indicator is designed to equip traders with a sophisticated tool that synthesizes traditional and modern analytical methods. By integrating proven technical tools with custom enhancements, it aims to provide a deeper, more actionable insight into market dynamics, enhancing the analysis and decision-making process for traders.
Integration and Unique Features:
Support and Resistance Dynamics: Leveraging a blend of standard deviation and moving averages akin to the methodology of Bollinger Bands, this feature dynamically identifies potential market pivot points. It calculates these points based on historical price volatility, which serves as a probabilistic guide to potential price movements, rather than a definitive prediction.
Trend Reversals and Continuations: This function integrates the Relative Strength Index (RSI) with a custom-tailored trend filter that employs shorter cycle moving averages to refine the traditional use of RSI. This enhancement is designed to pinpoint more accurate entry and exit points during trend phases by filtering out market noise and focusing on significant movements, though it does not ensure the avoidance of all false signals.
Smart Trail Closure and New Trends: Utilizing the Average True Range (ATR), this advanced feature dynamically adjusts stop-loss settings according to changes in market volatility. This adaptation seeks to better align stop-loss orders with current market realities, helping to protect against sudden market shifts while allowing traders to capitalize on new trends as they emerge.
Ranging Signals: By employing dual moving averages that calculate the upper and lower bounds of price movements, this feature refines the approach to range-bound trading. It uses statistical measures to adjust these bands in real-time based on the latest market data, enhancing traders' ability to make informed decisions during lateral market movements.
Dynamic Candles: This feature colors candles based on a complex algorithm that assesses immediate price action within the context of longer-term trends. This visual tool aims to simplify market sentiment analysis by providing intuitive color-coded feedback on the prevailing market conditions, thereby assisting traders in quickly assessing the market environment.
Scalping Signals: Generated by a high-frequency trading algorithm that scrutinizes short-term price fluctuations, these signals are designed to aid traders in making swift, informed trading decisions in fast-paced market conditions. They optimize the identification of micro-trends and potential reversal points essential for scalping strategies, though they do not guarantee success in every trade.
Originality and Practical Application:
Each component of the CryptoSea Premium Indicator is carefully selected and integrated to offer a tool that enhances more than the sum of its parts. This integration provides a comprehensive and nuanced view of the market, aiding traders in navigating complex market dynamics more effectively than traditional, single-function indicators.
Disclaimer and Usage Tips:
Trading involves risks. The CryptoSea Premium Indicator should be used as one of several tools in a comprehensive trading strategy. It is intended to supplement, not replace, thorough market analysis and personal due diligence. Past performance is not indicative of future results, and no claims are made regarding the guaranteed accuracy of provided signals.
Candlestick Reversal and Trend Signals [AlgoAlpha]🚀 Unleash your charting capabilities with the Candlestick Reversal and Trend Signals indicator by AlgoAlpha, your go-to tool for spotting pivotal market movements! This script enhances your trading experience by identifying key candlestick patterns and trend changes, perfect for traders aiming for precision in their technical analysis.
🛠 Key Features:
- 🔄 Multi-Timeframe Analysis : Leverages a timeframe multiplier to analyze levels on higher timeframes, enhancing the depth and applicability of insights.
- 🧩 Diverse Pattern Detection : Capable of detecting a wide array of patterns including Bull/Bear Engulfings, Dojis, Haramis, Piercing Lines, Dark Cloud Covers, and Morning/Evening Stars, each contributing to a robust trading strategy.
- 🔍 Dynamic Trend Filters : Utilizes three exponential moving averages (EMAs) and volume filters to decisively confirm trend directions and strength, providing a clearer picture of market dynamics.
- ⚙️ Customizable Settings : Features adjustable settings for filter period, signal thresholds, and appearance, allowing for a tailored analysis experience to fit individual trading styles.
- 📉 Swing Levels Identification : Marks significant high and low swing points on the chart, highlighting potential pivot points and trend reversals for strategic trading decisions.
📈 Quick Guide to Using the Candlestick Reversal and Trend Signals Indicator
1. 🛠 Add the Indicator : Add the indicator to your favorites. Adjust the settings to match your analysis needs.
2. 📊 Analysis : Keep an eye out for the specific symbols plotted on your chart that indicate various candlestick patterns. Use these signals to enhance your market analysis.
3. 🔔 Set Alerts : Enable alerts for the patterns you are most interested in to get notified of potential trading opportunities without needing to monitor the charts constantly.
Embark on your enhanced trading journey with this powerful tool! 🚀✨ Happy trading!
🧐 How It Works:
The Candlestick Reversal and Trend Signals indicator operates by integrating several candlestick patterns and trend analysis features to assist in making informed trading decisions. Initially, it gathers user-defined settings like the period for filtering, signal thresholds, and the desired patterns to detect. It analyzes candlestick formations such as Bull/Bear Engulfings, Dojis, Haramis, and more, by comparing the current candlestick's attributes (such as body length and direction) with previous data to identify potential market reversals or confirmations. The indicator enhances its accuracy through additional filters like volume ratios and exponential moving averages (EMAs) that help validate the strength and direction of trends. By marking these patterns and trends visually on the chart, it provides clear signals that aid traders in identifying significant market movements efficiently. The script is then complemented with the 3 EMA indicator for trend detection and swing levels for added confluence.

Multiple Non-Linear Regression [ChartPrime]This Pine Script indicator is designed to perform multiple non-linear regression analysis using four independent variables: close, open, high, and low prices. Here's a breakdown of its components and functionalities:
Inputs:
Users can adjust several parameters:
Normalization Data Length: Length of data used for normalization.
Learning Rate: Rate at which the algorithm learns from errors.
Smooth?: Option to smooth the output.
Smooth Length: Length of smoothing if enabled.
Define start coefficients: Initial coefficients for the regression equation.
Data Normalization:
The script normalizes input data to a range between 0 and 1 using the highest and lowest values within a specified length.
Non-linear Regression:
It calculates the regression equation using the input coefficients and normalized data. The equation used is a weighted sum of the independent variables, with coefficients adjusted iteratively using gradient descent to minimize errors.
Error Calculation:
The script computes the error between the actual and predicted values.
Gradient Descent: The coefficients are updated iteratively using gradient descent to minimize the error.
// Compute the predicted values using the non-linear regression function
predictedValues = nonLinearRegression(x_1, x_2, x_3, x_4, b1, b2, b3, b4)
// Compute the error
error = errorModule(initial_val, predictedValues)
// Update the coefficients using gradient descent
b1 := b1 - (learningRate * (error * x_1))
b2 := b2 - (learningRate * (error * x_2))
b3 := b3 - (learningRate * (error * x_3))
b4 := b4 - (learningRate * (error * x_4))
Visualization:
Plotting of normalized input data (close, open, high, low).
The indicator provides visualization of normalized data values (close, open, high, low) in the form of circular markers on the chart, allowing users to easily observe the relative positions of these values in relation to each other and the regression line.
Plotting of the regression line.
Color gradient on the regression line based on its value and bar colors.
Display of normalized input data and predicted value in a table.
Signals for crossovers with a midline (0.5).
Interpretation:
Users can interpret the regression line and its crossovers with the midline (0.5) as signals for potential buy or sell opportunities.
This indicator helps users analyze the relationship between multiple variables and make trading decisions based on the regression analysis. Adjusting the coefficients and parameters can fine-tune the model's performance according to specific market conditions.

Jemmy Trade Whales Multiple Signal Options - Nine in One $$$This script is a combination of several indicators and trading strategies.
Let's break down each part:
1. MACD Indicator (My MACD Indicator – Nabil's Version): This calculates the Moving Average Convergence Divergence (MACD) using Heikin Ashi candles. It uses Exponential Moving Averages (EMA) to compute the fast and slow lengths and then calculates the MACD line, signal line, and histogram based on the difference between these EMAs.
2. Smoothed Moving Average (SMMA): This calculates a smoothed moving average using a user-defined length.
3. Least Squares Moving Average (LSMA): This calculates a least squares moving average using a user-defined length.
4. High Low SAR - Nabil's Version: This section calculates various levels based on SAR (Stop and Reverse) indicator. It also plots lines based on certain conditions and includes SAR lines with specific properties.
5. Volume-Weighted Hull Moving Average (VHMA) - Nabil's Version: This calculates a volume-weighted Hull moving average.
6. SAR (Stop and Reverse): This calculates the SAR indicator with user-defined parameters.
7. Mean Reversion Strategy: This part calculates upper and lower bands based on a multiplier of Standard Deviation from a mean. It also generates buy and sell signals based on crossing these bands.
8. SSL Hybrid - Nabil's Version: This calculates various indicators like SSL (Stochastic Scaled Levels), ATR (Average True Range) bands, and Keltner Channels. It also plots buy and sell signals based on certain conditions.
9. Buy Signal Options: This section defines several conditions for generating buy signals based on different combinations of indicators and plots corresponding buy signals.
Each section seems to be relatively independent and focused on calculating specific indicators or trading strategies. The script combines these components to provide a comprehensive trading setup with various buy signal options based on user preferences.
BUY SIGNALS EXPLAINATION:
1. MAIN - Price: This signal triggers when the current candle's close price crosses above the lookback average line (lookbackavg). It indicates a bullish momentum when the price moves above the average line.
2. MAIN - Price - SMMA - LSMA / Crossing: This signal combines multiple conditions:
• The current candle's close price crosses above the lookback average line.
• The smoothed moving average (SMMA) crosses above the lookback average line.
• The least squares moving average (LSMA) crosses above the lookback average line. This signal confirms a bullish trend when all three moving averages cross above the average line simultaneously.
3. MAIN - Price - (SMMA > LSMA) / No Crossing: This signal triggers when the following conditions are met:
• The current candle's close price crosses above the lookback average line.
• The SMMA is above the LSMA. This signal confirms a bullish trend when the SMMA remains consistently above the LSMA without crossing.
4. MAIN - Price - SMMA - LSMA - SAR - SSL / Crossing: This signal combines multiple conditions:
• The current candle's close price, SMMA, and LSMA cross above the lookback average line.
• The SAR (Stop and Reverse) indicator is above the SSL (Stochastic Scaled Levels). This signal indicates a strong bullish momentum when all conditions align.
5. MAIN - Price - (SMMA > LSMA) - SAR - SSL / No Crossing: This signal triggers when the following conditions are met:
• The current candle's close price crosses above the lookback average line.
• The SMMA is consistently above the LSMA.
• The SAR is above the SSL. This signal confirms a bullish trend without any crossing of moving averages.
6. MAIN - Price - SMMA - LSMA - SAR - SSL / Crossing - Coloring: Similar to signal 4, this signal additionally checks for specific colors of SAR and SSL lines to confirm a bullish momentum.
7. MAIN - Price - (SMMA > LSMA) - SAR - SSL / No Crossing - Coloring: Similar to signal 5, this signal also checks for specific colors of SAR and SSL lines to confirm a bullish trend without any crossing of moving averages.
8. MAIN Support line - 2 Candles: This signal triggers when the price pulls back from below the support line within the last two candles. It indicates a potential reversal from a support level.
9. MAIN Support line - lookBack Candles: This signal is similar to signal 8 but considers a specified lookback range for checking the pullback from below the support line.
These buy signals aim to identify various bullish scenarios based on combinations of price action, moving averages, SAR, and SSL indicators. Each signal offers different levels of confirmation for potential buying opportunities in the market.
USE IT WITH YOUR RISK MANAGEMENT STRATEGIES.
Future Updates "Coming Soon"
Targets - Under processing.
Stop loss - Under Processing.
Trailing - Under Processing.
Historical Data Table - Under processing.
Strength Table - Under Processing.
Whales Catcher - Under Processing.
Order Book Analyzer - Under Processing.
NABIL ELMAHDY $$

RunRox - Signals MasterSignals Master - meticulously crafted by RunRox, is a versatile tool engineered to accommodate traders of all experience levels. This indicator does not merely suggest potential entry and exit signals; it can seamlessly integrate into your existing trade strategy, enhancing decision-making with its comprehensive features.
With an array of functionalities, Signals Master stands out as a robust standalone product. It is designed to cater to diverse trading approaches, offering real-time signal detection that allows traders to respond swiftly to market fluctuations.
The true power of Signals Master lies in its ability to simplify complex market data into actionable insights. Whether used as a primary indicator or as a complement to your strategy, it helps clarify the trading path ahead, empowering you with confidence in every trade you make.
Core Features of Signals Master
Real-time buy and sell signal alerts
Adjustable sensitivity for tailored signal precision
Customizable alert settings for efficient strategy execution
Advanced backtesting system for strategy optimization
Multiple take profit and stop loss options
Detailed dashboard display for strategy monitoring and adjustments
Support and resistance level identification
Trend lines and color-coded volume bars for easy trend following
Candlestick pattern recognition to anticipate market moves
In the image below, you can see our indicator at work and the explanations.
On the chart, you see buy and sell signals, as well as potential trade exits. The "X" mark can also be interpreted as a trend reversal and a potential signal for a trend change. But always stick to your own exit strategy!
Autopilot \ Optimization
One of the standout features of our Signals Master indicator is its auto-optimization and autopilot capabilities. This function automatically identifies the best settings for specific charts and timeframes, ideal for novice traders.
The autopilot feature simplifies the trading process by continuously adjusting settings to optimize your strategy under varying market conditions. This allows for a more efficient trading experience, focusing on strategy effectiveness rather than constant configuration adjustments.
Signal Mode
The Signal Mode functionality of our Signals Master indicator optimizes signals specifically for either buying or selling, tailoring the best settings to enhance one-directional trading. This feature is particularly useful for traders who prefer to focus exclusively on asset purchases. By optimizing for a single direction, Signal Mode ensures that traders can maximize their strategic approach and efficiency in the markets where they feel most confident. This targeted optimization helps to streamline decision-making processes and improve overall trading precision.
Additional Features
Reversal Zones: This feature identifies potential reversal points in the market, helping traders to spot opportunities where trends might change direction. By marking these zones, traders can anticipate market turns with greater accuracy.
Trend Assistant: Streamline your trend analysis with the Trend Assistant, which highlights ongoing trends and their strength. This tool aids in confirming the trend’s stability, making it easier to decide on entry or exit points.
Neo Cloud: Enhance your market analysis with Neo Cloud, which provides a dynamic visualization of support and resistance levels. This feature helps traders understand the current market state, indicating bullish or bearish conditions.
Candlestick Patterns Detection: Quickly identify key candlestick patterns that signal potential market moves. This detection tool simplifies the complexity of candlestick analysis, allowing for swift, informed trading decisions based on traditional charting techniques.
Volume Candlestick
Enhance your market reading with RunRox’s color-coded volume bars that gauge the strength of buying or selling within each bar. This intuitive feature adds a layer of depth to your analysis, allowing for quick recognition of vital market movements and informed trading decisions.
RISK DISCLAIMER
It is crucial for traders to recognize that while indicators are powerful tools, they should serve as aids rather than definitive solutions. No indicator, including those provided by RunRox, can offer a 100% win rate or replace the need for personal judgment and comprehensive analysis. Our goal is to equip traders with sophisticated instruments that can enhance their understanding and evaluation of market conditions.
We encourage all users of RunRox indicators to utilize them as supplements to their own trading strategies and analyses. The ultimate responsibility for trade decisions lies with the trader, informed by their own knowledge, risk assessment, and market research. Our indicators are designed to support this decision-making process, not to dictate it.

Dynamic Candle Balance Indicator (Binary)
Dynamic Candle Balance Indicator
The Dynamic Candle Balance Indicator is a powerful tool designed to identify imbalances in candle colors on a chart, which can indicate potential reversals or changes in market direction. This indicator is specifically developed for traders operating on short timeframes, such as 1-minute candles, and is particularly useful for identifying opportunities in binary options.
How to Use:
Set Parameters
Initial Position: Specify the number of initial candles to be considered for calculation.
Count: Determine the total number of candles to be analyzed, including the initial position.
Interpret Results:
Green: Indicates the number of bullish candles (where the closing price is higher than the opening price).
Red: Indicates the number of bearish candles (where the closing price is lower than the opening price).
Absent: Indicates the number of candles that were not considered due to the selected interval.
Performance Analysis:
The indicator calculates the percentage of green and red candles relative to the total number of analyzed candles, providing insights into market balance or imbalance.
Identify Trading Opportunities:
Significant imbalances between candle colors can indicate potential reversals or changes in market direction.
Traders can use this information to make informed decisions about their trading strategies, such as identifying entry or exit points.
Example:
In the last 40 candles, there were 13 green candles and 27 red candles, indicating a higher likelihood of the next candle being green.
Usage Tips:
The indicator is most effective when used on a 1-minute timeframe for binary options trading, especially during periods of high imbalance.
Adjust the parameters according to your trading strategy and the timeframe being analyzed.
Combine the Dynamic Candle Balance Indicator with other technical analysis tools to confirm trading signals.
Legal Disclaimer:
This indicator is provided for educational and informational purposes only. It represents a theory and should be used as part of a comprehensive trading strategy. Past performance is not indicative of future results. Traders should always conduct their own analysis before making trading decisions.
Try out the Dynamic Candle Balance Indicator and leverage its functionalities to identify trading opportunities on short-term charts, especially in 1-minute timeframes for binary options trading during periods of high imbalance. Remember to test the indicator on a practice account before using it on a real account.
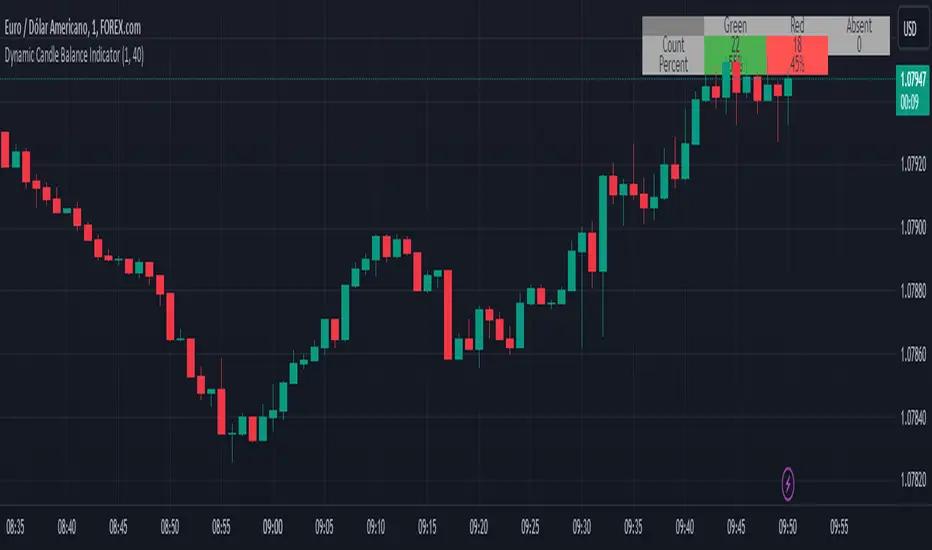
Ghost Tangent Crossings [ChartPrime]Ghost Tangent Crossings (ChartPrime) is a revolutionary way to visualize pivot points and zig-zag patterns that utilizes ellipses. This indicator makes sure that each pivot is plotted from high to low, ensuring a correct zig-zag wave pattern. Before a zig-zag is confirmed Ghost Tangent Crossings (ChartPrime) plots an estimate of the next valid move allowing you to plan well ahead of time. Once it is confirmed, the indicator will fill in the plot with a solid color and print a break label.
Unlike other zig-zag or pivot point indicators, Ghost Tangent Crossings (ChartPrime) only has a pivot lookforward input. This is because the lookback is automatically adjusted based on the last known zig-zag. This allows the indicator to dynamically look for the most recent valid market movement. The equipoint is calculated as the point along the ellipse with an equal change in price on either side. From this point we plot a line with the slope at that location and when the price breaks this level a break label is plotted. Alternatively you can plot this point as a horizontal line. This area works as support and resistance for the market as its the point where the balance in movement is found. We feel that this is a simple and elegant solution to connected zig-zag patterns that utilizes a novel method of visualization that many traders will find useful. With its simple controls and intuitive style, we believe that Ghost Tangent Crossings (ChartPrime) will find a home on most traders charts.
To use Ghost Tangent Crossings (ChartPrime) simply add it to your chart and adjust the lookforward to your taste. From there you can adjust the color of the zig-zags and enable or disable any of the visual features. We have included both wick and body pivot types to accommodate most trading style. From there, you are all done and ready to trade!
Enjoy
TradeDots - Buy Sell SignalsThe TradeDots Buy Sell Indicator is a sophisticated multi-strategy analytics tool designed to discern market direction and identify potential trading opportunities.
The TradeDots indicator utilizes a trend-following strategy that initially identifies the long-term market trend, whether bullish or bearish, at a macro level. It then zooms in on pullback and reversal price action patterns within this broader trend. These patterns are confirmed by a micro-level candlestick analysis, which leads to the issuance of a "buy" alert. This process ensures both macro and micro elements of the market are considered before entering a trade.
How Does It Work?
In more detail, the procedure begins at the macro level where the advanced indicator applies an Exponential Moving Average (EMA) within the current timeframe. This EMA is then cross-verified with another EMA of the same length from a higher timeframe, ensuring a reliable assessment of long-term market trends. This approach helps establish whether the market situation favors long or short positions.
Following this, a complex mathematical model uses a designated window of candlesticks to calculate price action changes, storing all significant reversal patterns for subsequent comparison. The algorithm then identifies similar repeated reversal patterns in the chart, pinpointing potential market turning points.
For precision and reliability, the confirmation of these reversal patterns involves further refinement and filtering at a micro level. By calculating market momentum in tandem with an exhaustive analysis, e.g. Average True Value (ATR), candlestick body and wick data, the algorithm can affirm the reversal. Finally, the buy or sell signals are plotted on the chart in real-time.
The indicator includes 4 distinct entry strategies for both "Long" and "Short" orders. Each strategy represents different levels of rigorousness in their analysis rules. For instance, a "Weak Buy" signal represents a lighter pullback strength compared to a "Strong Buy" signal, with "Reversal Buy" exhibiting the robust pullback strength based on the change in price action value.
Each type of order comes with its minimum threshold and conditions for profit-taking to prevent excessive trading activity that could lead to high commission costs. Once these conditions are met and coupled with a reversal signal — generated with the same concepts as mentioned earlier but in the opposite direction — a sell signal is then triggered in real time. It's a systematic process that ensures an optimal balance between timely entries and exits in the market.
Generating Trading Ideas Catering To Traders Of All Kinds
TradeDots Buy Sell Indicator includes multiple strategies and many features:
4+ Types of Trading Alerts: Strong, Weak, Reversal, and Breakout for different market conditions (Should not be followed blindly).
2+ Trading Styles: Buy and Hold, Swing Trading (Should not be followed blindly).
Facilitates both "Long" and "Short" trades.
+ more. (Check the changelog below for current features)
HOW TO USE
⭐️ TRADING STRATEGY
Buy and Hold: An approach suitable for long-term investments or as an alternative to a dollar-cost averaging strategy by identifying only the undervalued positions in markets with long-term growth potential like stocks and indices.
Note: This strategy does not provide an exit strategy.
Swing Trading: This method targets buying low and selling high, adapted for traders looking to make the most of short to mid-term market volatility.
⭐️ ORDER DIRECTION
Order direction is for “Swing trading” strategy and other strategies that comes with an exit strategy. It is to choose the direction of the market that you wish to place your order on.
Long: Primarily targeting markets that exhibit a left-skewed trend (more often it rises than falls), this strategy focuses on "long" trading opportunities, avoiding "short" market actions.
Short: Apt for markets displaying a right-skewed trend (more often it falls than rises), this approach targets "short" opportunities exclusively, refraining from "long" market actions.
Long and Short: This comprehensive strategy identifies trading opportunities for both "long" and "short" market actions, facilitating increased opportunities for volatile assets.
⭐️ ALERT TYPES
Strong: These alerts designate high risk/reward return opportunities with a reasonable win rate. They tend to appear near previous support pivots where a Change in Character (CoCh) may often occur, typically coupled with a tight stop-loss strategy.
Weak: Indicative of opportunities balancing risk/reward return and win-rate, these alerts often appear during strong momentum markets.
Reversal: These signals identify potential reversals by highlighting extreme oversold or overbought states, thus revealing markets that are underpriced or overpriced for swift trading actions.
Breakout: They are to identify a change in trend and market breakout by gaps created post earnings or significant economic events, purposed for "Buy high, sell higher" strategies.
⭐️ STOP LOSS
The stop-loss feature offers customization options, enabling users to close a position upon reaching a predefined percentage drawdown. As volatility varies across different timeframes and markets, tuning this feature in accordance with the market allows optimal usage of this indicator.
CONCLUSION
While technical indicators are certainly vital in trading analysis, they are just one part of the equation. The individual trader's style and mindset significantly influence their trading outcomes, making them equally crucial in the process. Therefore, relying solely on indicators for a successful trading outcome may not be the most effective strategy.
Understanding and leveraging these indicators requires substantial time and significant effort from traders. They need to deeply engage with these tools to truly grasp their behavior and functionality. Taking this into consideration, our aim is to create highly advanced, customizable, and user-friendly technical indicators. This tool is designed to illuminate the fundamental role that technical indicators play as a supportive decision-making apparatus, aiding traders to more swiftly embark on their journey towards successful trading.
See Author's instructions below to get instant access to this indicator.
RISK DISCLAIMER
Trading entails substantial risk, and most day traders incur losses. All content, tools, scripts, articles, and education provided by TradeDots serve purely informational and educational purposes. Past performances are not definitive predictors of future results.

Entry FraggerEntry Fragger is a simple buy signal indicator.
It is most suitable for cryptocurrency, especially for altcoins on the 5 minute to daily timeframe and is based on simple volume calculations, in combination with EMA's.
Main Signal Logic explained:
A buy signal is generated by counting candles with an above average sell volume of 130% to 170%, taking into account the candles position below and above the 50 and 200 EMA.
If criteria meet, the first green candle above the 50 EMA's suggests upcoming higher prices.
The indicator has 2 input variables.
"Signal Confirmations (0 - 7):" Changes signal accuracy by a defining an ammount of high sell volume candles necessary below the 50 EMA.
"Volume Calculation Base (9 - 200):" Sets the exponential volume multiplier, this affects candle coloring and the volume calculation inside the candle.
"Style Settings": Turn ON/OFF Signals, Cloud, Bar Coloring, EMA's, etc...
There are no generally suitable default numbers for those 2 inputs, those have to be tested out, depending on cryptocurrency and timeframe.
The calculation is very basic, the underlying idea being, market maker initiating range breakouts through rapid increase of volume above or below the EMA's .
Example settings:
SOLUSDT: Signal Confirmations: 2, Volume Calculation Base 13.
SOLUSDT: Signal Confirmations: 0, Volume Calculation Base 20.
As you can see it affects signals quite a lot, but staying accurate.
Finetune the inputs to your preference.
Risk to Reward, Stoploss, Take Profit, position sizing, etc... is up to the user.
Recommended entry is to wait for following candle closes, entering half of the candle size and setting Stoploss outside the structure, like this:
Or right below the candles open, for safety.
