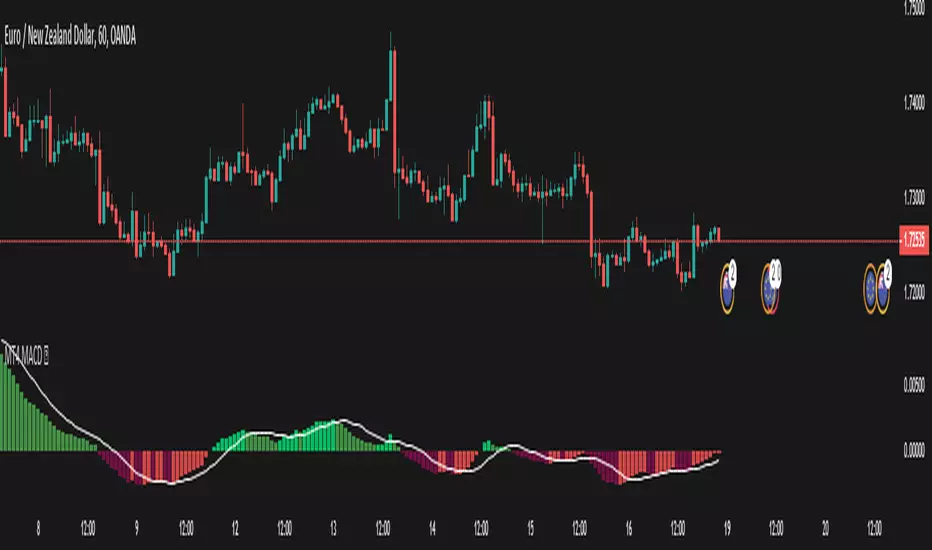
MT4 MACD This is a plain macd similar to the one on the mt4
There are extra colors added for visuals
Primarily requested by user Sonja.
macd // signalline // macdmt4 // mt4macd
Signalline
Smeared VCIThis indicator can be used to enter the market.
When the signal line crosses upwards the base line, enter short;
when the signal line crosses downwards the base line, enter long;
A filter can be used to enter short when in a downtrend or long in an uptrend.
A fair filter can be the ema(200) line defining an uptrend when price is above it or
a down trend when the price lies below.
Use at your own risk.
Hitting the like button is a free act of gratitude.
Have fun.

RSI Divergence UltimateHere it is Everyone - What was once hidden is now revealed
This is the Ultimate RSI Divergence Indicator
Not only does it plot Regular and Hidden Divergence lines for an RSI smoothed by an EMA and for its Signal Line
The RSI can be set to change color with direction or can be set as single color with or with out OB / OS highlights
Color Changing RSI helps when trading Multiple Time Frames as you can look for confluence in the direction of RSI
Included options for the Signal Line include;
Various calculations EMA, SMA and Linear Regression which provides very accurate signal line crossover signals
Color Changing with direction
Second RSI with different Length
Multi Time Frame RSI
Bollinger Bands applied to the RSI
RSI Stochastic that has been compressed to fit into RSI OB / OS so that it doesnt compress the RSI when in these regions
There are also Background Highlights (thanks to Chris Moody) for when the RSI Stochastic moves into OB / OS and crosses its signal line
There are plenty of Alerts for signals with more complex alerts coming soon
I have also added Hima Reddy's Power Zones for support and resistance so now you can also
Take full advantage of trading; signal line crosses, 50 crosses and Power Zone RSI support and resistance and much more
The divergence script is thanks to @RicardoSantos, I've just adjusted it to suite my indicator
Remember that divergences work best when traded with the trend or very late in a trend when going against the trend

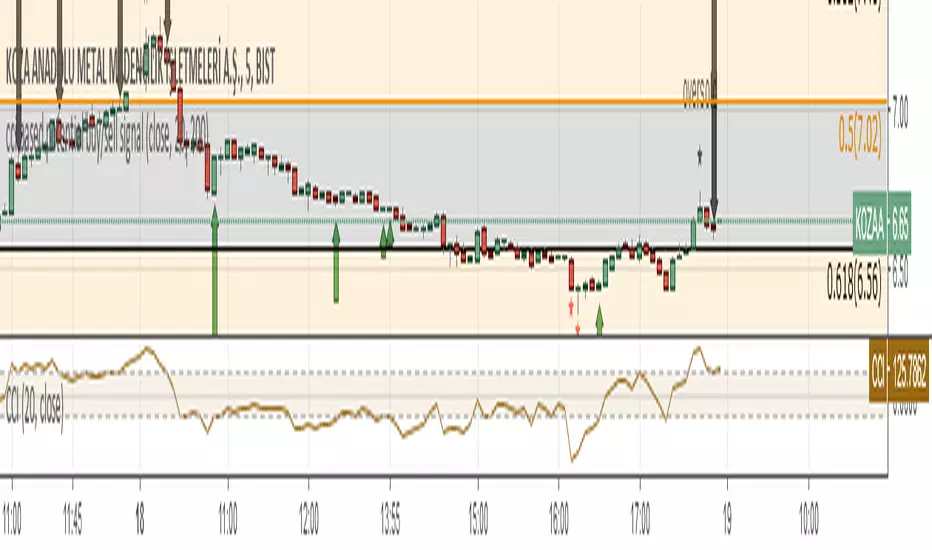
cci based potential buy/sell signal
Commodity Channel Index Potential Buy Signal
Commodity Channel Index (CCI) is below oversold line (-200).
CCI then crosses above -100 line
Commodity Channel Index Potential Sell Signal
Commodity Channel Index (CCI) is above overbought line (+200).
CCI then crosses below +100 line.
Türkçe Açıklama;
CCI Potansiyel Al Sinyali
CCI indikatörünün -200 altında bulunduğu bölgeler aşırı satış bölgeleri,
Sonrasında aşağıdan gelerek -100 çizgisinin üzerine çıktığı yada çıkmak üzere olduğu noktalar al sinyali
CCI Potansiyel Satl Sinyali
CCI indikatörünün +200 üzerinde bulunduğu bölgeler aşırı alım bölgeleri,
Sonrasında yukarıdan inerek +100 çizgisinin altına indiği yada inmek üzere olduğu noktalar sat sinyali
Not: Tek başına kullanılması son derece hatalı sonuçlar verebilir. Sadece olabilirlik potansiyeli taşımaktadır.
TRIX Histogram R1-12 by JustUncleLCreated by request.
Description:
This study is an implementation of the Standard TRIX indicator (a momentum oscillator), shown in coloured histogram format by default, with optional Bar colouring of TRIX zero cross overs. Other options include showing TRIX as a line graph instead of histogram and an optional TRIX signal line with difference histogram (to highlight signal line crosses).
References:
forex-indicators.net
"TRIX MA" by munkeefonix

B3 ECOBlau's Ergodic Candlestick Oscillator = a decent trend finder, however slightly lagged. It can help you to see a reversal entry if you are looking for one. I find the one line ECO hard to use, so I have created this histogram version with a signal line. The colors help to show you whats going on with the ECO and its bias. This indicator shows up in a couple books by people other than Blau, and namely by Krausz. You can also see divergences, for example in pic above the lower or second of the two green humps showing that the general uptrend might be weakened as this run contained less momentum. Tighten up the signal line to see a faster change in its color. These settings are the B3 input settings for default, meaning the ones I use in trading. They are not however the default values you might read about other places.
