RSI TrendsRSI is a momentum indicator, however most people seem to be using it to go against the momentum by trying to identify tops/bottoms using it. Its in my opinion the wrong way to be using it. It can be easily used for trend following which seems like a better use for it.
Uptrend - RSI > 60
Downtrend - RSI < 40
Sideways - RSI between 40 and 60
If however not interested in filtering for sideways trends and convert it to a long-short only strategy that stays in market all the time then it can be simply modified by setting both overbought/oversold thresholds to 50. In such a case uptrend will be above 50 and downtrend will be less than 50.
Note: wait for close for current bar to be confirmed as RSI is calculated at close
Sideways

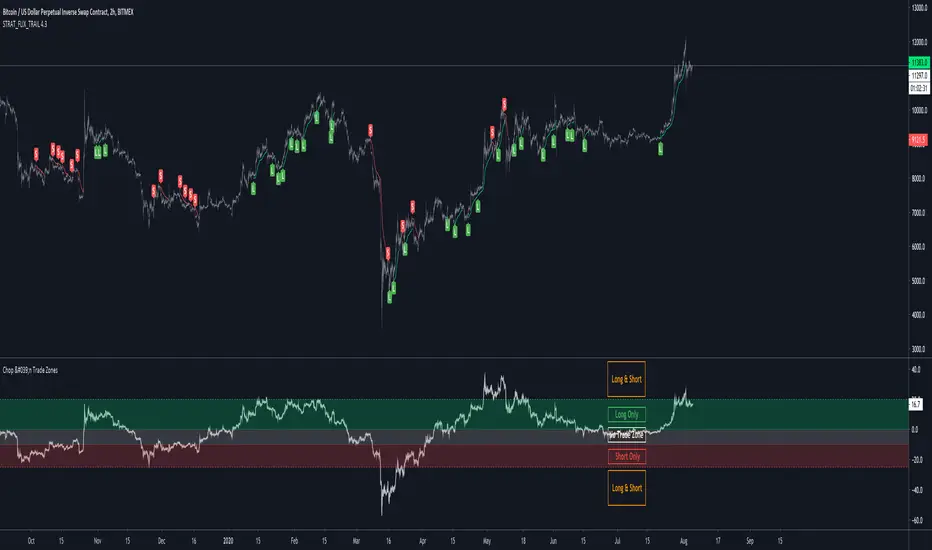
Tool: Chop & Trade ZonesA simple yet powerful way to filter out choppy ranges or sideways moves without missing out on good trades
It calculates the %-distance of the price to a moving average so you can ignore buy/sell signals around the center line.
The upper and lower line are thresholds to catch reversals of the trend when the distance to moving average is increasing.
Thanks @dgtrd and @imzeeshan for the inspiration 🙏
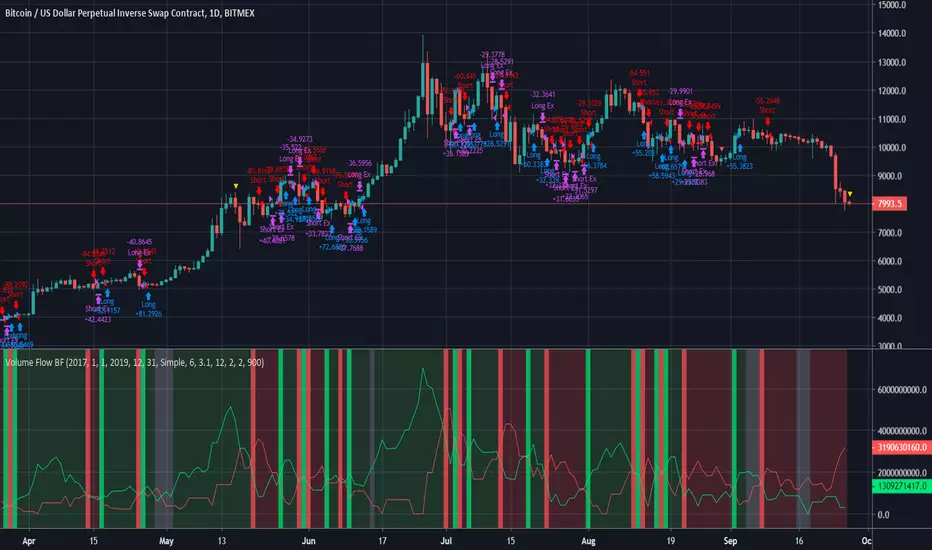
Volume Flow BFBased on code by oh92 and kiasaki.
Measures volume to indicate Bull vs Bear.
Go long when green, short when red, wait patiently when white.
inside_bar (by cilivan)Simple script for coloring inside bars to spot them easier (color can be adjusted)
