Quarterly Theory ICT 02 [TradingFinder] True Open Session 90 Min🔵 Introduction
The Quarterly Theory ICT indicator is an advanced analytical system built on ICT (Inner Circle Trader) concepts and fractal time. It divides time into four quarters (Q1, Q2, Q3, Q4), and is designed based on the consistent repetition of these phases across all trading timeframes (annual, monthly, weekly, daily, and even shorter trading sessions).
Each cycle consists of four distinct phases: the first phase (Q1) is the Accumulation phase, characterized by price consolidation; the second phase (Q2), known as Manipulation or Judas Swing, is marked by initial false movements indicating a potential shift; the third phase (Q3) is Distribution, where price volatility peaks; and the fourth phase (Q4) is Continuation/Reversal, determining whether the previous trend continues or reverses.
🔵 How to Use
The central concept of this strategy is the "True Open," which refers to the actual starting point of each time cycle. The True Open is typically defined at the beginning of the second phase (Q2) of each cycle. Prices trading above or below the True Open serve as a benchmark for predicting the market's potential direction and guiding trading decisions.
The practical application of the Quarterly Theory strategy relies on accurately identifying True Open points across various timeframes.
True Open points are defined as follows :
Yearly Cycle :
Q1: January, February, March
Q2: April, May, June (True Open: April Monthly Open)
Q3: July, August, September
Q4: October, November, December
Monthly Cycle :
Q1: First Monday of the month
Q2: Second Monday of the month (True Open: Daily Candle Open price on the second Monday)
Q3: Third Monday of the month
Q4: Fourth Monday of the month
Weekly Cycle :
Q1: Monday
Q2: Tuesday (True Open: Daily Candle Open Price on Tuesday)
Q3: Wednesday
Q4: Thursday
Daily Cycle :
Q1: 18:00 - 00:00 (Asian session)
Q2: 00:00 - 06:00 (True Open: Start of London Session)
Q3: 06:00 - 12:00 (NY AM)
Q4: 12:00 - 18:00 (NY PM)
90 Min Asian Session :
Q1: 18:00 - 19:30
Q2: 19:30 - 21:00 (True Open at 19:30)
Q3: 21:00 - 22:30
Q4: 22:30 - 00:00
90 Min London Session :
Q1: 00:00 - 01:30
Q2: 01:30 - 03:00 (True Open at 01:30)
Q3: 03:00 - 04:30
Q4: 04:30 - 06:00
90 Min New York AM Session :
Q1: 06:00 - 07:30
Q2: 07:30 - 09:00 (True Open at 07:30)
Q3: 09:00 - 10:30
Q4: 10:30 - 12:00
90 Min New York PM Session :
Q1: 12:00 - 13:30
Q2: 13:30 - 15:00 (True Open at 13:30)
Q3: 15:00 - 16:30
Q4: 16:30 - 18:00
Micro Cycle (22.5-Minute Quarters) : Each 90-minute quarter is further divided into four 22.5-minute sub-segments (Micro Sessions).
True Opens in these sessions are defined as follows :
Asian Micro Session :
True Session Open : 19:30 - 19:52:30
London Micro Session :
T rue Session Open : 01:30 - 01:52:30
New York AM Micro Session :
True Session Open : 07:30 - 07:52:30
New York PM Micro Session :
True Session Open : 13:30 - 13:52:30
By accurately identifying these True Open points across various timeframes, traders can effectively forecast the market direction, analyze price movements in detail, and optimize their trading positions. Prices trading above or below these key levels serve as critical benchmarks for determining market direction and making informed trading decisions.
🔵 Setting
Show True Range : Enable or disable the display of the True Range on the chart, including the option to customize the color.
Extend True Range Line : Choose how to extend the True Range line on the chart, with the following options:
None: No line extension
Right: Extend the line to the right
Left: Extend the line to the left
Both: Extend the line in both directions (left and right)
Show Table : Determines whether the table—which summarizes the phases (Q1 to Q4)—is displayed.
Show More Info : Adds additional details to the table, such as the name of the phase (Accumulation, Manipulation, Distribution, or Continuation/Reversal) or further specifics about each cycle.
🔵 Conclusion
The Quarterly Theory ICT, by dividing time into four distinct quarters (Q1, Q2, Q3, and Q4) and emphasizing the concept of the True Open, provides a structured and repeatable framework for analyzing price action across multiple time frames.
The consistent repetition of phases—Accumulation, Manipulation (Judas Swing), Distribution, and Continuation/Reversal—allows traders to effectively identify recurring price patterns and critical market turning points. Utilizing the True Open as a benchmark, traders can more accurately determine potential directional bias, optimize trade entries and exits, and manage risk effectively.
By incorporating principles of ICT (Inner Circle Trader) and fractal time, this strategy enhances market forecasting accuracy across annual, monthly, weekly, daily, and shorter trading sessions. This systematic approach helps traders gain deeper insight into market structure and confidently execute informed trading decisions.
Sessions

Quarterly Theory ICT 01 [TradingFinder] XAMD + Q1-Q4 Sessions🔵 Introduction
The Quarterly Theory ICT indicator is an advanced analytical system based on the concepts of ICT (Inner Circle Trader) and fractal time. It divides time into quarterly periods and accurately determines entry and exit points for trades by using the True Open as the starting point of each cycle. This system is applicable across various time frames including annual, monthly, weekly, daily, and even 90-minute sessions.
Time is divided into four quarters: in the first quarter (Q1), which is dedicated to the Accumulation phase, the market is in a consolidation state, laying the groundwork for a new trend; in the second quarter (Q2), allocated to the Manipulation phase (also known as Judas Swing), sudden price changes and false moves occur, marking the true starting point of a trend change; the third quarter (Q3) is dedicated to the Distribution phase, during which prices are broadly distributed and price volatility peaks; and the fourth quarter (Q4), corresponding to the Continuation/Reversal phase, either continues or reverses the previous trend.
By leveraging smart algorithms and technical analysis, this system identifies optimal price patterns and trading positions through the precise detection of stop-run and liquidity zones.
With the division of time into Q1 through Q4 and by incorporating key terms such as Quarterly Theory ICT, True Open, Accumulation, Manipulation (Judas Swing), Distribution, Continuation/Reversal, ICT, fractal time, smart algorithms, technical analysis, price patterns, trading positions, stop-run, and liquidity, this system enables traders to identify market trends and make informed trading decisions using real data and precise analysis.
♦ Important Note :
This indicator and the "Quarterly Theory ICT" concept have been developed based on material published in primary sources, notably the articles on Daye( traderdaye ) and Joshuuu . All copyright rights are reserved.
🔵 How to Use
The Quarterly Theory ICT strategy is built on dividing time into four distinct periods across various time frames such as annual, monthly, weekly, daily, and even 90-minute sessions. In this approach, time is segmented into four quarters, during which the phases of Accumulation, Manipulation (Judas Swing), Distribution, and Continuation/Reversal appear in a systematic and recurring manner.
The first segment (Q1) functions as the Accumulation phase, where the market consolidates and lays the foundation for future movement; the second segment (Q2) represents the Manipulation phase, during which prices experience sudden initial changes, and with the aid of the True Open concept, the real starting point of the market’s movement is determined; in the third segment (Q3), the Distribution phase takes place, where prices are widely dispersed and price volatility reaches its peak; and finally, the fourth segment (Q4) is recognized as the Continuation/Reversal phase, in which the previous trend either continues or reverses.
This strategy, by harnessing the concepts of fractal time and smart algorithms, enables precise analysis of price patterns across multiple time frames and, through the identification of key points such as stop-run and liquidity zones, assists traders in optimizing their trading positions. Utilizing real market data and dividing time into Q1 through Q4 allows for a comprehensive and multi-level technical analysis in which optimal entry and exit points are identified by comparing prices to the True Open.
Thus, by focusing on keywords like Quarterly Theory ICT, True Open, Accumulation, Manipulation, Distribution, Continuation/Reversal, ICT, fractal time, smart algorithms, technical analysis, price patterns, trading positions, stop-run, and liquidity, the Quarterly Theory ICT strategy acts as a coherent framework for predicting market trends and developing trading strategies.
🔵b]Settings
Cycle Display Mode: Determines whether the cycle is displayed on the chart or on the indicator panel.
Show Cycle: Enables or disables the display of the ranges corresponding to each quarter within the micro cycles (e.g., Q1/1, Q1/2, Q1/3, Q1/4, etc.).
Show Cycle Label: Toggles the display of textual labels for identifying the micro cycle phases (for example, Q1/1 or Q2/2).
Table Display Mode: Enables or disables the ability to display cycle information in a tabular format.
Show Table: Determines whether the table—which summarizes the phases (Q1 to Q4)—is displayed.
Show More Info: Adds additional details to the table, such as the name of the phase (Accumulation, Manipulation, Distribution, or Continuation/Reversal) or further specifics about each cycle.
🔵 Conclusion
Quarterly Theory ICT provides a fractal and recurring approach to analyzing price behavior by dividing time into four quarters (Q1, Q2, Q3, and Q4) and defining the True Open at the beginning of the second phase.
The Accumulation, Manipulation (Judas Swing), Distribution, and Continuation/Reversal phases repeat in each cycle, allowing traders to identify price patterns with greater precision across annual, monthly, weekly, daily, and even micro-level time frames.
Focusing on the True Open as the primary reference point enables faster recognition of potential trend changes and facilitates optimal management of trading positions. In summary, this strategy, based on ICT principles and fractal time concepts, offers a powerful framework for predicting future market movements, identifying optimal entry and exit points, and managing risk in various trading conditions.

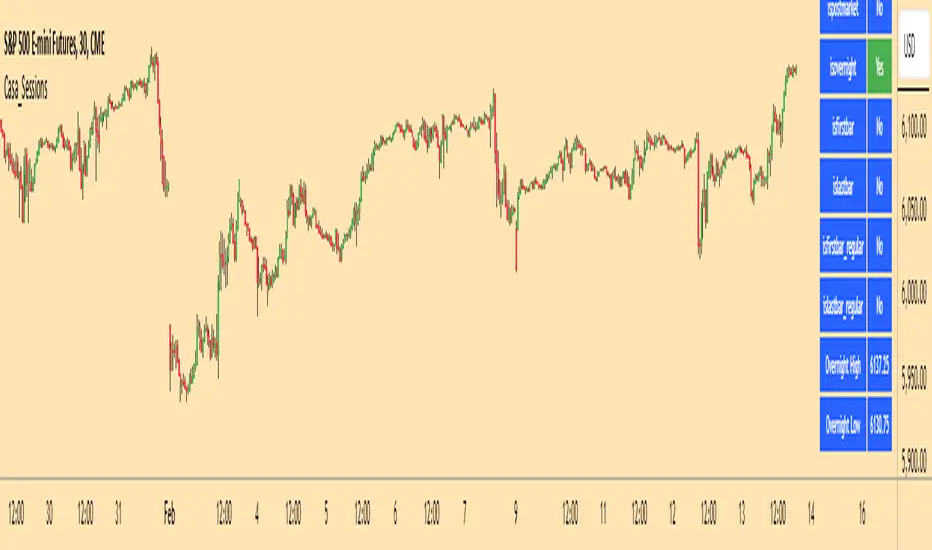
Casa_SessionsLibrary "Casa_Sessions"
Advanced trading session management library that enhances TradingView's default functionality:
Key Features:
- Accurate session detection for futures markets
- Custom session hour definitions
- Drop-in replacements for standard TradingView session functions
- Flexible session map customization
- Full control over trading windows and market hours
Perfect for traders who need precise session timing, especially when working
with futures markets or custom trading schedules.
SetSessionTimes(session_type_input, custom_session_times_input, syminfo_type, syminfo_root, syminfo_timezone)
Parameters:
session_type_input (simple string) : Input string for session selection:
- 'Custom': User-defined session times
- 'FX-Tokyo': Tokyo forex session
- 'FX-London': London forex session
- 'FX-New York': NY forex session
- 'Overnight Session (ON)': After-hours trading
- 'Day Session (RTH)': Regular trading hours
custom_session_times_input (simple string) : Session parameter for custom time windows
Only used when session_type_input is 'Custom'
syminfo_type (simple string)
syminfo_root (simple string)
syminfo_timezone (simple string)
Returns:
session_times: Trading hours for selected session
session_timezone: Market timezone (relevant for forex)
getSessionMap()
Get futures trading session hours map
Keys are formatted as 'symbol:session', examples:
- 'ES:market' - Regular trading hours (RTH)
- 'ES:overnight' - Extended trading hours (ETH)
- 'NQ:market' - NASDAQ futures RTH
- 'CL:overnight' - Crude Oil futures ETH
Returns: Map
Key: Symbol:session identifier
Value: Session hours in format "HH:MM-HH:MM"
getSessionString(session, symbol, sessionMap)
Returns a session string representing the session hours (and days) for the requested symbol (or the chart's symbol if the symbol value is not provided). If the session string is not found in the collection, it will return a blank string.
Parameters:
session (string) : A string representing the session hour being requested. One of: market (regular trading hours), overnight (extended/electronic trading hours), postmarket (after-hours), premarket
symbol (string) : The symbol to check. Optional. Defaults to chart symbol.
sessionMap (map) : The map of futures session hours. Optional. Uses default if not provided.
inSession(session, sessionMap, barsBack)
Returns true if the current symbol is currently in the session parameters defined by sessionString.
Parameters:
session (string) : A string representing the session hour being requested. One of: market (regular trading hours), overnight (extended/electronic trading hours), postmarket (after-hours), premarket
sessionMap (map) : The map of futures session hours. Optional. Uses default if not provided.
barsBack (int) : Private. Only used by futures to check islastbar. Optional. The default is 0.
ismarket(sessionMap)
Returns true if the current bar is a part of the regular trading hours (i.e. market hours), false otherwise. Works for futures (TradingView's methods do not).
Parameters:
sessionMap (map) : The map of futures session hours. Optional. Uses default if not provided.
Returns: bool
isfirstbar()
Returns true if the current bar is the first bar of the day's session, false otherwise. If extended session information is used, only returns true on the first bar of the pre-market bars. Works for futures (TradingView's methods do not).
Returns: bool
islastbar()
Returns true if the current bar is the last bar of the day's session, false otherwise. If extended session information is used, only returns true on the last bar of the post-market bars. Works for futures (TradingView's methods do not).
Returns: bool
ispremarket(sessionMap)
Returns true if the current bar is a part of the pre-market, false otherwise. On non-intraday charts always returns false. Works for futures (TradingView's methods do not).
Parameters:
sessionMap (map) : The map of futures session hours. Optional. Uses default if not provided.
Returns: bool
ispostmarket(sessionMap)
Returns true if the current bar is a part of the post-market, false otherwise. On non-intraday charts always returns false. Works for futures (TradingView's methods do not).
Parameters:
sessionMap (map) : The map of futures session hours. Optional. Uses default if not provided.
Returns: bool
isfirstbar_regular(sessionMap)
Returns true on the first regular session bar of the day, false otherwise. The result is the same whether extended session information is used or not. Works for futures (TradingView's methods do not).
Parameters:
sessionMap (map) : The map of futures session hours. Optional. Uses default if not provided.
Returns: bool
islastbar_regular(sessionMap)
Returns true on the last regular session bar of the day, false otherwise. The result is the same whether extended session information is used or not. Works for futures (TradingView's methods do not).
Parameters:
sessionMap (map) : The map of futures session hours. Optional. Uses default if not provided.
Returns: bool
isovernight(sessionMap)
Returns true if the current bar is a part of the pre-market or post-market, false otherwise. On non-intraday charts always returns false.
Parameters:
sessionMap (map) : The map of futures session hours. Optional. Uses default if not provided.
Returns: bool
getSessionHighAndLow(session, sessionMap)
Returns a tuple containing the high and low print during the specified session.
Parameters:
session (string) : The session for which to get the high & low prints. Defaults to market.
sessionMap (map) : The map of futures session hours. Optional. Uses default if not provided.
Returns: A tuple containing
getSessionHigh(session, sessionMap)
Convenience function to return the session high. Necessary if you want to call this function from within a request.security expression where you can't return a tuple.
Parameters:
session (string) : The session for which to get the high & low prints. Defaults to market.
sessionMap (map) : The map of futures session hours. Optional. Uses default if not provided.
Returns: The high of the session
getSessionLow(session, sessionMap)
Convenience function to return the session low. Necessary if you want to call this function from within a request.security expression where you can't return a tuple.
Parameters:
session (string) : The session for which to get the high & low prints. Defaults to market.
sessionMap (map) : The map of futures session hours. Optional. Uses default if not provided.
Returns: The low of the session
Market Session Times by MadDogMoneyMarket Sessions is a simple indicator allowing you to quickly see the 3 Major Trading Session Open and Close times
Three major Sessions - Asia, UK & NY are included.
(The Australian & Asian markets are so close on time, they have been joined for brevity.)
The Open & Close times for each Session is displayed in the Settings in UTC and can be edited depending on the time of year or market you are following.
By setting the Session indicators partially transparent (as is by default), you can quickly see which Market Sessions, and for how long, they overlap.
Additionally, the Indicator can be hidden for different timeframes.
- 1 HR is the upper limit of visibility
- Visibility on the 1HR, 15min and 5min and below can be toggled on an off to fit your requirements.

Session Bar/Candle ColoringChange the color of candles within a user-defined trading session. Borders and wicks can be changed as well, not just the body color.
PREFACE
This script can be used an educational resource for those who are interested in learning Pine Script. Therefore, the script is published open source and is organized in a manner that follows the recommended Style Guide .
While the main premise of the indicator is rather simple, the script showcases various things that can be achieved such as conditional plotting, alignment of indicator settings, user input validation, script optimization, and more. The script also has examples of taking into consideration the chart timeframe and/or different chart types (Heikin Ashi, Renko, etc.) that a user might be running it on. Note: for complete beginners, I strongly suggest going through the Pine Script User Manual (possibly more than once).
FEATURES
Besides being able to select a specific time window, the indicator also provides additional color settings for changing the background color or changing the colors of neutral/indecisive candles, as shown in the image below.
This allows for a higher level of customization beyond the TradingView chart settings or other similar scripts that are currently available.
HOW TO USE
First, define the intraday trading session that will contain the candles to modify. The session can be limited to specific days of the week.
Next, select the parts of the candles that should be modified: Body, Borders, Wick, and/or Background.
For each of the candle parts that were enabled, you can select the colors that will be used depending on whether a candle is bullish (⇧), bearish (⇩), or neutral (⇆).
All other indicator settings will have a detailed tooltip to describe its usage and/or effect.
LIMITATIONS
The indicator is not intended to function on Daily or higher timeframes due to the intraday nature of session time windows.
The indicator cannot always automatically detect the chart type being used, therefore the user is requested to manually input the chart type via the " Chart Style " setting.
Depending on the available historical data and the selected choice for the " Portion of bar in session " setting, the indicator may not be able to update very old candles on the chart.
EXAMPLE USAGE
This section will show examples of different scenarios that the indicator can be used for.
Emphasizing a main trading session.
Defining a "Pre/post market hours background" like is available for some symbols (e.g., NASDAQ:AAPL ).
Highlighting in which bar the midnight candle occurs.
Hiding indecision bars (neutral candles).
Showing only "Regular Trading Hours" for a chart that does not have the option to toggle ETH/RTH. To achieve this, the actual chart data is hidden, and only the indicator is visible; alternatively, a 2nd instance of the indicator could change colors to match the chart background.
Using a combination of Bars and Japanese Candlesticks. Alternatively, this could be done by hiding the main chart data and using 2 instances of the indicator (one with " Chart Style " setting as Bars , and the other set to Candles ).
Using a combination of thin and thick bars on Range charts. Note: requires disabling the "Thin Bars" setting for Bar charts in the TradingView chart settings.
NOTES
If using more than one instance of this indicator on the same chart, you can use the TradingView "Save Indicator Template" feature to avoid having to re-configure the multiple indicators at a later time.
This indicator is intended to work "out-of-the-box" thanks to the behind_chart option introduced to Pine Script in October 2024. But you can always manually bring the indicator to the front just in case the color changes are not being seen (using the "More" option in the indicator status line: More > Visual Order > Bring to front ).
Many thanks to fikira for their help and inspiring me to create open source scripts.
Any feedback including bug reports or suggestions for improving the indicator (or source code itself) are always welcome in the comments section.

London/NY Sessions [jpkxyz]London/NY Sessions Indicator Guide
This indicator tracks the forex market's most active trading periods: London session, New York session, and their overlap.
This characteristics of the London and New York trading sessions are well documented and many traders use them as a key element in their trading strategies. It is most relevant in forex trading, however it is to an extend also applicable in cryptocurrencies.
London Session (08:00-16:00 UTC)
Most active trading session (35% of daily forex volume)
Highest trading volume and liquidity
Major price movements and trend development
Significant institutional participation
New York Session (13:00-20:00 UTC)
Second most active trading period
High institutional order flow
Major US economic releases
Significant impact on USD pairs
London/New York Overlap (13:00-16:00 UTC)
The most active period in forex markets:
Maximum market liquidity
Highest daily trading volume
Strong price movements
Tightest spreads
Peak institutional activity
This indicator helps traders:
Visualize key trading sessions
Track session highs and lows
Monitor overlap dynamics
Identify potential support/resistance levels (session highs/lows)

ICT Macro Sessions by @zeusbottradingICT Macro Sessions Indicator
The ICT Macro Sessions Indicator is a powerful tool designed for traders who follow the ICT (Inner Circle Trader) methodology and want to optimize their trading during specific high-probability time intervals. This indicator highlights all the key macro sessions throughout the trading day in the GMT+8 (Hong Kong) time zone.
What Does the Indicator Do?
This indicator visually marks ICT Macro Sessions on your trading chart using background colors and optional labels. Each session corresponds to specific time intervals when institutional activity is most likely to drive price action. By focusing on these periods, traders can align their strategies with market volatility and liquidity, increasing their chances of success.
Highlighted Sessions
The indicator covers all major ICT Macro Sessions, each with a unique color for easy identification:
London Macro 1 (15:33–16:00 GMT+8):
- Marks the early London session, often characterized by strong directional moves.
London Macro 2 (17:03–17:30 GMT+8):
- Captures the mid-London session, where price frequently reacts to liquidity levels.
New York AM Macro 1 (22:50–23:10 GMT+8):
- Highlights the start of the New York session, a prime time for price reversals or continuations.
New York AM Macro 2 (23:50–00:10 GMT+8):
- Focuses on late-morning New York activity, often aligning with key news releases.
New York Lunch Macro (00:50–01:10 GMT+8):
- Covers the lunch period in New York, where price may consolidate or set up for afternoon moves.
New York PM Macro 1 (02:10–02:40 GMT+8):
- Tracks post-lunch activity in New York, often featuring renewed volatility.
New York PM Macro 2 (04:15–04:45 GMT+8):
- Captures late-session moves as institutional traders finalize their positions.
Features of the Indicator
Fixed Time: The indicator is pre-configured for GMT+8 but it will adapt automatically to your timezone. No need to change anything in the code.
Background Highlighting: Each session is visually marked with a unique background color for quick recognition.
Optional Labels: Traders can enable or disable labels for each session, providing flexibility in how information is displayed.
Session Toggles: You can choose which sessions to display based on your trading preferences and strategy.
Intraday Timeframes: The indicator is optimized for intraday charts with timeframes of 45 minutes or less. You can change it to anything you like.
Why Use This Indicator?
The ICT Macro Sessions Indicator helps traders focus on the most critical times of the trading day when institutional activity is at its peak. These periods often coincide with significant price movements, making them ideal for scalping, day trading, or even swing trading setups. By visually highlighting these sessions, the indicator eliminates guesswork and allows traders to plan their trades with precision.

SessionsOverview of the "Sessions" Indicator
The "Sessions" indicator is a powerful tool designed for traders who want to visualize and analyze the market activity during different global trading sessions directly on their charts. This indicator highlights the London, New York, Tokyo, and Sydney sessions with distinct background colors, making it easy to see when each market is open.
Key Features
Session Visualization: The indicator provides clear visual cues for the active trading sessions, allowing traders to quickly identify periods of high market activity.
Customizable Timeframes: Users can set their preferred resolution for viewing session data, making it adaptable to any trading strategy.
Automatic Session Detection: The indicator automatically detects the start and end of each session based on specified times, updating in real-time as the market progresses.
Practical Applications
Trend Identification: By observing how prices move during specific sessions, traders can identify trends and make informed predictions about future price movements.
Volatility Analysis: Different sessions often exhibit varying levels of volatility. This indicator helps traders anticipate potential price spikes or lulls during these times.
Strategy Optimization: Traders can optimize their strategies by focusing on sessions that align with their trading style, whether it's the high volatility of the London session or the quieter Sydney session.
Market Overlap: The indicator makes it easy to see when sessions overlap, which is typically when the market experiences increased liquidity and volatility.
Conclusion
The "Sessions" indicator is an essential tool for traders looking to enhance their market analysis by visualizing global trading sessions. Whether you're a day trader seeking to capitalize on volatile market conditions or a swing trader looking for optimal entry and exit points, this indicator provides valuable insights into market dynamics.

Trading Sessions with Global HolidaysDescription:
This versatile Pine Script provides traders with a visual representation of major global trading sessions: London, New York, Sydney, Hong Kong, Tokyo, and Frankfurt. By highlighting these sessions on the chart, users can better identify optimal trading opportunities aligned with market activity.
Key Features:
Customizable Colors: Choose distinct colors for each trading session, with adjustable opacity to suit your visual preferences.
Holiday Awareness: The script takes into account significant holidays from various countries, ensuring that sessions are only highlighted when the markets are open.
Weekend Option: Users have the flexibility to display or hide weekend sessions, helping to tailor the analysis to specific trading strategies.
Session Activation: Easily enable or disable individual trading sessions based on your trading preferences, allowing for a customized experience.
Visual Clarity: With subtle color tones, the script maintains a clean and professional appearance, ensuring that the session highlights are noticeable without being overwhelming.
Perfect for: Day traders, swing traders, and anyone interested in global market dynamics. Whether you are a novice or an experienced trader, this tool enhances your ability to analyze market trends and make informed decisions.
Elevate your trading experience with this intuitive and informative Trading Sessions script!

LIT_Globas_sys - Liquidity Inducement Theorem (SMC, IDM)LIT_GLOBAL_SYS Trading Tool Documentation, is a comprehensive market analysis tool that includes all components needed for trading according to Liquidity Inducement Theorem (LIT). LIT differs from classical trading methods and is considered a highly effective and profitable strategy.
What can LIT_GLOBAL_SYS do?
--- Market Structure
The main feature of Liquidity Inducement Theorem is building the correct structure, specifically construction taking into account inducement (IDM). Thus, a new HH or LL can only form when the price has taken the first correct pullback - inducement (IDM), and after this, we understand the location of BoS (break of structure) and CHoCH (change of character).
LIT_GLOBAL_SYS automatically and perfectly displays the correct structure following all LIT rules. Looking at the indicator, a trader always understands which range the price is currently in and where it's trending at the moment. The indicator also shows dynamic (live) levels, providing a clear understanding of the market structure in real-time.
The indicator settings allow customization of each structural element according to trader preferences. For example, you can change the style, color, and shape of structural objects.
--- Correct Pullbacks and Inside Bars
In Liquidity Inducement Theorem, correct pullbacks are fundamental. The structure, order blocks, liquidity levels, order flow, and single candle order blocks (CSOB) are all built based on pullbacks.
What is a pullback?
- When the next candle updates the low of the previous candle, we can finish drawing an upward pullback
- We can start drawing a downward correct pullback when the next candle updates the low of the previous candle
- The downward movement will continue until the opposite occurs - updating the high of the previous candle
There are complexities in determining pullbacks - these are inside bars. In Liquidity Inducement Theorem, inside bars are completely ignored!
For example, in an upward movement, at some point, candles may stop updating the high and low of the previous candle and remain within the boundaries of the previous candle. Theoretically, there could be any number of such candles from 1 to infinity. In such cases, it's important to wait for the price to exit the mother candle (the candle after which other candles remained within its high and low range).
LIT_GLOBAL_SYS easily handles this and displays both pullbacks and inside bars correctly.
--- Order Blocks and Fair Value Gaps (FVG)
In Liquidity Inducement Theorem, order blocks are defined differently from classical order blocks:
1. The order block must take liquidity from the previous candle
2. The order block must have Fair Value Gaps (FVG) before it
3. Inside bars are completely ignored for both Order Blocks and FVG
4. If an OB fulfills the first condition (taking liquidity from the previous candle) but doesn't have FVG before it, this block is moved forward along the candles until there is an imbalance before it
There are two most important order blocks in LIT strategy:
1. Inducement order block (idm ob) - the first order block after Inducement
2. Extreme order block (Ext ob) - the first order block before CHoCH
LIT_GLOBAL_SYS perfectly displays correct order blocks and Fair Value Gaps following all rules. It offers full customization options:
- Specify the number of displayed OBs
- Disable all order blocks except idm ob and Ext ob
- Change block frame color and style
- Disable or modify text display in blocks
--- Single Candle Order Block (Scob)
Rules for building Scob:
1. The candle takes liquidity from the previous candle and closes within the body of the previous candle
2. The candle following the Scob candle must close its body below the previous candle
3. Scob forms in continuation of the trend movement
4. Scob completely ignores inside bars
LIT_GLOBAL_SYS accurately displays Scob as triangles and fully ignores inside bars both left and right. The menu allows complete customization of display and quantity of displayed Scobs.
--- Liquidity Lines, Order Flow, and Three-Minute Rule
Auxiliary functions include:
- Liquidity Lines -
Each pullback is marked with a line, showing where unclosed liquidity exists. Completed lines can be hidden to help predict price movement and enter trades correctly.
- Order Flow -
The indicator implements order flow by drawing a line when a pullback is broken (closed by body) in the opposite direction until the second touch. If price moves away without a second touch, the line remains, showing unclosed OF and potential price return zones.
- Three-Minute Rule -
Some LIT traders use the three-minute rule: price manipulations in the last and first three minutes of each 15-minute candle are additional entry factors, especially in the last quarter of an hourly candle. LIT_GLOBAL_SYS displays this rule only on the one-minute timeframe with symbols below for M15 and H1.
--- Trading Sessions, PDH/PDL, and EMA
The system includes:
- Trading sessions (Tokyo, Frankfurt, London, New York) with customizable time settings
- Previous Day High and Previous Day Low (pdh/pdl) levels
- Exponential Moving Average (EMA) with adjustable length
- Equilibrium display between current BoS and CHoCH levels
--- Alert System
LIT_GLOBAL_SYS includes all necessary alerts for Liquidity Inducement Theorem:
1. SCOB
2. EMA
3. BoS, ChoCh, Sweep
4. IDM
5. IDM OB and Ext OB
Users can simply check the desired alerts in the menu and activate them to receive notifications when price reaches specified zones.

Sessions Full Markets [TradingFinder] Forex Stocks Index 7 Time🔵 Introduction
In global financial markets, particularly in FOREX and stocks, precise timing of trading sessions plays a crucial role in the success of traders. Each trading session—Asian, European, and American—has its own unique characteristics in terms of volatility and trading volume.
The Asian session (Tokyo), Sydney session, Shanghai session, European session (London and Frankfurt), and American session (New York AM and New York PM) are examples of these trading sessions, each of which opens and closes at specific times.
This session indicator also includes a Time Convertor, enabling users to view FOREX market hours based on GMT, UTC, EST, and local time. Another valuable feature of this indicator is the automatic detection of Daylight Saving Time (DST), which automatically applies time changes for the New York, London, and Sydney sessions.
🔵 How to Use
The indicator also displays session times based on the exact opening and closing times for each geographic region. Users can utilize this indicator to view trading hours either locally or in UTC time, and if needed, set their own custom trading times.
Additionally, the session information table includes the start and end times of each session and whether they are open or closed. This functionality helps traders make better trading decisions by using accurate and precise time data.
Key Features of the Session Indicator
The session indicator is a versatile and advanced tool that provides several unique features for traders.
Some of these features are :
• Automatic Daylight Saving Time (DST) Detection : This indicator dynamically detects Daylight Saving Time (DST) changes for various trading sessions, including New York, London, and Sydney, without requiring manual adjustments. This feature allows traders to manage their trades without worrying about time changes.
Below are the start and end dates for DST in the New York, London, and Sydney trading sessions :
1. New York :
Start of DST: Second Sunday of March, at 2:00 AM.
End of DST: First Sunday of November, at 2:00 AM
2. London :
Start of DST: Last Sunday of March, at 1:00 AM.
End of DST: Last Sunday of October, at 2:00 AM.
3. Sydney :
Start of DST: First Sunday of October, at 2:00 AM.
End of DST: First Sunday of April, at 3:00 AM.
• Session Display Based on Different Time Zones : The session indicator allows users to view trading times based on different time zones, such as UTC, the local time of each market, or the user’s local time. This feature is especially useful for traders operating in diverse geographic regions.
• Custom Trading Time Setup : Another notable feature of this indicator is the ability to set custom trading times. Traders can adjust their own trading times according to their personal strategies and benefit from this flexibility.
• Session Information Table : The session indicator provides a complete information table that includes the exact start and end times of each trading session and whether they are open or closed. This table helps users simultaneously and accurately monitor the status of all trading sessions and make better trading decisions.
🟣 Session Trading Hours Based on Market Mode and Time Zones
The session indicator provides precise information on the start and end times of trading sessions.
These times are adjusted based on different market modes (FOREX, stocks, and TFlab suggestions) and time zones (UTC and local time) :
🟣 (FOREX Session Time) Forex Market Mode
• Sessions in UTC (DST inactive) :
Sydney: 22:00 - 06:00
Tokyo: 23:00 - 07:00
Shanghai: 01:00 - 09:00
Asia: 22:00 - 07:00
Europe: 07:00 - 16:00
London: 08:00 - 16:00
New York: 13:00 - 21:00
• Sessions in UTC (DST active) :
Sydney: 21:00 - 05:00
Tokyo: 23:00 - 07:00
Shanghai: 01:00 - 09:00
Asia: 21:00 - 07:00
Europe: 06:00 - 15:00
London: 07:00 - 15:00
New York: 12:00 - 20:00
• Sessions in Local Time :
Sydney: 08:00 - 16:00
Tokyo: 08:00 - 16:00
Shanghai: 09:00 - 17:00
Asia: 22:00 - 07:00
Europe: 07:00 - 16:00
London: 08:00 - 16:00
New York: 08:00 - 16:00
🟣 Stock Market Trading Hours (Stock Market Mode)
• Sessions in UTC (DST inactive) :
Sydney: 00:00 - 06:00
Asia: 00:00 - 06:00
Europe: 07:00 - 16:30
London: 08:00 - 16:30
New York: 14:30 - 21:00
Tokyo: 00:00 - 06:00
Shanghai: 01:30 - 07:00
• Sessions in UTC (DST active) :
Sydney: 23:00 - 05:00
Asia: 23:00 - 06:00
Europe: 06:00 - 15:30
London: 07:00 - 15:30
New York: 13:30 - 20:00
Tokyo: 00:00 - 06:00
Shanghai: 01:30 - 07:00
• Sessions in Local Time:
Sydney: 10:00 - 16:00
Tokyo: 09:00 - 15:00
Shanghai: 09:30 - 15:00
Asia: 00:00 - 06:00
Europe: 07:00 - 16:30
London: 08:00 - 16:30
New York: 09:30 - 16:00
🟣 TFlab Suggestion Mode
• Sessions in UTC (DST inactive) :
Sydney: 23:00 - 05:00
Tokyo: 00:00 - 06:00
Shanghai: 01:00 - 09:00
Asia: 23:00 - 06:00
Europe: 07:00 - 16:00
London: 08:00 - 16:00
New York: 13:00 - 21:00
• Sessions in UTC (DST active) :
Sydney: 22:00 - 04:00
Tokyo: 00:00 - 06:00
Shanghai: 01:00 - 09:00
Asia: 22:00 - 06:00
Europe: 06:00 - 15:00
London: 07:00 - 15:00
New York: 12:00 - 20:00
• Sessions in Local Time :
Sydney: 09:00 - 16:00
Tokyo: 09:00 - 15:00
Shanghai: 09:00 - 17:00
Asia: 23:00 - 06:00
Europe: 07:00 - 16:00
London: 08:00 - 16:00
New York: 08:00 - 16:00
🔵 Setting
Using the session indicator is straightforward and practical. Users can add this indicator to their trading chart and take advantage of its features.
The usage steps are as follows :
Selecting Market Mode : The user can choose one of the three main modes.
Forex Market Mode: Displays the forex market trading hours.
oStock Market Mode: Displays the trading hours of stock exchanges.
Custom Mode: Allows the user to set trading hours based on their needs.
TFlab Suggestion Mode: Displays the higher volume hours of the forex market in Asia.
Setting the Time Zone : The indicator allows displaying sessions based on various time zones. The user can select one of the following options:
UTC (Coordinated Universal Time)
Local Time of the Session
User’s Local Time
Displaying Comprehensive Session Information : The session information table includes the opening and closing times of each session and whether they are open or closed. This table helps users monitor all sessions at a glance and precisely set the best time for entering and exiting trades.
🔵Conclusion
The session indicator is a highly efficient and essential tool for active traders in the FOREX and stock markets. With its unique features, such as automatic DST detection and the ability to display sessions based on different time zones, the session indicator helps traders to precisely and efficiently adjust their trading activities.
This indicator not only shows users the exact opening and closing times of sessions, but by providing a session status table, it helps traders identify the best times to enter and exit trades. Moreover, the ability to set custom trading times allows traders to easily personalize their trading schedules according to their strategies.
In conclusion, using the session indicator ensures that traders are continuously and accurately informed of time changes and the opening and closing hours of markets, eliminating the need for manual updates to align with DST changes. These features enable traders to optimize their trading strategies with greater confidence and up-to-date information, allowing them to capitalize on opportunities in the market.

Essa's Indicator 2.0Essa's Indicator V2: Beginner's Guide
This custom TradingView indicator has been designed to help you identify key trading opportunities based on session highs/lows, volatility, and moving averages. Below is a breakdown of the main features:
1. Exponential Moving Averages (EMAs)
Fast EMA (Blue Line): Tracks the short-term market trend (default: 9-period EMA).
Slow EMA (Red Line): Tracks the longer-term market trend (default: 21-period EMA).
You can turn on/off the EMAs using the "Show EMAs" option in the settings.
EMAs help smooth out price action and give a clearer picture of trends. A crossover of the fast EMA above the slow EMA can signal an upward trend, while the reverse may indicate a downward trend.
2. Session Highs and Lows
The indicator tracks price highs and lows for three major trading sessions:
London Session (Red): Highlighted in red. Active between 08:00 and 17:00 (LDN timezone) or 03:00 and 12:00 (NY timezone).
New York Session (Blue): Highlighted in blue. Active between 12:00 and 21:00 (LDN timezone) or 07:00 and 16:00 (NY timezone).
Asia Session (Yellow): Highlighted in yellow. Active between 22:00 and 08:00 (LDN timezone) or 18:00 and 03:00 (NY timezone).
Highs and lows for each session are plotted on the chart as lines. Breakouts from these levels can signal important trading opportunities:
London High/Low: Red lines.
New York High/Low: Blue lines.
Asia High/Low: Yellow lines.
The background color also changes depending on the active session:
London: Light red background.
New York: Light blue background.
Asia: Light yellow background.
3. Breakout Alerts
You can set alerts when the price breaks above or below session highs/lows:
Break Above London High: Alert triggered when the price crosses the London session high.
Break Below London Low: Alert triggered when the price falls below the London session low.
Similar alerts exist for the New York and Asia sessions as well.
4. Volatility-Adjusted EMA
The EMAs in this indicator are adjusted based on volatility (ATR - Average True Range). This allows the EMAs to respond to market conditions more dynamically, giving you more accurate trend readings in volatile markets.
5. ZigZag Feature (Optional)
You can enable the ZigZag feature to help visualize the price action's highs and lows:
ZigZag Lines: Highlight major peaks and troughs in price movements, helping you spot trends more easily.
This is helpful for identifying reversals or trend continuations.
6. Fractal Markers
This indicator uses fractals to mark potential turning points in the market:
Green Triangles (Above the Price): Indicate up fractals (potential reversal points where the price could move upwards).
Red Triangles (Below the Price): Indicate down fractals (potential reversal points where the price could move downwards).
Fractals can be a helpful confirmation tool when identifying entry and exit points.
7. Custom Timezone Options
You can choose between London (LDN) and New York (NY) timezones in the settings to adapt the session times to your trading location. This ensures the session high/low markers are displayed correctly for your trading region.
By default, the New York (NY) timezone is enabled for FXCM charts in the UK.
For BTC charts, you will need to switch to the appropriate time zone manually.
Thanks
Essa

Simple SessionsThis is a simple sessions indicator that allows you to highlight up to 3 different sessions on your chart. This is intended for charts in any timeframe lower than the Daily timeframe. Really simple, clean, and minimalistic on purpose, intended to help and not clutter the chart.
Options/parameters:
Sessions: Check and setup beginning and end of the sessions. Up to 3 sessions at the same time.
Enable specific timezone: You can specify your exact timezone so that the sessions stay consistent even when you’re viewing different assets from different brokers that might be providing the price data in different timezones.
Show next day: Check to allow for your sessions to be viewed in advance for the following day so that you can expect your trading session in the chart (something simple, but quite useful).
Show next day input also accepts an integer value (default at 0). This numeric value is useful only for a few different assets that don’t have price data (aren’t tradable) 24 hours of each week-day. When that’s the case the calculation to show the session in the future day is not precise so with this number you can adjust it. For example, on OANDA:SPX500USD in the 30m time-frame, between 5pm and 6pm NY time there’s no price data. If you check that chart on any day at 4:30pm NY time, the next bar should be at 5pm, however since there’s no data it jumps to 6pm NY time. For that example you can set the input number to -2 and it will move the sessions to the correct time window you specified in the Sessions input.
Optional comment: This is a comment that will be shown in the status line. There’s no other use for this. It’s only helpful when you have multiple instances of the indicator for different assets for example. In that case with this comment you would be able to instantly detect which indicator is for which chart.
SessionLibrary "Session"
Helper functions for trading sessions. TradingView doesn't provide correct data when
calling some of the convenience methods like session.ismarket when you are looking at futures charts. This library corrects those mistakes by providing functions with the same names as the TradingView default properties. that reference a custom defined set of session hours for futures. It also provides a way for consumers to customize the map values by calling getSessionMap() and then overwriting (or adding) custom session definitions.
getSessionMap()
Returns a map of the futures rth & eth session hours. The map is keyed with symbol:session format (eg. ES:market or ES:overnight).
Returns: A map of futures symbols and their associated session hours.
getSessionString(session, symbol, sessionMap)
Returns a session string representing the session hours (and days) for the requested symbol (or the chart's symbol if the symbol value is not provided). If the session string is not found in the collection, it will return a blank string.
Parameters:
session (string) : A string representing the session hour being requested. One of: market (regular trading hours), overnight (extended/electronic trading hours), postmarket (after-hours), premarket
symbol (string) : The symbol to check. Optional. Defaults to chart symbol.
sessionMap (map) : The map of futures session hours. Optional. Uses default if not provided.
inSession(session, sessionMap, barsBack)
Returns true if the current symbol is currently in the session parameters defined by sessionString.
Parameters:
session (string) : A string representing the session hour being requested. One of: market (regular trading hours), overnight (extended/electronic trading hours), postmarket (after-hours), premarket
sessionMap (map) : The map of futures session hours. Optional. Uses default if not provided.
barsBack (int) : Private. Only used by futures to check islastbar. Optional. The default is 0.
ismarket(sessionMap)
Returns true if the current bar is a part of the regular trading hours (i.e. market hours), false otherwise. Works for futures (TradingView's methods do not).
Parameters:
sessionMap (map) : The map of futures session hours. Optional. Uses default if not provided.
Returns: bool
isfirstbar()
Returns true if the current bar is the first bar of the day's session, false otherwise. If extended session information is used, only returns true on the first bar of the pre-market bars. Works for futures (TradingView's methods do not).
Returns: bool
islastbar()
Returns true if the current bar is the last bar of the day's session, false otherwise. If extended session information is used, only returns true on the last bar of the post-market bars. Works for futures (TradingView's methods do not).
Returns: bool
ispremarket(sessionMap)
Returns true if the current bar is a part of the pre-market, false otherwise. On non-intraday charts always returns false. Works for futures (TradingView's methods do not).
Parameters:
sessionMap (map) : The map of futures session hours. Optional. Uses default if not provided.
Returns: bool
ispostmarket(sessionMap)
Returns true if the current bar is a part of the post-market, false otherwise. On non-intraday charts always returns false. Works for futures (TradingView's methods do not).
Parameters:
sessionMap (map) : The map of futures session hours. Optional. Uses default if not provided.
Returns: bool
isfirstbar_regular(sessionMap)
Returns true on the first regular session bar of the day, false otherwise. The result is the same whether extended session information is used or not. Works for futures (TradingView's methods do not).
Parameters:
sessionMap (map) : The map of futures session hours. Optional. Uses default if not provided.
Returns: bool
islastbar_regular(sessionMap)
Returns true on the last regular session bar of the day, false otherwise. The result is the same whether extended session information is used or not. Works for futures (TradingView's methods do not).
Parameters:
sessionMap (map) : The map of futures session hours. Optional. Uses default if not provided.
Returns: bool
isovernight(sessionMap)
Returns true if the current bar is a part of the pre-market or post-market, false otherwise. On non-intraday charts always returns false.
Parameters:
sessionMap (map) : The map of futures session hours. Optional. Uses default if not provided.
Returns: bool
getSessionHighAndLow(session, sessionMap)
Returns a tuple containing the high and low print during the specified session.
Parameters:
session (string) : The session for which to get the high & low prints. Defaults to market.
sessionMap (map) : The map of futures session hours. Optional. Uses default if not provided.
Returns: A tuple containing

Ultra SessionsThe "Ultra Sessions" indicator is designed to enhance your trading strategy by clearly marking key market sessions and their associated "kill zones" directly on your chart. This powerful tool supports multiple time zones and provides customizable alerts for session opens, closes, and critical kill zones, ensuring you never miss important market movements.
Customizable Time Zones: Align the indicator with your local time by selecting from a wide range of global time zones.
Market Session Tracking: Visually track the New York, London, and Tokyo trading sessions with distinct color-coded markers.
Kill Zones: Highlight the high-volatility periods within each session to focus on key trading opportunities.
Alert System: Receive real-time alerts for session openings, closings, and kill zones, so you stay informed without constantly monitoring the chart.
Flexible Positioning: Choose the positioning of session markers to fit your chart layout, whether at the top or bottom.
Ideal for traders who want to optimize their entry and exit points by focusing on the most active and volatile times in the market, the indicator is a must-have for any serious trading setup.

Forex Session Tracker [MacroGlide]Forex Session Tracker is a tool designed to track and visualize trading activity across the four key Forex market sessions: New York, London, Tokyo, and Sydney. The indicator helps traders see the time intervals of each session, their impact on price movements, and analyze volatility within these sessions.
Key Features:
• Session Visualization: The indicator highlights price ranges during the New York, London, Tokyo, and Sydney sessions using different colors, making data easier to visually interpret and analyze. Users can customize the color scheme for each session.
• Price Change Analysis: The indicator tracks the opening prices of each session and calculates the price changes by the session's close. This allows traders to assess market dynamics within each session and make informed trading decisions.
• Average Price Changes: The average price change for a specified number of sessions is calculated for each session, helping to identify trends and volatility levels.
• Time Zone Support: The indicator takes into account time zones, allowing users to adjust the display according to their location or use the market's time zone.
• Interactive Dashboard: The built-in dashboard shows the status of each session in real-time (active or inactive), recent price changes, and average changes, providing quick access to key information directly on the chart.
How to Use:
• Add the indicator to your chart and configure the displayed sessions according to your needs.
• Use color differentiation to easily identify active trading sessions and assess their impact on price movements.
• Monitor price changes in each session and analyze averages for a deeper understanding of market trends.
Methodology:
The indicator uses the time intervals of each trading session to calculate and display opening prices, price ranges, and price changes for the session. Based on this data, the Forex Session Tracker visualizes the session's high and low prices and calculates the average price change over the last several sessions. All data is displayed in real-time, considering the user's time zone settings or the market's time zone.
Originality and Usefulness:
Forex Session Tracker stands out for its ability to combine price change information from several key trading sessions into one indicator, providing traders with a simple and clear way to analyze market activity across different time zones.
Charts:
The indicator displays clean and clear charts, where each trading session is highlighted with its own color, making visual interpretation easier. The charts focus only on essential information for analysis: opening prices, session ranges, and price changes. The integrated dashboard provides quick access to key session metrics, such as activity status, recent price changes, and average values for the selected period. These features make the charts highly useful for rapid analysis and trading decision-making.
Enjoy the game!

World Clock [VHX]Keeping track of local times across different time zones has always been a challenge, especially when working with global markets.
But worry no more, as we now have a solution tailored for this very need. With this indicator, you can effortlessly add two different time zones to your chart, making it easier than ever to stay on top of market activity. The indicator not only shows the current date and time for the selected time zones but also integrates seamlessly with your chart, ensuring that you’re always aligned with the right market timings, no matter where you or your trades are based.
Unfortunately, the clock won't function when the market is closed.

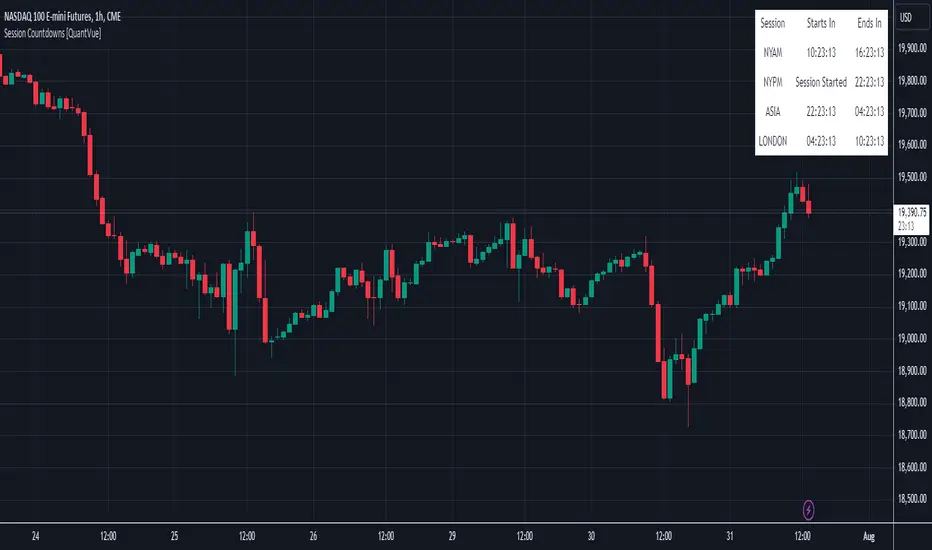
Session Countdowns [QuantVue]The Session Countdowns indicator is a powerful tool designed for traders who want to keep track of multiple trading sessions throughout the day. This indicator allows users to customize and monitor up to four different trading sessions with real-time countdowns until the session starts and ends.
Customizable Sessions:
Define up to four trading sessions with specific start and end times.
Customize session names for easy identification (e.g., NYAM, NYPM, ASIA, LONDON).
Real-Time Countdown:
Displays countdown timers for each session, showing time remaining until the session starts and ends.
Real-time updates ensure accurate and timely information.
Display Options:
Choose the display position on the chart (Top, Middle, Bottom) and alignment (Left, Center, Right).
Select table size.
Dynamic color theme adjusts the text and background colors based on the session status (upcoming, active, ending soon).
Alerts:
Receive alerts 30 minutes before a session starts, ensuring you never miss a crucial trading period.
Alerts can be customized for each session, providing timely reminders.
Give this indicator a BOOST and COMMENT your thoughts below!
We hope you enjoy.
Cheers!
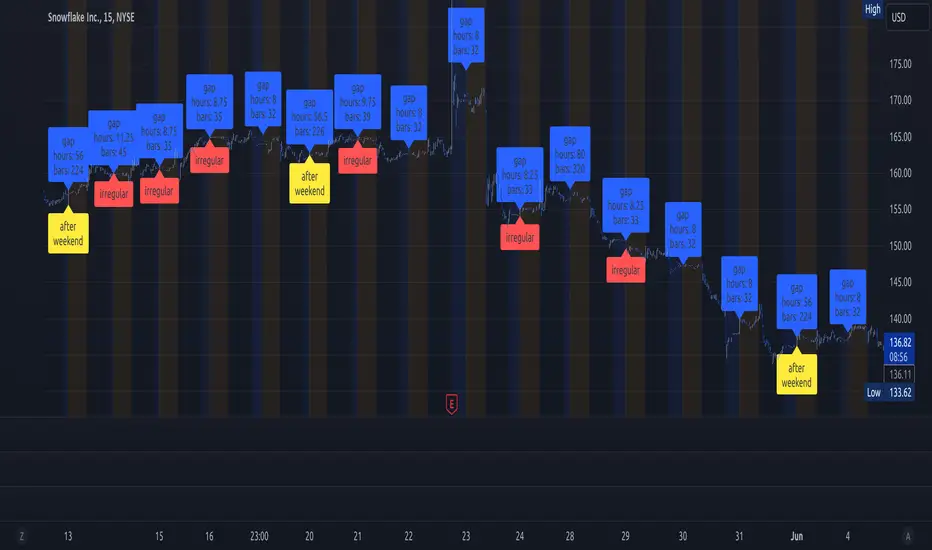
lib_session_gapsLibrary "lib_session_gaps"
simple lib to calculate the gaps between sessions
time_gap()
calculates the time gap between this and previous session (in case of irregular end of previous session, considering extended sessions)
Returns: the time gap between this and previous session in ms (time - time_close )
bar_gap()
calculates the bars missing between this and previous session (in case of irregular end of previous session, considering extended sessions)
Returns: the bars virtually missing between this and previous session (time gap / bar size in ms)
KillZones + ACD Fisher [TradingFinder] Sessions + Reversal Level🔵 Introduction
🟣 ACD Method
"The Logical Trader" opens with a thorough exploration of the ACD Methodology, which focuses on pinpointing particular price levels associated with the opening range.
This approach enables traders to establish reference points for their trades, using "A" and "C" points as entry markers. Additionally, the book covers the concept of the "Pivot Range" and how integrating it with the ACD method can help maximize position size while minimizing risk.
🟣 Session
The forex market is operational 24 hours a day, five days a week, closing only on Saturdays and Sundays. Typically, traders prefer to concentrate on one specific forex trading session rather than attempting to trade around the clock.
Trading sessions are defined time periods when a particular financial market is active, allowing for the execution of trades.
The most crucial trading sessions within the 24-hour cycle are the Asia, London, and New York sessions, as these are when substantial money flows and liquidity enter the market.
🟣 Kill Zone
Traders in financial markets earn profits by capitalizing on the difference between their buy/sell prices and the prevailing market prices.
Traders vary in their trading timelines.Some traders engage in daily or even hourly trading, necessitating activity during periods with optimal trading volumes and notable price movements.
Kill zones refer to parts of a session characterized by higher trading volumes and increased price volatility compared to the rest of the session.
🔵 How to Use
🟣 Session Times
The "Asia Session" comprises two parts: "Sydney" and "Tokyo." This session begins at 23:00 and ends at 06:00 UTC. The "Asia KillZone" starts at 23:00 and ends at 03:55 UTC.
The "London Session" includes "Frankfurt" and "London," starting at 07:00 and ending at 14:25 UTC. The "London KillZone" runs from 07:00 to 09:55 UTC.
The "New York" session starts at 14:30 and ends at 19:25 UTC, with the "New York am KillZone" beginning at 14:30 and ending at 22:55 UTC.
🟣 ACD Methodology
The ACD strategy is versatile, applicable to various markets such as stocks, commodities, and forex, providing clear buy and sell signals to set price targets and stop losses.
This strategy operates on the premise that the opening range of trades holds statistical significance daily, suggesting that initial market movements impact the market's behavior throughout the day.
Known as a breakout strategy, the ACD method thrives in volatile or strongly trending markets like crude oil and stocks.
Some key rules for employing the ACD strategy include :
Utilize points A and C as critical reference points, continually monitoring these during trades as they act as entry and exit markers.
Analyze daily and multi-day pivot ranges to understand market trends. Prices above the pivots indicate an upward trend, while prices below signal a downward trend.
In forex trading, the ACD strategy can be implemented using the ACD indicator, a technical tool that gauges the market's supply and demand balance. By evaluating trading volume and price, this indicator assists traders in identifying trend strength and optimal entry and exit points.
To effectively use the ACD indicator, consider the following :
Identifying robust trends: The ACD indicator can help pinpoint strong, consistent market trends.
Determining entry and exit points: ACD generates buy and sell signals to optimize trade timing.
Bullish Setup :
When the "A up" line is breached, it’s wise to wait briefly to confirm it’s not a "Fake Breakout" and that the price stabilizes above this line.
Upon entering the trade, the most effective stop loss is positioned below the "A down" line. It's advisable to backtest this to ensure the best outcomes. The recommended reward-to-risk ratio for this strategy is 1, which should also be verified through backtesting.
Bearish Setup :
When the "A down" line is breached, it’s prudent to wait briefly to ensure it’s not a "Fake Breakout" and that the price stabilizes below this line.
Upon entering the trade, the most effective stop loss is positioned above the "A up" line. Backtesting is recommended to confirm the best results. The recommended reward-to-risk ratio for this strategy is 1, which should also be validated through backtesting.
Advantages of Combining Kill Zone and ACD Method in Market Analysis :
Precise Trade Timing : Integrating the Kill Zone strategy with the ACD Method enhances precision in trade entries and exits. The ACD Method identifies key points for trading, while the Kill Zone focuses on high-activity periods, together ensuring optimal timing for trades.
Better Trend Identification : The ACD Method’s pivot ranges help spot market trends, and when combined with the Kill Zone’s emphasis on periods of significant price movement, traders can more effectively identify and follow strong market trends.
Maximized Profits and Minimized Risks : The ACD Method's structured approach to setting price targets and stop losses, coupled with the Kill Zone's high-volume trading periods, helps maximize profit potential while reducing risk.
Robust Risk Management : Combining these methods provides a comprehensive risk management strategy, strategically placing stop losses and protecting capital during volatile periods.
Versatility Across Markets : Both methods are applicable to various markets, including stocks, commodities, and forex, offering flexibility and adaptability in different trading environments.
Enhanced Confidence : Using the combined insights of the Kill Zone and ACD Method, traders gain confidence in their decision-making process, reducing emotional trading and improving consistency.
By merging the Kill Zone’s focus on trading volumes and the ACD Method’s structured breakout strategy, traders benefit from a synergistic approach that enhances precision, trend identification, and risk management across multiple markets.

ICT KillZones + Pivot Points [TradingFinder] Support/Resistance 🟣 Introduction
Pivot Points are critical levels on a price chart where trading activity is notably high. These points are derived from the prior day's price data and serve as key reference markers for traders' decision-making processes.
Types of Pivot Points :
Floor
Woodie
Camarilla
Fibonacci
🔵 Floor Pivot Points
Widely utilized in technical analysis, floor pivot points are essential in identifying support and resistance levels. The central pivot point (PP) acts as the primary level, suggesting the trend's likely direction.
The additional resistance levels (R1, R2, R3) and support levels (S1, S2, S3) offer further insight into potential trend reversals or continuations.
🔵 Camarilla Pivot Points
Featuring eight distinct levels, Camarilla pivot points closely correspond with support and resistance, making them highly effective for setting stop-loss orders and profit targets.
🔵 Woodie Pivot Points
Similar to floor pivot points, Woodie pivot points differ by placing greater emphasis on the closing price, often resulting in different pivot levels compared to the floor method.
🔵 Fibonacci Pivot Points
Fibonacci pivot points combine the standard floor pivot points with Fibonacci retracement levels applied to the previous trading period's range. Common retracement levels used are 38.2%, 61.8%, and 100%.
🟣 Sessions
Financial markets are divided into specific time segments, known as sessions, each with unique characteristics and activity levels. These sessions are active at different times throughout the day.
The primary sessions in financial markets include :
Asian Session
European Session
New York Session
The timing of these major sessions in UTC is as follows :
Asian Session: 23:00 to 06:00
European Session: 07:00 to 14:25
New York Session: 14:30 to 22:55
🟣 Kill Zones
Kill zones are periods within a session marked by heightened trading activity. During these times, trading volume surges and price movements become more pronounced.
The timing of the major kill zones in UTC is :
Asian Kill Zone: 23:00 to 03:55
European Kill Zone: 07:00 to 09:55
New York Kill Zone: 14:30 to 16:55
Combining kill zones and pivot points in financial market analysis provides several advantages :
Enhanced Market Sentiment Analysis : Aligns key price levels with high-activity periods for a clearer market sentiment.
Improved Timing for Trade Entries and Exits : Helps better time trades based on when price movements are most likely.
Higher Probability of Successful Trades : Increases the accuracy of predicting market movements and placing profitable trades.
Strategic Stop-Loss and Profit Target Placement : Allows for precise risk management by strategically setting stop-loss and profit targets.
Versatility Across Different Time Frames : Effective in both short and long time frames, suitable for various trading strategies.
Enhanced Trend Identification and Confirmation : Confirms trends using both pivot levels and high-activity periods, ensuring stronger trend validation.
In essence, this integrated approach enhances decision-making, optimizes trading performance, and improves risk management.
🟣 How to Use
🔵 Two Approaches to Trading Pivot Points
There are two main strategies for trading pivot points: utilizing "pivot point breakouts" and "price reversals."
🔵 Pivot Point Breakout
When the price breaks through pivot lines, it signals a shift in market sentiment to the trader. In the case of an upward breakout, where the price crosses these pivot lines, a trader might enter a long position, placing their stop-loss just below the pivot point (P).
Conversely, if the price breaks downward, a short position can be initiated below the pivot point. When using the pivot point breakout strategy, the first and second support levels can serve as profit targets in an upward trend. In a downward trend, these roles are filled by the first and second resistance levels.
🔵 Price Reversal
An alternative method involves waiting for the price to reverse at the support and resistance levels. To implement this strategy, traders should take positions opposite to the prevailing trend as the price rebounds from the pivot point.
While this tool is commonly used in higher time frames, it tends to produce better results in shorter time frames, such as 1-hour, 30-minute, and 15-minute intervals.
Three Strategies for Trading the Kill Zone
There are three principal strategies for trading within the kill zone :
Kill Zone Hunt
Breakout and Pullback to Kill Zone
Trading in the Trend of the Kill Zone
🔵 Kill Zone Hunt
This strategy involves waiting until the kill zone concludes and its high and low lines are established. If the price reaches one of these lines within the same session and is strongly rejected, a trade can be executed.
🔵 Breakout and Pullback to Kill Zone
In this approach, once the kill zone ends and its high and low lines stabilize, a trade can be made if the price breaks one of these lines decisively within the same session and then pulls back to that level.
🔵 Trading in the Trend of the Kill Zone
Kill zones are characterized by high trading volumes and strong trends. Therefore, trades can be placed in the direction of the prevailing trend. For instance, if an upward trend dominates this area, a buy trade can be entered when the price reaches a demand order block.

TimeFilterLibrary "TimeFilter"
provides utilities for dates and times
inSession(session, timezone, period)
Parameters:
session (simple string)
timezone (simple string)
period (simple string)
Returns: bool inSession Whether the current time is within the defined time session
inDateRange(startDate, endDate)
Parameters:
startDate (int)
endDate (int)
Returns: bool inRange Whether the current time is within the defined date range
isWeekDay(weekDay, timezone)
Parameters:
weekDay (int)
timezone (simple string)
Returns: bool isWeekDay Whether the provided day is the current day of the week
inWeek(useMon, useTue, useWed, useThu, useFri, useSat, useSun, timezone)
Parameters:
useMon (bool)
useTue (bool)
useWed (bool)
useThu (bool)
useFri (bool)
useSat (bool)
useSun (bool)
timezone (simple string)
Returns: bool inWeek Whether the current time is one of the defined days
filter(useRange, useSession, useWeek, inRange, inSession, inWeek)
Parameters:
useRange (bool)
useSession (bool)
useWeek (bool)
inRange (bool)
inSession (bool)
inWeek (bool)
Returns: bool filter Whether the filter matches or not

Horizontal Sessions - B A N K $This is a simple indicator that has been designed to aid intraday trading and has only 1 function;
Information ℹ️
This indicator prints Horizontal Lines in a separate chart pane above/below for the 3 main session killzones in the markets; Asia, London & New York + Optimal Exit Time.
The indicator is only visible up to and including the 1h timeframe.
Settings ⚙️
The default timings are set to perfectly align with each session killzone however the Start & End times for each session can be changed in the settings.
You can change the colour & line thickness of the horizontal lines in the settings.
