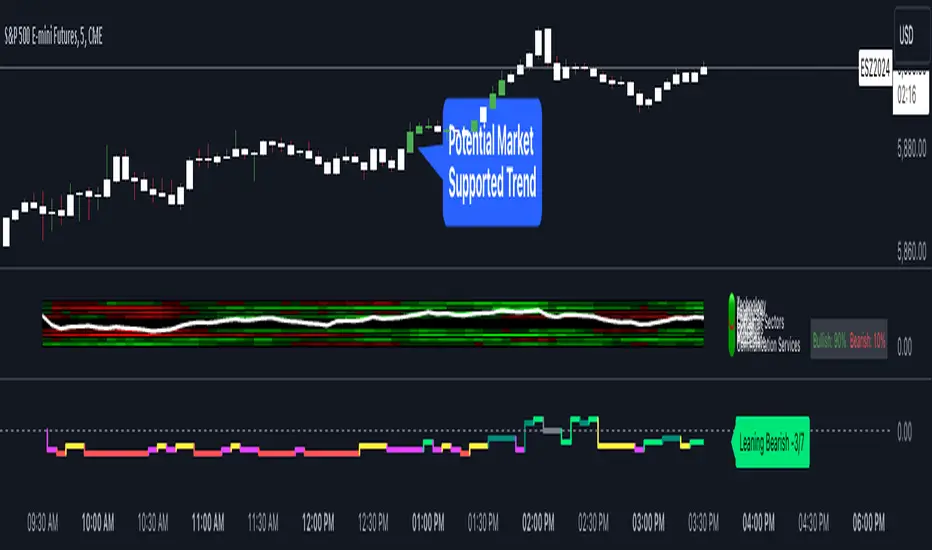
Sector Trend MapThe Sector Trend Map is a powerful tool designed to provide a sentiment heatmap for major market sectors. This indicator tracks the average trend direction across 11 key sectors, including Technology, Financials, Healthcare, Energy, and more. By monitoring each sector's sentiment, the Sector Trend Map helps traders quickly assess whether sectors are bullish or bearish, allowing for better-informed trading decisions.
This indicator plots a visual heatmap showing the sentiment strength for each sector on a scale from 0 to 100. The colors range from green for bullish sentiment to red for bearish sentiment. Additionally, it displays a real-time percentage of sectors that are bullish and bearish in a dynamic table located in the bottom right corner of the chart.
This indicator simplifies sector sentiment analysis by providing clear visual cues, making it easy to stay on top of market dynamics and make data-driven trading decisions.
Key Features:
Sentiment Heatmap: Displays a heatmap of sector sentiment ranging from bullish (green) to bearish (red).
Bullish/Bearish Percentages: A dynamic table showing the percentage of sectors that are bullish or bearish.
Tracks 11 Key Sectors: Monitors sectors such as Technology, Financials, Energy, Healthcare, and more.
Simple and Clear Visuals: Provides easy-to-read color coding for quick decision-making.
Customizable Moving Averages: Select between SMA, EMA, WMA, or DEMA for the trend calculation.
Market Hours Sensitivity: Indicator operates during regular market hours, ensuring relevance for day traders and active traders.
Overlay Sentiment Colors on Candles:
This feature allows you to overlay the sentiment (green for bullish, red for bearish) directly onto the price chart candles. You can enable or disable this option based on your preference.
How to Use the Sector Trend Map:
The heatmap is divided into different sectors. Each sector is colored based on its current sentiment:
🟢 Green (Bullish sentiment)
🔴 Red (Bearish sentiment)
Sentiment is calculated on a scale from 0 to 100, with 50 being the neutral point. Sectors above 50 are bullish, while sectors below 50 are bearish.
Bullish/Bearish Percentage Table:
A table is displayed in the bottom right corner of the screen, showing the percentage of sectors that are currently bullish and bearish.
Bullish %: The percentage of sectors above 50 on the sentiment scale.
Bearish %: The percentage of sectors below 50 on the sentiment scale.
Market Hours Activity:
The indicator only calculates and displays data during market hours (09:30 AM to 4:00 PM EST), ensuring it stays relevant to intraday trading. Outside of market hours, the indicator remains inactive.
Best Used For:
Intraday Traders: Get real-time sector sentiment during market hours and make better trading decisions based on sector strength or weakness.
Swing Traders: Monitor sector trends to spot shifts in market sentiment over time.
Sector Rotation Strategies: Use the indicator to identify which sectors are gaining or losing strength, aiding in sector rotation strategies.
Practical Example:
If 7 out of the 11 sectors display a bullish sentiment, the table will show 63.64% as bullish and 36.36% as bearish. The heatmap will show green sectors for those above the 50 sentiment threshold, allowing you to visually spot the sectors leading the market.
Sentiment
Macros ICT KillZones [TradingFinder] Times & Price Trading Setup🔵 Introduction
ICT Macros, developed by Michael Huddleston, also known as ICT (Inner Circle Trader), is a powerful trading tool designed to help traders identify the best trading opportunities during key time intervals like the London and New York trading sessions.
For traders aiming to capitalize on market volatility, liquidity shifts, and Fair Value Gaps (FVG), understanding and using these critical time zones can significantly improve trading outcomes.
In today’s highly competitive financial markets, identifying the moments when the market is seeking buy-side or sell-side liquidity, or filling price imbalances, is essential for maximizing profitability.
The ICT Macros indicator is built on the renowned ICT time and price theory, which enables traders to track and leverage key market dynamics such as breaks of highs and lows, imbalances, and liquidity hunts.
This indicator automatically detects crucial market times and optimizes strategies for traders by highlighting the specific moments when price movements are most likely to occur. A standout feature of ICT Macros is its automatic adjustment for Daylight Saving Time (DST), ensuring that traders remain synced with the correct session times.
This means you can rely on accurate market timing without the need for manual updates, allowing you to focus on capturing profitable trades during critical timeframes.
🔵 How to Use
The ICT Macros indicator helps you capitalize on trading opportunities during key market moments, particularly when the market is breaking highs or lows, filling Fair Value Gaps (FVG), or addressing imbalances. This indicator is particularly beneficial for traders who seek to identify liquidity, market volatility, and price imbalances.
🟣 Sessions
London Sessions
London Macro 1 :
UTC Time : 06:33 to 07:00
New York Time : 02:33 to 03:00
London Macro 2 :
UTC Time : 08:03 to 08:30
New York Time : 04:03 to 04:30
New York Sessions
New York Macro AM 1 :
UTC Time : 12:50 to 13:10
New York Time : 08:50 to 09:10
New York Macro AM 2 :
UTC Time : 13:50 to 14:10
New York Time : 09:50 to 10:10
New York Macro AM 3 :
UTC Time : 14:50 to 15:10
New York Time : 10:50 to 11:10
New York Lunch Macro :
UTC Time : 15:50 to 16:10
New York Time : 11:50 to 12:10
New York PM Macro :
UTC Time : 17:10 to 17:40
New York Time : 13:10 to 13:40
New York Last Hour Macro :
UTC Time : 19:15 to 19:45
New York Time : 15:15 to 15:45
These time intervals adjust automatically based on Daylight Saving Time (DST), helping traders to enter or exit trades during key market moments when price volatility is high.
Below are the main applications of this tool and how to incorporate it into your trading strategies :
🟣 Combining ICT Macros with Trading Strategies
The ICT Macros indicator can easily be used in conjunction with various trading strategies. Two well-known strategies that can be combined with this indicator include:
ICT 2022 Trading Model : This model is designed based on identifying market liquidity, structural price changes, and Fair Value Gaps (FVG). By using ICT Macros, you can identify the key time intervals when the market is seeking liquidity, filling imbalances, or breaking through important highs and lows, allowing you to enter or exit trades at the right moment.
Silver Bullet Strategy : This strategy, which is built around liquidity hunting and rapid price movements, can work more accurately with the help of ICT Macros. The indicator pinpoints precise liquidity times, helping traders take advantage of market shifts caused by filling Fair Value Gaps or correcting imbalances.
🟣 Capitalizing on Price Volatility During Key Times
Large market algorithms often seek liquidity or fill Fair Value Gaps (FVG) during the intervals marked by ICT Macros. These periods are when price volatility increases, and traders can use these moments to enter or exit trades.
For example, if sell-side liquidity is drained and the market fills an imbalance, the price might move toward buy-side liquidity. By identifying these moments, which may also involve breaking a previous high or low, you can leverage rapid market fluctuations to your advantage.
🟣 Identifying Liquidity and Price Imbalances
One of the important uses of ICT Macros is identifying points where the market is seeking liquidity and correcting imbalances. You can determine high or low liquidity levels in the market before each ICT Macro, as well as Fair Value Gaps (FVG) and price imbalances that need to be filled, using them to adjust your trading strategy. This capability allows you to manage trades based on liquidity shifts or imbalance corrections without needing a bias toward a specific direction.
🔵 Settings
The ICT Macros indicator offers various customization options, allowing users to tailor it to their specific needs. Below are the main settings:
Time Zone Mode : You can select one of the following options to define how time is displayed:
UTC : For traders who need to work with Universal Time.
Session Local Time : The local time corresponding to the London or New York markets.
Your Time Zone : You can specify your own time zone (e.g., "UTC-4:00").
Your Time Zone : If you choose "Your Time Zone," you can set your specific time zone. By default, this is set to UTC-4:00.
Show Range Time : This option allows you to display the time range of each session on the chart. If enabled, the exact start and end times of each interval are shown.
Show or Hide Time Ranges : Toggle on/off for visual clarity depending on user preference.
Custom Colors : Set distinct colors for each session, allowing users to personalize their chart based on their trading style.These settings allow you to adjust the key time intervals of each trading session to your preference and customize the time format according to your own needs.
🔵 Conclusion
The ICT Macros indicator is a powerful tool for traders, helping them to identify key time intervals where the market seeks liquidity or fills Fair Value Gaps (FVG), corrects imbalances, and breaks highs or lows. This tool is especially valuable for traders using liquidity-based strategies such as ICT 2022 or Silver Bullet.
One of the key features of this indicator is its support for Daylight Saving Time (DST), ensuring you are always in sync with the correct trading session timings without manual adjustments. This is particularly beneficial for traders operating across different time zones.
With ICT Macros, you can capitalize on crucial market opportunities during sensitive times, take advantage of imbalances, and enhance your trading strategies based on market volatility, liquidity shifts, and Fair Value Gaps.

ATR Trailing Stop by tactical trade 22 Oct 2024Description:
The ATR Dual Trailing Stop indicator is a versatile and powerful tool designed to help traders visualize dynamic support and resistance levels based on the Average True Range (ATR). This indicator plots two separate ATR-based trailing stops with customizable settings, providing a comprehensive view of potential market reversals and trend strength.
Key features:
Two ATR Trailing Stops: The first stop uses customizable ATR settings (default: 10-period ATR with a 3x multiplier), while the second stop uses an alternate configuration (default: 21-period ATR with a 7x multiplier).
Multi-Timeframe ATR Calculation: Regardless of the chart's time frame, the ATR is calculated based on a user-selected time frame (e.g., daily), allowing for consistent stop-loss levels even in lower time frames like 5-minute or 15-minute charts.
Visual Cues: The indicator clearly plots two trailing stop lines in different colors, making it easy to track the market’s volatility-based support and resistance areas.
No Buy/Sell Signals: This is purely a trailing stop indicator with no embedded buy/sell signals, giving traders the flexibility to use it with their preferred entry/exit strategies.
This indicator is especially useful in highly volatile markets where precise trailing stop levels are essential for managing risk and maximizing profit potential. The dual ATR configuration helps traders adapt to changing market conditions by providing two levels of stop placement: a shorter-term and a longer-term trailing stop.

Market Phases [OmegaTools]The Market Phases indicator utilizes the Detrended Price Oscillator (DPO) to assess various asset classes, bonds, or stock sectors across different market phases. It offers users the ability to monitor and compare trends in multiple markets through a normalized DPO approach, providing insights into relative overbought or oversold conditions. The indicator supports three distinct modes: "Asset Classes," "Bonds," and "Stock Sectors," allowing flexibility in market analysis based on user preference.
Key Features:
Detrended Price Oscillator (DPO) Calculation: The DPO is computed to remove longer-term trends and focus on shorter-term cyclical behavior. The indicator applies normalization using linear interpolation to smooth out the values for better comparison across different markets.
Three Analysis Modes:
Asset Classes: Compares the DPO for major asset classes, including stocks (S&P 500), bonds (US 10-Year), commodities (Gold), and the US Dollar Index (DXY).
Bonds: Analyzes the DPO across various bond categories such as investment-grade bonds (LQD), high-yield bonds (HYG), emerging market bonds (EMB), and corporate bonds.
Stock Sectors: Provides insight into key stock sectors, including Technology (XLK), Utilities (XLU), Financials (XLF), and Healthcare (XLV).
Real-Time Plotting:
The indicator plots the DPO values of the selected assets, bonds, or sectors on the chart. It provides a visual representation of the market phases, helping to identify potential market reversals or trends. Each plot is color-coded for clarity:
Blue: Asset/Sector 1
Red: Asset/Sector 2
Green: Asset/Sector 3
Orange: Asset/Sector 4
Table Display:
A dynamic table is displayed on the chart, showing the DPO values for the selected mode's assets or sectors. This allows quick comparison and evaluation of market trends.
Inputs:
DPO Length: Defines the lookback period for DPO calculation, adjustable between 10 and 500.
Normalization Length: Sets the length for normalizing the DPO values, with options ranging from 100 to 2000.
Mode: Choose between "Asset Classes," "Bonds," or "Stock Sectors" for tailored market analysis.
This tool is perfect for traders seeking to identify cyclical market phases, compare different asset classes, or monitor sector rotation dynamics. Use it to align your trading strategies with broader market trends and uncover potential trading opportunities across multiple markets.

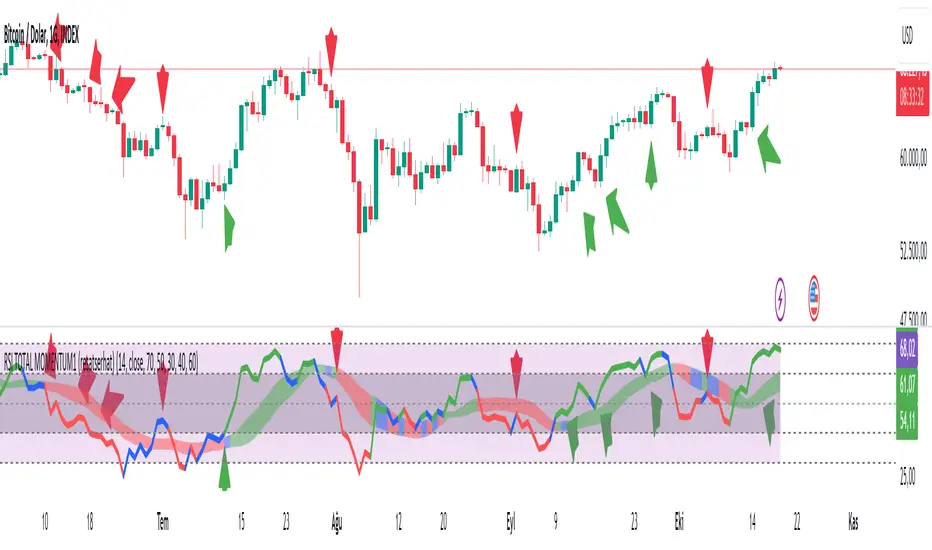
RSI TOTAL MOMENTUM1 (resatserhat)SOURCE OF COLORS
Our oscillator is the classic RSI oscillator. However, in the classic RSI oscillator, only RSI14 is taken into account, the user looks at different periods when he wants, and each period shows a different level. This situation confuses the user and prevents him from reaching a clear conclusion. This indicator takes into account the relationship between more than 1 or even 10 RSI periods, and shows us with colors which direction the momentum is in all periods and how strong it is. In other words, the mathematics underlying the coloring is the relationship between different RSI periods.
RSI COLORS
The RSI line has 3 colors: red, green, blue. The red color indicates that the momentum is weakening, the green color indicates that it is strengthening, and the blue color indicates that the momentum is unstable and can switch from red to green or from green to red at any moment.
BOLLINGER BAND COLORS
It is formed by considering the same mathematics as the RSI line colors, but it shows the momentum of larger periods. That is, it changes color later than the RSI line, but it is more reliable and accurate.
Colors in Hidden Divergences
In hidden negative divergences and hidden positive divergences, a single bar usually has an outlier color, this should be taken into consideration.
How to Use Colors?
1. When the RSI shows green bottom, blue bottom or green and blue mixed bottoms, it is a strong bullish signal.
2. When the RSI shows red top, blue top or red and blue mixed tops, it is a strong bearish signal.
3. When the RSI and BAND colors are bearish, it creates a strong signal.
4. When the RSI performs the actions in the 1st definition above the Bollinger Band, the buy signal should be trusted more.
5. When the RSI performs the actions in the 2nd definition below the Bollinger Band, the sell signal should be trusted more.
40-60 LEVELS
The 40-60 levels are strong resistance and support levels. Added for the Andrew Cardwell strategy. Blue, green or blue-green mixed bottoms occurring close to the 60 level bring strong upward movements
Red, blue or red-blue mixed tops occurring close to the 40 level bring strong downward movements.
Also in the oscillator, when RSI14 goes above the 80 level, the background color turns red. When it falls below the 20 level, the background color turns green. The first one indicates a sell zone, the second one indicates a buy zone.
TÜRKÇE
RENKLERİN KAYNAĞI
Osilatörümüz klasik RSI osilatörüdür. Fakat klasik RSI osilatöründe sadece RSI14 dikkate alınır, kullanıcı istediğinde farklı periyotlara bakar ve her periyot farklı bir seviye gösterir. Bu durum kullanıcının zihnini karıştırır, net bir kanıya varmasını önler. İşte bu indikatör 1’den hatta 10’dan fazla RSI periyodu arasındaki ilişkiyi dikkate alarak, bütün periyotlardaki momentumun hangi yönde olduğunu ve hangi güçte olduğunu renklerle bize gösterir. Yani Renklendirmenin temelinde yatan matematik farklı RSI periyotları arasındaki ilişkidir.
RSI RENKLERİ
RSI çizgisi kırmızı, yeşil, mavi olmak üzere 3 renk taşır. Kırmızı renk momentumun zayıfladığını gösterir, yeşil renk güçlendiğini, mavi renk ise momentumun kararsız olduğunu ve her an kırmızdan yeşile veya yeşilden kırmızıya geçebileceğini söyler.
BOLLİNGER BANDI RENKLERİ
RSI çizgisi renkleri ile aynı matematik dikkate alınarak oluşur, fakat daha büyük periyotların momentumunu gösterir. Yani RSI çizgisine göre daha geç renk değiştirir ama daha güvenilir ve kesindir.
Gizli Uyumsuzluklarda Renkler
Gizli negatif uyumsuzluk ve gizli pozitif uyumsuzluklarda genelde tek bir barda aykırı renk oluşur, bu husus dikkate alınmalıdır.
Renkler Nasıl Kullanılmalı?
1. RSI yeşil dip, mavi dip veya yeşil ve mavi karışımı dipler gösterdiğinde yükseliş yönlü güçlü bir sinyaldir.
2. RSI kırmızı tepe, mavi tepe veya kırmızı ve mavi karışışımı tepeler gösterdiğinde düşüş yönlü güçlü bir sinyaldir.
3. RSI ve BAND renkleri ayı olduğunda güçlü bir sinyal oluşturur.
4. RSI bollinger bandının üstünde 1. Tanımdaki eylemleri gerçekleştirdiğinde alım sinyaline daha çok güvenilmeli.
5. RSI bollinger bandının altında 2. Tanımdaki eylemleri gerçekleştirdiğinde satım sinyaline daha çok güvenilmeli.
40-60 SEVİYELERİ
40-60 seviyeleri güçlü direnç ve destek seviyeleridir. Andrew Cardwell stratejisi için eklenmiştir. 60 seviyesine yakın gerçekleşen mavi, yeşil veya mavi-yeşil karışımı dipler güçlü yükseliş hareketleri getirir
40 seviyesine yakın gerçekleşen kırmızı, mavi veya kırmızı-mavi karışımı tepeler güçlü düşüş hareketleri getirir.
Osilatörde ayrıca RSI14 80 seviyesinin üzerine çıktığında arka plan rengi kırmızıya dönüşür. 20 seviyesinin altına düştüğüne arkaplan rengi yeşile dönüşür. İlki satış bölgesi ikincisi alış bölgesi olduğunu haber eder.
ICT Professional Accumulation DistributionICT Professional Accumulation Distribution (ICT AD) provides a x-ray view into market accumulation and distribution. You can literally see the institutions at work.
The indicator consists of two cumulative lines derived from:
Cumulative change from open to close
Cumulative change from previous close to new open
By overlaying these two cumulative lines, you can detect real meaningful divergence that is narrative based not mathematically derived. You're seeing the real works of algorithms in play working in this area.
These divergences are only useful at extremes (topping or bottoming formations), not while trending. It will probably confirm your suspicion about making a important high or low.
This works on all timeframes but is most impactful on the daily.
How to use:
Method 1:
Enable the option for "Show Open vs Close."
Calculate the shift by subtracting the "Open vs Close" line value from the ICT Accumulation/Distribution (AD) line value.
Look for divergences between the two cumulative lines.
Method 2:
Switch the chart's display mode to "Line View" (representing the Open vs Close).
look for divergences between the line chart and the ICT AD line.

Chande Momentum Oscillator StrategyThe Chande Momentum Oscillator (CMO) Trading Strategy is based on the momentum oscillator developed by Tushar Chande in 1994. The CMO measures the momentum of a security by calculating the difference between the sum of recent gains and losses over a defined period. The indicator offers a means to identify overbought and oversold conditions, making it suitable for developing mean-reversion trading strategies (Chande, 1997).
Strategy Overview:
Calculation of the Chande Momentum Oscillator (CMO):
The CMO formula considers both positive and negative price changes over a defined period (commonly set to 9 days) and computes the net momentum as a percentage.
The formula is as follows:
CMO=100×(Sum of Gains−Sum of Losses)(Sum of Gains+Sum of Losses)
CMO=100×(Sum of Gains+Sum of Losses)(Sum of Gains−Sum of Losses)
This approach distinguishes the CMO from other oscillators like the RSI by using both price gains and losses in the numerator, providing a more symmetrical measurement of momentum (Chande, 1997).
Entry Condition:
The strategy opens a long position when the CMO value falls below -50, signaling an oversold condition where the price may revert to the mean. Research in mean-reversion, such as by Poterba and Summers (1988), supports this approach, highlighting that prices often revert after sharp movements due to overreaction in the markets.
Exit Conditions:
The strategy closes the long position when:
The CMO rises above 50, indicating that the price may have become overbought and may not provide further upside potential.
Alternatively, the position is closed 5 days after the buy signal is triggered, regardless of the CMO value, to ensure a timely exit even if the momentum signal does not reach the predefined level.
This exit strategy aligns with the concept of time-based exits, reducing the risk of prolonged exposure to adverse price movements (Fama, 1970).
Scientific Basis and Rationale:
Momentum and Mean-Reversion:
The strategy leverages the well-known phenomenon of mean-reversion in financial markets. According to research by Jegadeesh and Titman (1993), prices tend to revert to their mean over short periods following strong movements, creating opportunities for traders to profit from temporary deviations.
The CMO captures this mean-reversion behavior by monitoring extreme price conditions. When the CMO reaches oversold levels (below -50), it signals potential buying opportunities, whereas crossing overbought levels (above 50) indicates conditions for selling.
Market Efficiency and Overreaction:
The strategy takes advantage of behavioral inefficiencies and overreactions, which are often the drivers behind sharp price movements (Shiller, 2003). By identifying these extreme conditions with the CMO, the strategy aims to capitalize on the market’s tendency to correct itself when price deviations become too large.
Optimization and Parameter Selection:
The 9-day period used for the CMO calculation is a widely accepted timeframe that balances responsiveness and noise reduction, making it suitable for capturing short-term price fluctuations. Studies in technical analysis suggest that oscillators optimized over such periods are effective in detecting reversals (Murphy, 1999).
Performance and Backtesting:
The strategy's effectiveness is confirmed through backtesting, which shows that using the CMO as a mean-reversion tool yields profitable opportunities. The use of time-based exits alongside momentum-based signals enhances the reliability of the strategy by ensuring that trades are closed even when the momentum signal alone does not materialize.
Conclusion:
The Chande Momentum Oscillator Trading Strategy combines the principles of momentum measurement and mean-reversion to identify and capitalize on short-term price fluctuations. By using a widely tested oscillator like the CMO and integrating a systematic exit approach, the strategy effectively addresses both entry and exit conditions, providing a robust method for trading in diverse market environments.
References:
Chande, T. S. (1997). The New Technical Trader: Boost Your Profit by Plugging into the Latest Indicators. John Wiley & Sons.
Fama, E. F. (1970). Efficient Capital Markets: A Review of Theory and Empirical Work. The Journal of Finance, 25(2), 383-417.
Jegadeesh, N., & Titman, S. (1993). Returns to Buying Winners and Selling Losers: Implications for Stock Market Efficiency. The Journal of Finance, 48(1), 65-91.
Murphy, J. J. (1999). Technical Analysis of the Financial Markets: A Comprehensive Guide to Trading Methods and Applications. New York Institute of Finance.
Poterba, J. M., & Summers, L. H. (1988). Mean Reversion in Stock Prices: Evidence and Implications. Journal of Financial Economics, 22(1), 27-59.
Shiller, R. J. (2003). From Efficient Markets Theory to Behavioral Finance. Journal of Economic Perspectives, 17(1), 83-104.

Parent Session Sweeps + Alert Killzone Ranges with Parent Session Sweep
Key Features:
1. Multiple Session Support: The script tracks three major trading sessions - Asia, London, and New York. Users can customize the timing of these sessions.
2. Killzone Visualization: The strategy visually represents each session's range, either as filled boxes or lines, allowing traders to easily identify key price levels.
3. Parent Session Logic: The core of the strategy revolves around identifying a "parent" session - a session that encompasses the range of the following session. This parent session becomes the basis for potential trade setups.
4. Sweep and Reclaim Setups: The strategy looks for price movements that sweep (break above or below) the parent session's high or low, followed by a reclaim of that level. This price action often indicates a potential reversal.
5. Risk-Reward Filtering: Each potential setup is evaluated based on a user-defined minimum risk-reward ratio, ensuring that only high-quality trade opportunities are considered.
6. Candle Close Filter: An optional filter that checks the characteristics of the candle that reclaims the parent session level, adding an extra layer of confirmation to the setup.
7. Performance Tracking: The strategy keeps track of bullish and bearish setup success rates, providing valuable feedback on its performance over time.
8. Visual Aids: The script draws lines to mark the parent session's high and low, making it easy for traders to identify key levels.
How It Works:
1. The script continuously monitors price action across the defined sessions.
2. When a session fully contains the range of the next session, it's identified as a potential parent session.
3. The strategy then waits for price to sweep either the high or low of this parent session.
4. If a sweep occurs, it looks for a reclaim of the swept level within the parameters set by the user.
5. If a valid setup is identified, the script generates an alert and places a trade (if backtesting or running live).
6. The strategy continues to monitor the trade for either reaching the target (opposite level of the parent session) or hitting the stop loss.
Considerations for Signals:
- Sweep: A break of the parent session's high or low.
- Reclaim: A close back inside the parent session range after a sweep.
- Candle Characteristics: Optional filter for the reclaim candle (e.g., bullish candle for long setups).
- Risk-Reward: Each setup must meet or exceed the user-defined minimum risk-reward ratio.
- Session Timing: The strategy is sensitive to the defined session times, which should be set according to the trader's preferred time zone.
This strategy aims to capitalize on institutional order flow and liquidity patterns in the forex market, providing traders with a systematic approach to identifying potential reversal points with favorable risk-reward profiles.

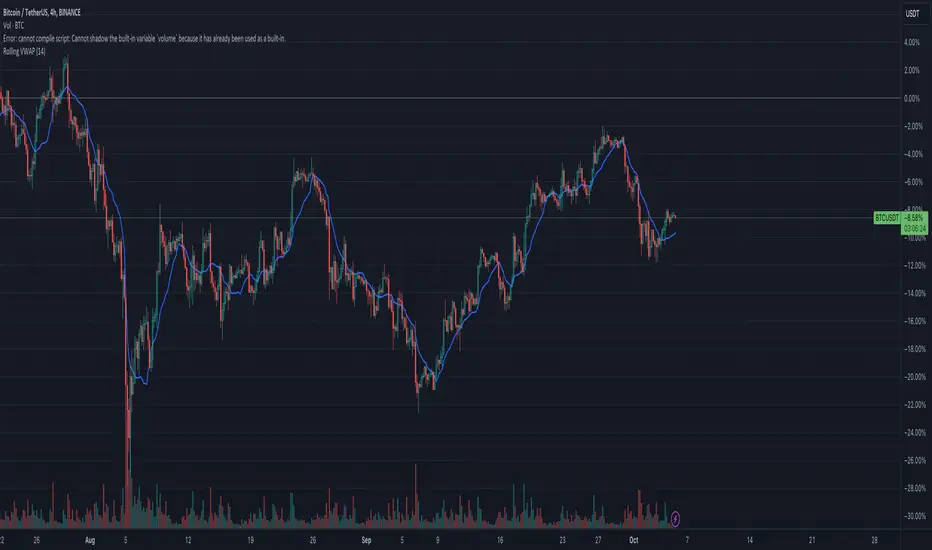
Rolling VWAPGuide for Traders
What is the Rolling VWAP?
The Volume Weighted Average Price (VWAP) is a key indicator used by traders to assess the average price of an asset, weighted by volume over a specified period. Unlike a simple moving average, the VWAP accounts for trading volume, making it a more accurate reflection of price action and market sentiment.
The Rolling VWAP in this script dynamically updates based on a user-defined period, allowing traders to view the average price over a chosen number of bars. This is particularly useful for identifying trends and potential entry or exit points in the market.
Key Benefits of Using Rolling VWAP
Better Market Insight: VWAP provides insight into where most trading is occurring, helping you gauge the strength of a price move.
Support and Resistance Levels: It often acts as dynamic support or resistance, signaling areas where price might reverse.
Trend Confirmation: A rising VWAP suggests a bullish trend, while a falling VWAP indicates a bearish trend.
Informed Entry/Exit Decisions: Use the VWAP to find entry points below it in an uptrend or exit points above it in a downtrend.
How to Use this Script:
Custom Period Input:
You can modify the "VWAP Period" to adjust the number of bars considered in the rolling calculation.
The default period is 14 bars, but you can set it based on your strategy (e.g., shorter for intraday trading, longer for swing trading).
Chart Interpretation
Bullish Signals: When the price is above the VWAP line, it suggests upward momentum, and you may consider buying opportunities.
Bearish Signals: When the price is below the VWAP, it indicates downward momentum, and you may consider selling or shorting opportunities.
Reversion to VWAP: Prices often revert to the VWAP after extended moves away from it, offering potential trade setups.
Combine with Other Indicators:
Momentum Indicators: Use with RSI, MACD, or moving averages for confirmation.
Volume Analysis: VWAP works well when combined with volume indicators to assess if a breakout is supported by high trading volume.
Customization:
Traders can customize the script's period and plot color to fit their charting preferences.
Practical Tips:
Intraday Traders: Use shorter periods (e.g., 5 or 10) to capture VWAP trends in fast-moving markets.
Swing Traders: Use longer periods (e.g., 50 or 100) to assess longer-term price and volume trends.
By integrating this Rolling VWAP into your strategy, you can better understand where the majority of trading volume has occurred, allowing you to make more informed decisions in your trading process.
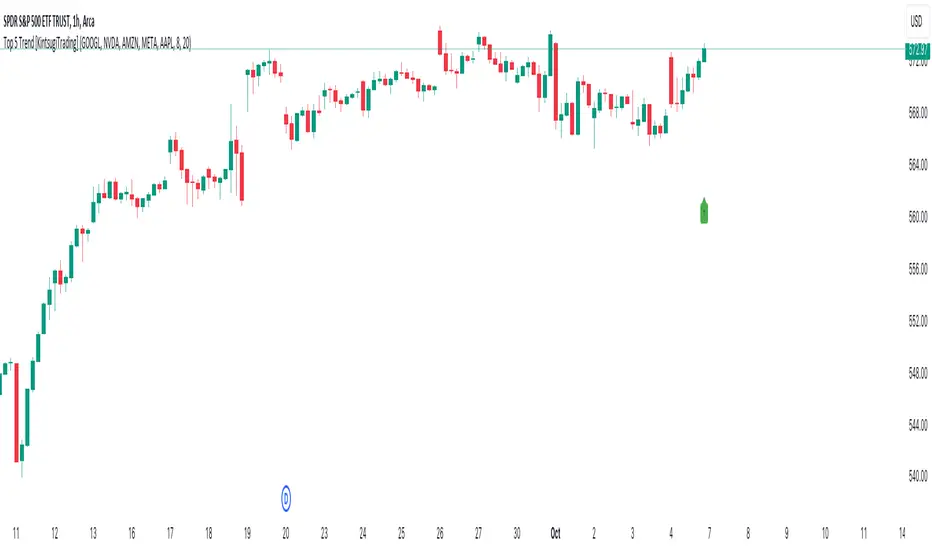
Top 5 Trend [KintsugiTrading]Top 5 Trend
This script provides a visual indicator for tracking the average trend of five selected stocks. By calculating the exponential moving average (EMA) of the closing price of the five selected stocks, the indicator helps users quickly assess overall market sentiment. The indicator's original purpose was to inform the user of the direction of the five largest stocks that make up ~25% of the S&P 500.
Key Features:
Custom Stock Selection: Choose any five stocks to monitor and visualize their combined trend.
EMA-Based Trend: The indicator compares a fast and slow EMA to determine the direction of the trend. When the fast EMA is above the slow EMA, the trend is considered bullish (uptrend); otherwise, it's bearish (downtrend).
Customizable Colors: You can easily customize the colors for both uptrends and downtrends, giving you control over the visual representation of the trend.
Trend Bar Display: For an easy, sleek, and simple reference - The script displays a trend arrow in the lower-right corner of the chart for bullish momentum and a trend arrow in the top-right corner of the chart for bearish momentum.
This indicator is perfect for traders who want to monitor the combined movement of a group of major stocks in order to easily compare strengths or weaknesses. It is a key visual aid in understanding if the overall sentiment is bullish or bearish based on the selected stocks' performance, thus making sure the user is always trading on the right side of momentum.
ATR Bands with ATR Cross + InfoTableOverview
This Pine Script™ indicator is designed to enhance traders' ability to analyze market volatility, trend direction, and position sizing directly on their TradingView charts. By plotting Average True Range (ATR) bands anchored at the OHLC4 price, displaying crossover labels, and providing a comprehensive information table, this tool offers a multifaceted approach to technical analysis.
Key Features:
ATR Bands Anchored at OHLC4: Visual representation of short-term and long-term volatility bands centered around the average price.
OHLC4 Dotted Line: A dotted line representing the average of Open, High, Low, and Close prices.
ATR Cross Labels: Visual cues indicating when short-term volatility exceeds long-term volatility and vice versa.
Information Table: Displays real-time data on market volatility, calculated position size based on risk parameters, and trend direction relative to the 20-period Smoothed Moving Average (SMMA).
Purpose
The primary purpose of this indicator is to:
Assess Market Volatility: By comparing short-term and long-term ATR values, traders can gauge the current volatility environment.
Determine Optimal Position Sizing: A calculated position size based on user-defined risk parameters helps in effective risk management.
Identify Trend Direction: Comparing the current price to the 20-period SMMA assists in determining the prevailing market trend.
Enhance Decision-Making: Visual cues and real-time data enable traders to make informed trading decisions with greater confidence.
How It Works
1. ATR Bands Anchored at OHLC4
Average True Range (ATR) Calculations
Short-Term ATR (SA): Calculated over a 9-period using ta.atr(9).
Long-Term ATR (LA): Calculated over a 21-period using ta.atr(21).
Plotting the Bands
OHLC4 Dotted Line: Plotted using small circles to simulate a dotted line due to Pine Script limitations.
ATR(9) Bands: Plotted in blue with semi-transparent shading.
ATR(21) Bands: Plotted in orange with semi-transparent shading.
Overlap: Bands can overlap, providing visual insights into changes in volatility.
2. ATR Cross Labels
Crossover Detection:
SA > LA: Indicates increasing short-term volatility.
Detected using ta.crossover(SA, LA).
A green upward label "SA>LA" is plotted below the bar.
SA < LA: Indicates decreasing short-term volatility.
Detected using ta.crossunder(SA, LA).
A red downward label "SA LA, then the market is considered volatile.
Display: Shows "Yes" or "No" based on the comparison.
b. Position Size Calculation
Risk Total Amount: User-defined input representing the total capital at risk.
Risk per 1 Stock: User-defined input representing the risk associated with one unit of the asset.
Purpose: Helps traders determine the appropriate position size based on their risk tolerance and current market volatility.
c. Is Price > 20 SMMA?
SMMA Calculation:
Calculated using a 20-period Smoothed Moving Average with ta.rma(close, 20).
Logic: If the current close price is above the SMMA, the trend is considered upward.
Display: Shows "Yes" or "No" based on the comparison.
How to Use
Step 1: Add the Indicator to Your Chart
Copy the Script: Copy the entire Pine Script code into the TradingView Pine Editor.
Save and Apply: Save the script and click "Add to Chart."
Step 2: Configure Inputs
Risk Parameters: Adjust the "Risk Total Amount" and "Risk per 1 Stock" in the indicator settings to match your personal risk management strategy.
Step 3: Interpret the Visuals
ATR Bands
Width of Bands: Wider bands indicate higher volatility; narrower bands indicate lower volatility.
Band Overlap: Pay attention to areas where the blue and orange bands diverge or converge.
OHLC4 Dotted Line
Serves as a central reference point for the ATR bands.
Helps visualize the average price around which volatility is measured.
ATR Cross Labels
"SA>LA" Label:
Indicates short-term volatility is increasing relative to long-term volatility.
May signal potential breakout or trend acceleration.
"SA 20 SMMA?
Use this to confirm trend direction before entering or exiting trades.
Practical Example
Imagine you are analyzing a stock and notice the following:
ATR(9) Crosses Above ATR(21):
A green "SA>LA" label appears.
The info table shows "Yes" for "Is ATR-based price volatile."
Position Size:
Based on your risk parameters, the position size is calculated.
Price Above 20 SMMA:
The info table shows "Yes" for "Is price > 20 SMMA."
Interpretation:
The market is experiencing increasing short-term volatility.
The trend is upward, as the price is above the 20 SMMA.
You may consider entering a long position, using the calculated position size to manage risk.
Customization
Colors and Transparency:
Adjust the colors of the bands and labels to suit your preferences.
Risk Parameters:
Modify the default values for risk amounts in the inputs.
Moving Average Period:
Change the SMMA period if desired.
Limitations and Considerations
Lagging Indicators: ATR and SMMA are lagging indicators and may not predict future price movements.
Market Conditions: The effectiveness of this indicator may vary across different assets and market conditions.
Risk of Overfitting: Relying solely on this indicator without considering other factors may lead to suboptimal trading decisions.
Conclusion
This indicator combines essential elements of technical analysis to provide a comprehensive tool for traders. By visualizing ATR bands anchored at the OHLC4, indicating volatility crossovers, and providing real-time data on position sizing and trend direction, it aids in making informed trading decisions.
Whether you're a novice trader looking to understand market volatility or an experienced trader seeking to refine your strategy, this indicator offers valuable insights directly on your TradingView charts.
Code Summary
The script is written in Pine Script™ version 5 and includes:
Calculations for OHLC4, ATRs, Bands, SMMA:
Uses built-in functions like ta.atr() and ta.rma() for calculations.
Plotting Functions:
plotshape() for the OHLC4 dotted line.
plot() and fill() for the ATR bands.
Crossover Detection:
ta.crossover() and ta.crossunder() for detecting ATR crosses.
Labeling Crossovers:
label.new() to place informative labels on the chart.
Information Table Creation:
table.new() to create the table.
table.cell() to populate it with data.
Acknowledgments
ATR and SMMA Concepts: Built upon standard technical analysis concepts widely used in trading.
Pine Script™: Leveraged the capabilities of Pine Script™ version 5 for advanced charting and analysis.
Note: Always test any indicator thoroughly and consider combining it with other forms of analysis before making trading decisions. Trading involves risk, and past performance is not indicative of future results.
Happy Trading!

Daily, Weekly, Monthly, and Quarterly High/Low LinesDescription:
This indicator draws the high and low lines for the previous day, week, month, and quarter on any timeframe chart, including lower timeframes such as minutes and hours. It allows traders to visualize key levels from higher timeframes directly on intraday charts, helping them identify potential support and resistance areas.
You can customize which lines to display—whether daily, weekly, monthly, or quarterly—and choose custom colors for each of these lines for better chart clarity. The lines are drawn using higher timeframe data, meaning that even when viewing minute or hourly charts, the lines will accurately represent the high and low of previous periods.
Features:
Customizable display: Choose whether to display Daily, Weekly, Monthly, or Quarterly lines.
Custom colors: Select colors for each timeframe’s lines for better visual clarity.
Works on all timeframes: Displays higher timeframe lines even on lower timeframes like minute and hourly charts.
Supports multiple strategies: Ideal for identifying key levels of support and resistance across multiple timeframes, whether you're a day trader or a swing trader.
How to Use:
Add the script to your chart.
Customize which lines (Daily, Weekly, Monthly, Quarterly) you want to display.
Pick custom colors for each timeframe to match your chart preferences.
Use the lines to identify potential areas of interest where the price may react based on previous high and low levels.
Ideal for:
Day traders looking for higher timeframe support and resistance on lower timeframes.
Swing traders who want to visualize important levels from multiple timeframes.
Traders of all experience levels who prefer customizable charts.
Tags:
Multi-timeframe
Support and Resistance
Day Trading
Swing Trading
Key Levels
Customizable Indicator
Technical Analysis
Intraday Trading
Higher Timeframes
Multi-timeframe Analysis

Options Oscillator [Lite] IVRank, IVx, Call/Put Volatility Skew The first TradingView indicator that provides REAL IVRank, IVx, and CALL/PUT skew data based on REAL option chain for 5 U.S. market symbols.
🔃 Auto-Updating Option Metrics without refresh!
🍒 Developed and maintained by option traders for option traders.
📈 Specifically designed for TradingView users who trade options.
🔶 Ticker Information:
This 'Lite' indicator is currently only available for 5 liquid U.S. market smbols : NASDAQ:TSLA AMEX:DIA NASDAQ:AAPL NASDAQ:AMZN and NYSE:ORCL
🔶 How does the indicator work and why is it unique?
This Pine Script indicator is a complex tool designed to provide various option metrics and visualization tools for options market traders. The indicator extracts raw options data from an external data provider (ORATS), processes and refines the delayed data package using pineseed, and sends it to TradingView, visualizing the data using specific formulas (see detailed below) or interpolated values (e.g., delta distances). This method of incorporating options data into a visualization framework is unique and entirely innovative on TradingView.
The indicator aims to offer a comprehensive view of the current state of options for the implemented instruments, including implied volatility (IV), IV rank (IVR), options skew, and expected market movements, which are objectively measured as detailed below.
The options metrics we display may be familiar to options traders from various major brokerage platforms such as TastyTrade, IBKR, TOS, Tradier, TD Ameritrade, Schwab, etc.
🟨 The following data is displayed in the oscillator 🟨
We use Tastytrade formulas, so our numbers mostly align with theirs!
🔶 𝗜𝗩𝗥𝗮𝗻𝗸
The Implied Volatility Rank (IVR) helps options traders assess the current level of implied volatility (IV) in comparison to the past 52 weeks. IVR is a useful metric to determine whether options are relatively cheap or expensive. This can guide traders on whether to buy or sell options.
IV Rank formula = (current IV - 52 week IV low) / (52 week IV high - 52 week IV low)
IVRank is default blue and you can adjust their settings:
🔶 𝗜𝗩𝘅 𝗮𝘃𝗴
The implied volatility (IVx) shown in the option chain is calculated like the VIX. The Cboe uses standard and weekly SPX options to measure expected S&P 500 volatility. A similar method is used for calculating IVx for each expiration cycle.
We aggregate the IVx values for the 35-70 day monthly expiration cycle, and use that value in the oscillator and info panel.
We always display which expiration the IVx values are averaged for when you hover over the IVx cell.
IVx main color is purple, but you can change the settings:
🔹IVx 5 days change %
We are also displaying the five-day change of the IV Index (IVx value). The IV Index 5-Day Change column provides quick insight into recent expansions or decreases in implied volatility over the last five trading days.
Traders who expect the value of options to decrease might view a decrease in IVX as a positive signal. Strategies such as Strangle and Ratio Spread can benefit from this decrease.
On the other hand, traders anticipating further increases in IVX will focus on the rising IVX values. Strategies like Calendar Spread or Diagonal Spread can take advantage of increasing implied volatility.
This indicator helps traders quickly assess changes in implied volatility, enabling them to make informed decisions based on their trading strategies and market expectations.
Important Note:
The IVx value alone does not provide sufficient context. There are stocks that inherently exhibit high IVx values. Therefore, it is crucial to consider IVx in conjunction with the Implied Volatility Rank (IVR), which measures the IVx relative to its own historical values. This combined view helps in accurately assessing the significance of the IVx in relation to the specific stock's typical volatility behavior.
This indicator offers traders a comprehensive view of implied volatility, assisting them in making informed decisions by highlighting both the absolute and relative volatility measures.
🔶 𝗖𝗔𝗟𝗟/𝗣𝗨𝗧 𝗣𝗿𝗶𝗰𝗶𝗻𝗴 𝗦𝗸𝗲𝘄 𝗵𝗶𝘀𝘁𝗼𝗴𝗿𝗮𝗺
At TanukiTrade, Vertical Pricing Skew refers to the difference in pricing between put and call options with the same expiration date at the same distance (at tastytrade binary expected move). We analyze this skew to understand market sentiment. This is the same formula used by TastyTrade for calculations.
We calculate the interpolated strike price based on the expected move, taking into account the neighboring option prices and their distances. This allows us to accurately determine whether the CALL or PUT options are more expensive.
🔹 What Causes Pricing Skew? The Theory Behind It
The asymmetric pricing of PUT and CALL options is driven by the natural dynamics of the market. The theory is that when CALL options are more expensive than PUT options at the same distance from the current spot price, market participants are buying CALLs and selling PUTs, expecting a faster upward movement compared to a downward one .
In the case of PUT skew, it's the opposite: participants are buying PUTs and selling CALLs , as they expect a potential downward move to happen more quickly than an upward one.
An options trader can take advantage of this phenomenon by leveraging PUT pricing skew. For example, if they have a bullish outlook and both IVR and IVx are high and IV started decreasing, they can capitalize on this PUT skew with strategies like a jade lizard, broken wing butterfly, or short put.
🔴 PUT Skew 🔴
Put options are more expensive than call options, indicating the market expects a faster downward move (▽). This alone doesn't indicate which way the market will move (because nobody knows that), but the options chain pricing suggests that if the market moves downward, it could do so faster in velocity compared to a potential upward movement.
🔹 SPY PUT SKEW example:
If AMEX:SPY PUT option prices are 46% higher than CALLs at the same distance for the optimal next monthly expiry (DTE). This alone doesn't indicate which way the market will move (because nobody knows that), but the options chain pricing suggests that if the market moves downward, it could do so 46% faster in velocity compared to a potential upward movement
🟢 CALL Skew 🟢
Call options are more expensive than put options, indicating the market expects a faster upward move (△). This alone doesn't indicate which way the market will move (because nobody knows that), but the options chain pricing suggests that if the market moves upward, it could do so faster in velocity compared to a potential downward movement.
🔹 INTC CALL SKEW example:
If NASDAQ:INTC CALL option prices are 49% higher than PUTs at the same distance for the optimal next monthly expiry (DTE). This alone doesn't indicate which way the market will move (because nobody knows that), but the options chain pricing suggests that if the market moves upward, it could do so 49% faster in velocity compared to a potential downward movement .
🔶 USAGE example:
The script is compatible with our other options indicators.
For example: Since the main metrics are already available in this Options Oscillator, you can hide the main IVR panel of our Options Overlay indicator, freeing up more space on the chart. The following image shows this:
🔶 ADDITIONAL IMPORTANT COMMENTS
🔹 Historical Data:
Yes, we only using historical internal metrics dating back to 2024-07-01, when the TanukiTrade options brand launched. For now, we're using these, but we may expand the historical data in the future.
🔹 What distance does the indicator use to measure the call/put pricing skew?:
It is important to highlight that this oscillator displays the call/put pricing skew changes for the next optimal monthly expiration on a histogram.
The Binary Expected Move distance is calculated using the TastyTrade method for the next optimal monthly expiration: Formula = (ATM straddle price x 0.6) + (1st OTM strangle price x 0.3) + (2nd OTM strangle price x 0.1)
We interpolate the exact difference based on the neighboring strikes at the binary expected move distance using the TastyTrade method, and compare the interpolated call and put prices at this specific point.
🔹 - Why is there a slight difference between the displayed data and my live brokerage data?
There are two reasons for this, and one is beyond our control.
◎ Option-data update frequency:
According to TradingView's regulations and guidelines, we can update external data a maximum of 5 times per day. We strive to use these updates in the most optimal way:
(1st update) 15 minutes after U.S. market open
(2nd, 3rd, 4th updates) 1.5–3 hours during U.S. market open hours
(5th update) 10 minutes before U.S. market close.
You don’t need to refresh your window, our last refreshed data-pack is always automatically applied to your indicator, and you can see the time elapsed since the last update at the bottom of the corner on daily TF.
◎ Brokerage Calculation Differences:
Every brokerage has slight differences in how they calculate metrics like IV and IVx. If you open three windows for TOS, TastyTrade, and IBKR side by side, you will notice that the values are minimally different. We had to choose a standard, so we use the formulas and mathematical models described by TastyTrade when analyzing the options chain and drawing conclusions.
🔹 - EOD data:
The indicator always displays end-of-day (EOD) data for IVR, IV, and CALL/PUT pricing skew. During trading hours, it shows the current values for the ongoing day with each update, and at market close, these values become final. From that point on, the data is considered EOD, provided the day confirms as a closed daily candle.
🔹 - U.S. market only:
Since we only deal with liquid option chains: this option indicator only works for the USA options market and do not include future contracts; we have implemented each selected symbol individually.
Disclaimer:
Our option indicator uses approximately 15min-3 hour delayed option market snapshot data to calculate the main option metrics. Exact realtime option contract prices are never displayed; only derived metrics and interpolated delta are shown to ensure accurate and consistent visualization. Due to the above, this indicator can only be used for decision support; exclusive decisions cannot be made based on this indicator. We reserve the right to make errors.This indicator is designed for options traders who understand what they are doing. It assumes that they are familiar with options and can make well-informed, independent decisions. We work with public data and are not a data provider; therefore, we do not bear any financial or other liability.
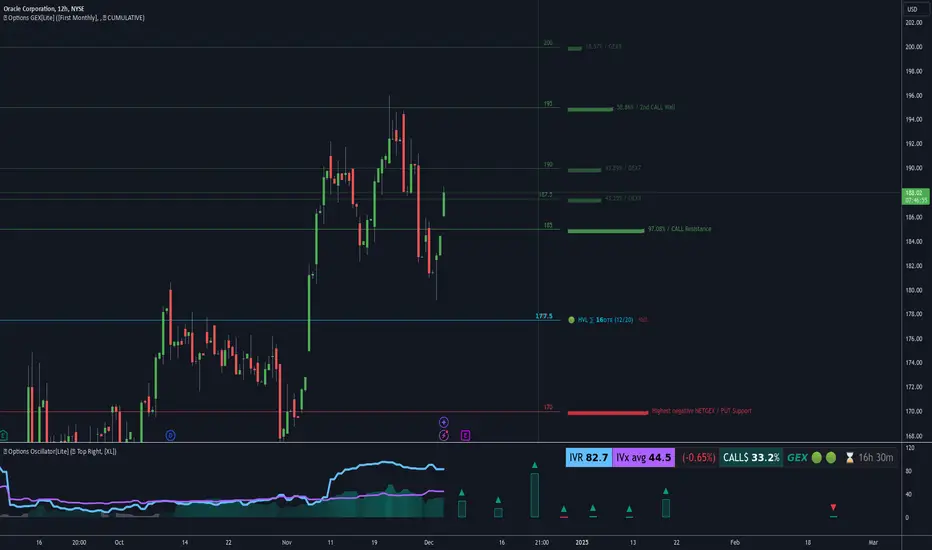
Options Oscillator [PRO] IVRank, IVx, Call/Put Volatility Skew𝗧𝗵𝗲 𝗳𝗶𝗿𝘀𝘁 𝗧𝗿𝗮𝗱𝗶𝗻𝗴𝗩𝗶𝗲𝘄 𝗶𝗻𝗱𝗶𝗰𝗮𝘁𝗼𝗿 𝘁𝗵𝗮𝘁 𝗽𝗿𝗼𝘃𝗶𝗱𝗲𝘀 𝗥𝗘𝗔𝗟 𝗜𝗩𝗥𝗮𝗻𝗸, 𝗜𝗩𝘅, 𝗮𝗻𝗱 𝗖𝗔𝗟𝗟/𝗣𝗨𝗧 𝘀𝗸𝗲𝘄 𝗱𝗮𝘁𝗮 𝗯𝗮𝘀𝗲𝗱 𝗼𝗻 𝗥𝗘𝗔𝗟 𝗼𝗽𝘁𝗶𝗼𝗻 𝗰𝗵𝗮𝗶𝗻 𝗳𝗼𝗿 𝗼𝘃𝗲𝗿 𝟭𝟲𝟱+ 𝗺𝗼𝘀𝘁 𝗹𝗶𝗾𝘂𝗶𝗱 𝗨.𝗦. 𝗺𝗮𝗿𝗸𝗲𝘁 𝘀𝘆𝗺𝗯𝗼𝗹𝘀
🔃 Auto-Updating Option Metrics without refresh!
🍒 Developed and maintained by option traders for option traders.
📈 Specifically designed for TradingView users who trade options.
🔶 Ticker Information:
This indicator is currently only available for over 165+ most liquid U.S. market symbols (eg. SP:SPX AMEX:SPY NASDAQ:QQQ NASDAQ:TLT NASDAQ:NVDA , etc.. ), and we are continuously expanding the compatible watchlist here: www.tradingview.com
🔶 How does the indicator work and why is it unique?
This Pine Script indicator is a complex tool designed to provide various option metrics and visualization tools for options market traders. The indicator extracts raw options data from an external data provider (ORATS), processes and refines the delayed data package using pineseed, and sends it to TradingView, visualizing the data using specific formulas (see detailed below) or interpolated values (e.g., delta distances). This method of incorporating options data into a visualization framework is unique and entirely innovative on TradingView.
The indicator aims to offer a comprehensive view of the current state of options for the implemented instruments, including implied volatility (IV), IV rank (IVR), options skew, and expected market movements, which are objectively measured as detailed below.
The options metrics we display may be familiar to options traders from various major brokerage platforms such as TastyTrade, IBKR, TOS, Tradier, TD Ameritrade, Schwab, etc.
🟨 The following data is displayed in the oscillator 🟨
We use Tastytrade formulas, so our numbers mostly align with theirs!
🔶 𝗜𝗩𝗥𝗮𝗻𝗸
The Implied Volatility Rank (IVR) helps options traders assess the current level of implied volatility (IV) in comparison to the past 52 weeks. IVR is a useful metric to determine whether options are relatively cheap or expensive. This can guide traders on whether to buy or sell options.
IV Rank formula = (current IV - 52 week IV low) / (52 week IV high - 52 week IV low)
IVRank is default blue and you can adjust their settings:
🔶 𝗜𝗩𝘅 𝗮𝘃𝗴
The implied volatility (IVx) shown in the option chain is calculated like the VIX. The Cboe uses standard and weekly SPX options to measure expected S&P 500 volatility. A similar method is used for calculating IVx for each expiration cycle.
We aggregate the IVx values for the 35-70 day monthly expiration cycle, and use that value in the oscillator and info panel.
We always display which expiration the IVx values are averaged for when you hover over the IVx cell.
IVx main color is purple, but you can change the settings:
🔹 IVx 5 days change %
We are also displaying the five-day change of the IV Index (IVx value). The IV Index 5-Day Change column provides quick insight into recent expansions or decreases in implied volatility over the last five trading days.
Traders who expect the value of options to decrease might view a decrease in IVX as a positive signal. Strategies such as Strangle and Ratio Spread can benefit from this decrease.
On the other hand, traders anticipating further increases in IVX will focus on the rising IVX values. Strategies like Calendar Spread or Diagonal Spread can take advantage of increasing implied volatility.
This indicator helps traders quickly assess changes in implied volatility, enabling them to make informed decisions based on their trading strategies and market expectations.
Important Note:
The IVx value alone does not provide sufficient context. There are stocks that inherently exhibit high IVx values. Therefore, it is crucial to consider IVx in conjunction with the Implied Volatility Rank (IVR), which measures the IVx relative to its own historical values. This combined view helps in accurately assessing the significance of the IVx in relation to the specific stock's typical volatility behavior.
This indicator offers traders a comprehensive view of implied volatility, assisting them in making informed decisions by highlighting both the absolute and relative volatility measures.
🔶 𝗖𝗔𝗟𝗟/𝗣𝗨𝗧 𝗣𝗿𝗶𝗰𝗶𝗻𝗴 𝗦𝗸𝗲𝘄 𝗵𝗶𝘀𝘁𝗼𝗴𝗿𝗮𝗺
At TanukiTrade, Vertical Pricing Skew refers to the difference in pricing between put and call options with the same expiration date at the same distance (at tastytrade binary expected move). We analyze this skew to understand market sentiment. This is the same formula used by TastyTrade for calculations.
We calculate the interpolated strike price based on the expected move, taking into account the neighboring option prices and their distances. This allows us to accurately determine whether the CALL or PUT options are more expensive.
🔹 What Causes Pricing Skew? The Theory Behind It
The asymmetric pricing of PUT and CALL options is driven by the natural dynamics of the market. The theory is that when CALL options are more expensive than PUT options at the same distance from the current spot price, market participants are buying CALLs and selling PUTs, expecting a faster upward movement compared to a downward one .
In the case of PUT skew, it's the opposite: participants are buying PUTs and selling CALLs , as they expect a potential downward move to happen more quickly than an upward one.
An options trader can take advantage of this phenomenon by leveraging PUT pricing skew. For example, if they have a bullish outlook and both IVR and IVx are high and IV started decreasing, they can capitalize on this PUT skew with strategies like a jade lizard, broken wing butterfly, or short put.
🔴 PUT Skew 🔴
Put options are more expensive than call options, indicating the market expects a faster downward move (▽). This alone doesn't indicate which way the market will move (because nobody knows that), but the options chain pricing suggests that if the market moves downward, it could do so faster in velocity compared to a potential upward movement.
🔹 SPY PUT SKEW example:
If AMEX:SPY PUT option prices are 46% higher than CALLs at the same distance for the optimal next monthly expiry (DTE). This alone doesn't indicate which way the market will move (because nobody knows that), but the options chain pricing suggests that if the market moves downward, it could do so 46% faster in velocity compared to a potential upward movement
🟢 CALL Skew 🟢
Call options are more expensive than put options, indicating the market expects a faster upward move (△). This alone doesn't indicate which way the market will move (because nobody knows that), but the options chain pricing suggests that if the market moves upward, it could do so faster in velocity compared to a potential downward movement.
🔹 INTC CALL SKEW example:
If NASDAQ:INTC CALL option prices are 49% higher than PUTs at the same distance for the optimal next monthly expiry (DTE). This alone doesn't indicate which way the market will move (because nobody knows that), but the options chain pricing suggests that if the market moves upward, it could do so 49% faster in velocity compared to a potential downward movement .
🔶 USAGE example:
The script is compatible with our other options indicators.
For example: Since the main metrics are already available in this Options Oscillator, you can hide the main IVR panel of our Options Overlay indicator, freeing up more space on the chart. The following image shows this:
🔶 ADDITIONAL IMPORTANT COMMENTS
🔹 Historical Data:
Yes, we only using historical internal metrics dating back to 2024-07-01, when the TanukiTrade options brand launched. For now, we're using these, but we may expand the historical data in the future.
🔹 What distance does the indicator use to measure the call/put pricing skew?:
It is important to highlight that this oscillator displays the call/put pricing skew changes for the next optimal monthly expiration on a histogram.
The Binary Expected Move distance is calculated using the TastyTrade method for the next optimal monthly expiration: Formula = (ATM straddle price x 0.6) + (1st OTM strangle price x 0.3) + (2nd OTM strangle price x 0.1)
We interpolate the exact difference based on the neighboring strikes at the binary expected move distance using the TastyTrade method, and compare the interpolated call and put prices at this specific point.
🔹 - Why is there a slight difference between the displayed data and my live brokerage data?
There are two reasons for this, and one is beyond our control.
◎ Option-data update frequency:
According to TradingView's regulations and guidelines, we can update external data a maximum of 5 times per day. We strive to use these updates in the most optimal way:
(1st update) 15 minutes after U.S. market open
(2nd, 3rd, 4th updates) 1.5–3 hours during U.S. market open hours
(5th update) 10 minutes before U.S. market close.
You don’t need to refresh your window, our last refreshed data-pack is always automatically applied to your indicator, and you can see the time elapsed since the last update at the bottom of the corner on daily TF.
◎ Brokerage Calculation Differences:
Every brokerage has slight differences in how they calculate metrics like IV and IVx. If you open three windows for TOS, TastyTrade, and IBKR side by side, you will notice that the values are minimally different. We had to choose a standard, so we use the formulas and mathematical models described by TastyTrade when analyzing the options chain and drawing conclusions.
🔹 - EOD data:
The indicator always displays end-of-day (EOD) data for IVR, IV, and CALL/PUT pricing skew. During trading hours, it shows the current values for the ongoing day with each update, and at market close, these values become final. From that point on, the data is considered EOD, provided the day confirms as a closed daily candle.
🔹 - U.S. market only:
Since we only deal with liquid option chains: this option indicator only works for the USA options market and do not include future contracts; we have implemented each selected symbol individually.
Disclaimer:
Our option indicator uses approximately 15min-3 hour delayed option market snapshot data to calculate the main option metrics. Exact realtime option contract prices are never displayed; only derived metrics and interpolated delta are shown to ensure accurate and consistent visualization. Due to the above, this indicator can only be used for decision support; exclusive decisions cannot be made based on this indicator. We reserve the right to make errors.This indicator is designed for options traders who understand what they are doing. It assumes that they are familiar with options and can make well-informed, independent decisions. We work with public data and are not a data provider; therefore, we do not bear any financial or other liability.

Enhanced Economic Composite with Dynamic WeightEnhanced Economic Composite with Dynamic Weight
Overview of the Indicator :
The "Enhanced Economic Composite with Dynamic Weight" is a comprehensive tool that combines multiple economic indicators, technical signals, and dynamic weighting to provide insights into market and economic health. It adjusts based on current volatility and recession risk, offering a detailed view of market conditions.
What This Indicator Does :
Tracks Economic Health: Uses key economic and market indicators to assess overall market conditions.
Dynamic Weighting: Adjusts the importance of components like stock indices, gold, and bonds based on volatility (VIX) and yield curve inversion.
Technical Signals: Identifies market momentum shifts through key crossovers like the Golden Cross, Death Cross, Silver Cross, and Hospice Cross.
Recession Shading: Marks known recessions for historical context.
Economic Factors Considered :
TIP (Treasury Inflation-Protected Securities): Reflects inflation expectations.
Gold: A safe-haven asset, increases in weight during volatility or rising momentum.
US Dollar Index (DXY): Measures USD strength, fixed weight of 10%, smoothed with EMA.
Commodities (DBC): Indicates global demand; weight increases with momentum or volatility.
Volatility Index (VIX): Reflects market risk, inversely related to market confidence.
Stock Indices (S&P 500, DJIA, NASDAQ, Russell 2000): Represent market performance, with weights reduced during high volatility or negative yield spread.
Yield Spread (10Y - 2Y Treasuries): Predicts recessions; negative spread reduces stock weighting.
Credit Spread (HYG - TLT): Indicates market risk through corporate vs. government bond yields.
How and Why Factors are Weighted:
Stock Indices get more weight in stable markets (low VIX, positive yield spread), while safe-haven assets like gold and bonds gain weight in volatile markets or during yield curve inversions. This dynamic adjustment ensures the composite reflects current market sentiment.
Technical Signals:
Golden Cross: 50 EMA crossing above 200 SMA, signaling bullish momentum.
Death Cross: 50 EMA below 200 SMA, indicating bearish momentum.
Silver Cross: 21 EMA crossing above 50 EMA, plotted only if below the 200-day SMA, signaling potential upside in downtrend conditions.
Hospice Cross: 50 EMA crosses below 21 EMA, plotted only if 21 EMA is below 200 SMA, a leading bearish signal.
Recession Shading:
Recession periods like the Great Recession, Early 2000s Recession, and COVID-19 Recession are shaded to provide historical context.
Benefits of Using This Indicator:
Comprehensive Analysis: Combines economic fundamentals and technical analysis for a full market view.
Dynamic Risk Adjustment: Weights shift between growth and safe-haven assets based on volatility and recession risk.
Early Signals: The Silver Cross and Hospice Cross provide early warnings of potential market shifts.
Recession Forecasting: Helps predict downturns through the yield curve and recession indicators.
Who Can Benefit:
Traders: Identify market momentum shifts early through crossovers.
Long-term Investors: Use recession warnings and dynamic adjustments to protect portfolios.
Analysts: A holistic tool for analyzing both economic trends and market movements.
This indicator helps users navigate varying market conditions by dynamically adjusting based on economic factors and providing early technical signals for market momentum shifts.

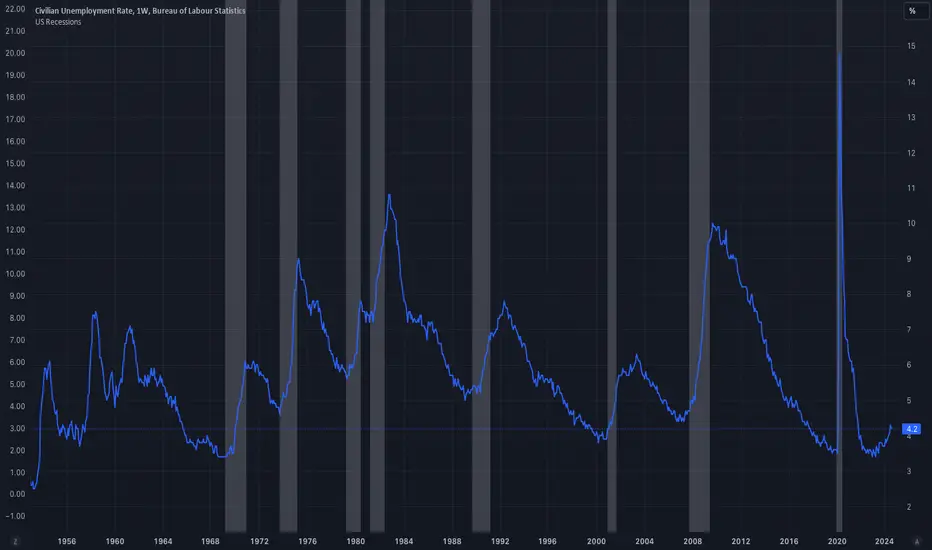
US Recessions based on James Hamilton's JHDUSRGDPBRThis simple script uses James Hamilton's JHDUSRGDPBR indicator to colour areas representing recession periods in the US. Best used in conjunction with other macroeconomics indicators, like –as in the example– unemployment rates