Pesquisar nos scripts por "香港市場主線股票市值小於200億"
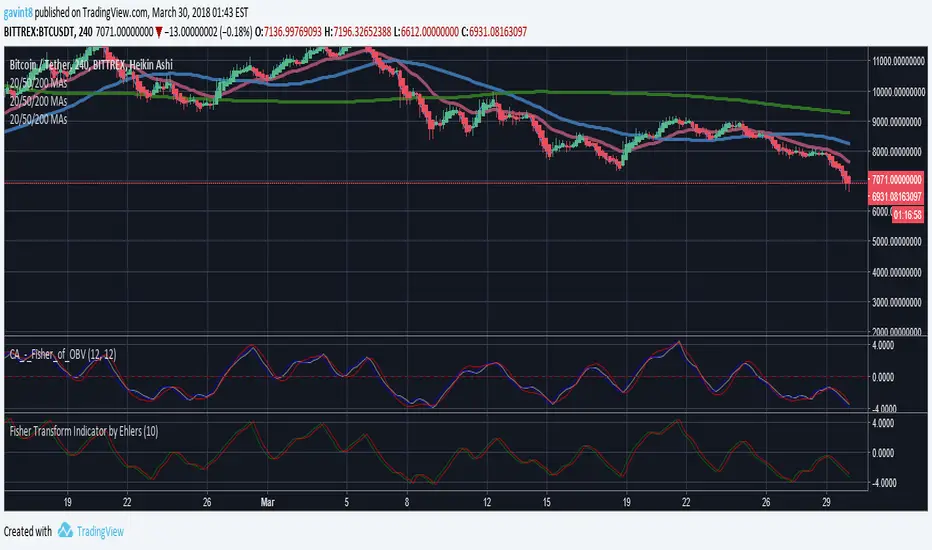
Death Cross - 200 MA / 50 Cross CheckerBITFINEX:BTCUSD
You can check if 200 day MA crossed by 50 day MA. Nuff said.
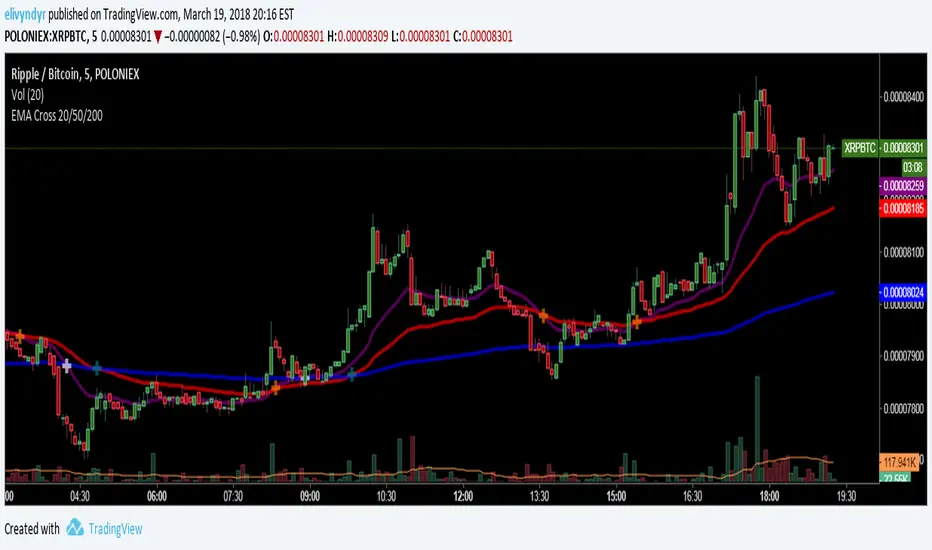
EMA Cross 20/50/200Added a 20 EMA cross to the avaiable 50/200 EMA Cross script in the public library
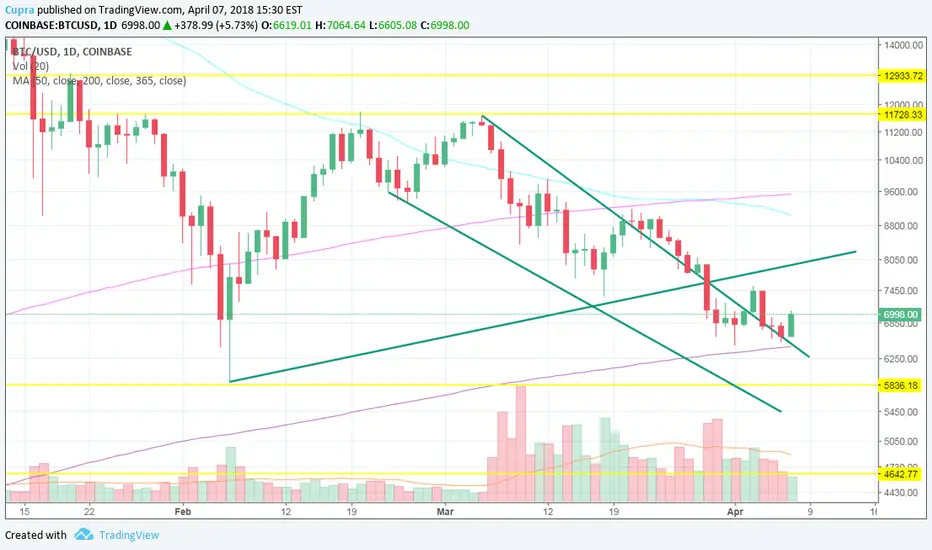
Moving Average 50/200 Golden Cross or Dead CrossA strategy is to apply two moving averages to a chart, one longer and one shorter. When the shorter MA 50 day scrosses above the longer term MA 200 days it's a buy signal as it indicates the trend is shifting up.This is known as a "golden cross."
When the shorter MA crosses below the longer term MA it's a sell signal as it indicates the trend is shifting down. This is known as a "dead/death cross"
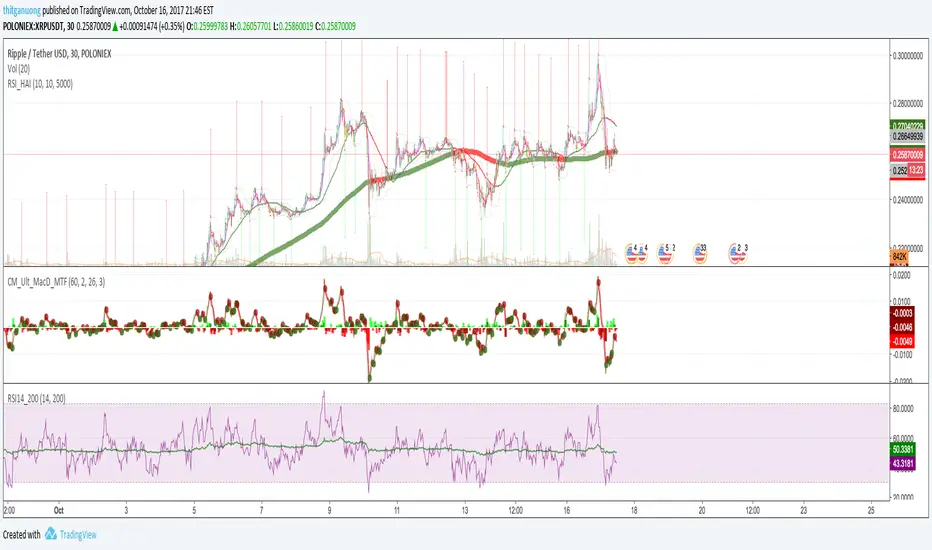
For cryptocurrencies use 4 hour charts.


50, 100, 200 EMAsA simple script that displays the 50, 100, and 200-period exponential moving averages. Reduce clutter by combining them into one indicator!

50, 100, 200 SMAsA simple script that displays the 50, 100, and 200-period simple moving averages. Reduce clutter by combining them into one indicator!

50,100,200 MA by CryptoLife71(FIXED)Updated the code by CryptoLife71 so that the 200ma shows correctly.

Dieyson daytrade EMA 9+20+200+VWAP and bar & line colorDieyson daytrade EMA 9 + EMA20 + EMA 200 + VWAP


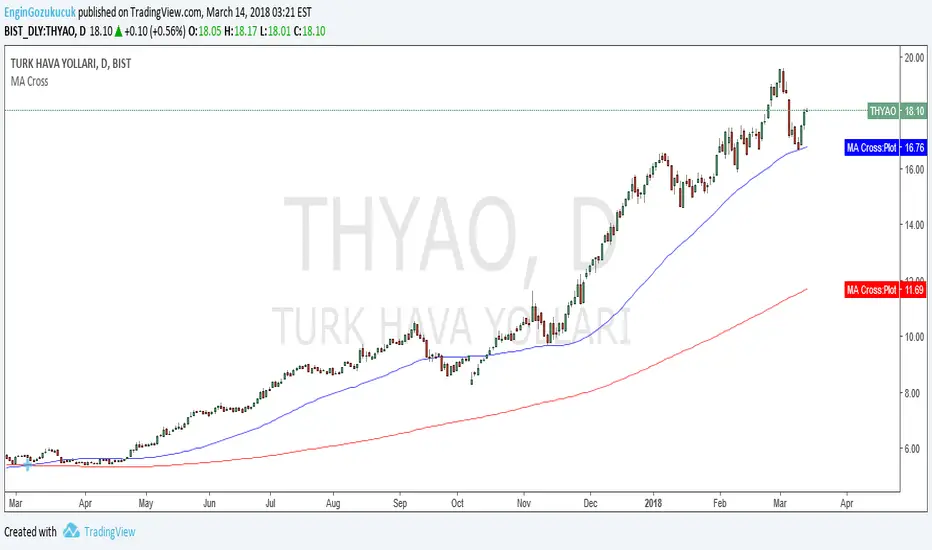
MA Cross 50/200 - Moving Averageindicates short-term 50-day moving average AND long-term 200-day moving average CROSS
@GateTicker


DECL: 3 X Moving Average (50, 100 and 200 day)Basic Moving Average with 3 different intervals. Default: 50 day (blue), 100 day (red) and 200 day (purple)