JP225 Influence AnalyzerThis tool provides a way to assess how USDJPY and DJIA influence JP225, using standardization and linear regression for quantitative evaluation. It also detects deviations from the linear model and displays the results in a colored table.
Table Structure
Row 1: Current value of USDJPY and its change from the previous bar
Row 2: Current value of DJIA and its change from the previous bar
Row 3: Theoretical value of Nikkei 225 calculated using the least squares method from USDJPY
and DJIA, and its change from the previous bar
Row 4: Current value of the chart symbol (Nikkei 225) and its change from the previous bar
Background Color Meanings
A. Current Value Column (Column 2)
If USDJPY or DJIA significantly contributes to the change in the theoretical value of Nikkei 225, the cell turns blue (increase) or red (decrease). The threshold is 1.5.
If the current value of Nikkei 225 increases, it turns blue; if it decreases, it turns red.
B. Change Value Column (Column 3)
If there is a discrepancy between the change in the theoretical value and the actual change of Nikkei 225, the cell turns yellow (moderate discrepancy: threshold 20) or red (significant discrepancy: threshold 50).
Judgment Based on Current Value Column (Column 2)
If the color of USDJPY or DJIA matches the color of Nikkei 225, that symbol is the main cause.
If there is no match, the main cause is "other factors."
Judgment Based on Change Column (Column 3)
Yellow: Suggests that other factors may be influencing the price.
Red: Strongly indicates that other factors are the main cause.
Parameter Descriptions Parameter Descriptions
symbol_x: Symbol for USDJPY (default: "SAXO:USDJPY")
symbol_y: Symbol for DJIA (default: "OSE:DJIA1!")
threshold_value1: Threshold for determining the influence of USDJPY and DJIA (blue/red color) (default: 1.5)
threshold_value2: Threshold for detecting specific price movements in Nikkei 225 (yellow color) (default: 20)
threshold_value3: Threshold for detecting significant price movements in Nikkei 225 (red color) (default: 50)
data_count: Number of past data points used for calculations (default: 10)
インジケーターの概要
このインジケーターは、日経225先物やCFDの値動きの主な原因が
以下のどれに起因するのかをリアルタイムで表示します
1. ドル円 (USDJPY)
2. ダウ (DJIA)
3. その他の要因(突発的なニュース、225の節目価格への攻防など)
テーブルの構成
1行目 ドル円の現在値と前足からの増減
2行目 ダウの現在値と前足からの増減
3行目 ドル円とダウから最小二乗法で算出した225の理論値とその増減
4行目 チャート銘柄(225)の現在値と前足からの増減
背景色の意味
1. 現在値列 (2列目):ドル円またはダウが225の理論値増減に大きく寄与した場合、
それぞれ青(増加)または赤(減少)に変化。閾値は1.5
225の現在値が増加すれば青、減少すれば赤。
2. 増減値列 (3列目):225の理論値増減と実際の増減が乖離した場合、
黄(中程度:閾値は20)または赤(大幅:閾値は50)に変化。
現在値列(2列目)での判断:
1. 銘柄(ドル円またはダウ)の色が225の色と一致する場合、その銘柄が主な原因。
2. 一致しない場合、主な原因は「その他」。
増減列(3列目)での判断:
黄色 その他の要因が影響している可能性。
赤色 その他の要因が主な原因と強く示唆。
パラメータの説明
symbol_x ドル円のシンボル(デフォルト: "SAXO:USDJPY")
symbol_y ダウのシンボル(デフォルト: "OSE:DJIA1!")
threshold_value1 ドル円とダウの影響を判定する(青/赤色)閾値(デフォルト: 1.5)
threshold_value2 225固有の値動きを判定する(黄色)閾値(デフォルト: 20)
threshold_value3 225固有の大きな値動きを判定する(赤色)閾値(デフォルト: 50)
data_count 計算に使用する過去データの本数(デフォルト: 10)
Pesquisar nos scripts por "量比大于10+外盘大于内盘+股票市场含义"

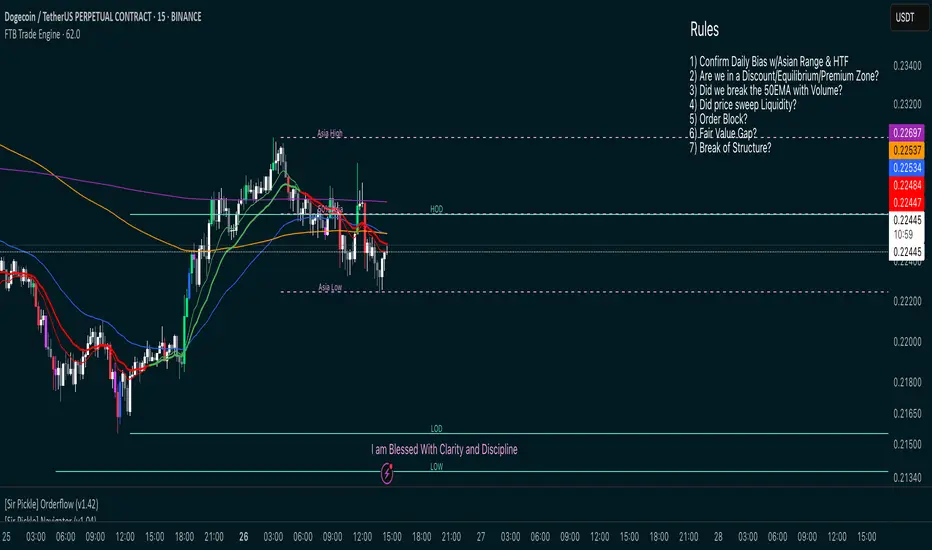
FTB Smart Trader System — Market Maker Levels, EMAs & VectorsThe FTB Trade Engine is an indicator suite I built for myself as a crypto trader. It's designed specifically for trading Institution levels, EMAs, PVSRA Volume Candles, and Session Timings. It helps me spot high probability trade setups without overcomplicating things.
🔑 Features of this Indicator
📌 🔥 Key Session Levels (extend lines in settings as needed)
✅ Weekly High & Low (HOW/LOW) — Automatically plots the previous week's high and low
✅ Daily High & Low (HOD/LOD) — Marks the prior day's range
✅ Asia Session High & Low — Plots the Asian session’s high and low, helping you detect potential breakouts or fakeouts, as Asia often sets the initial high and low of the day.
✅ 50% Asia Level — Automatically calculates and displays the midpoint between Asia’s high and low, an important level for intraday trading.
📌 🔥 Advanced EMA Suite
✅ Includes 10, 20, 50, 200, and 800 EMAs — providing key zones of support, resistance, and trend direction.
👀 Good to know: the break of the 50EMA WITH a vector candle is significant for reversals.
📌 🔥 PVSRA Candles
(👀 IMPORTANT: To properly view PVSRA candles, make sure to UNCHECK all default candle settings — Color Bars, Body, Borders, and Wick — in your chart's candle settings.)
✅ Price, Volume, Support & Resistance Analysis (PVSRA) Candles — These special candles combine price action with volume analysis, color-coded to highlight areas potentially influenced by market makers, institutions, and large players. Perfect for identifying key volume zones and quickly analyzing any coin or pair without switching tools.
Candle Colors Explained:
Bullish Candles:
🟢 Green — 200% increase in volume on bullish moves (strong buyer presence).
🔵 Blue — 150% increase in bullish volume, but may also indicate fatigue or possible reversal.
⚪ White — Normal bullish volume (standard green candles).
Bearish Candles:
🔴 Red — 200% increase in bearish volume compared to the last 10 candles (strong selling).
🟣 Magenta — 150% increase in bearish volume, signaling possible continuation or exhaustion.
⚫ Gray — Normal bearish volume (standard red candles).
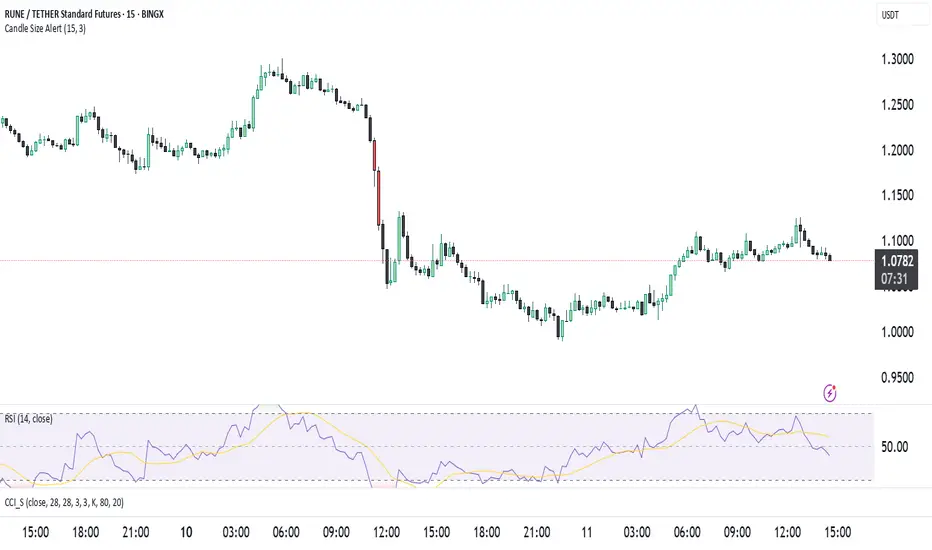
Candle Size Alertت وضیحات برای انتشار ابزار در TradingView
🔹 نام ابزار: Candle Size Alert
🔹 توضیحات:
این اندیکاتور برای شناسایی کندلهای بزرگ طراحی شده است. این ابزار میانگین اندازهی ۱۰ کندل گذشته را محاسبه کرده و اگر کندل فعلی ۳ برابر میانگین کندلهای قبلی باشد، یک لیبل هشدار در بالای کندل نمایش میدهد. همچنین میتوان هشدارهای معاملاتی را از طریق alertcondition() فعال کرد.
🔹 ویژگیها:
✅ امکان تغییر تعداد کندلهای محاسبه شده (پیشفرض: ۱۰)
✅ امکان تنظیم ضریب حساسیت (پیشفرض: ۳ برابر)
✅ نمایش لیبل هشدار در بالای کندلهای بزرگ
✅ پشتیبانی از هشدارهای خودکار (AlertCondition)
⚠️ نکته: این اندیکاتور فقط برای تحلیل استفاده میشود و سیگنال خرید یا فروش ارائه نمیدهد.
🔹 Indicator Name: Candle Size Alert
🔹 Description:
This indicator detects large candles by calculating the average size of the last 10 candles. If the current candle is 3 times larger than the average of the previous candles, a warning label appears above the candle. Additionally, automated alerts can be triggered using alertcondition().
🔹 Features:
✅ Adjustable candle count for calculations (default: 10)
✅ Customizable sensitivity multiplier (default: 3x)
✅ Visual alert label above large candles
✅ Supports automated alerts (AlertCondition)
⚠️ Note: This indicator is for analysis purposes only and does not provide buy/sell signals.
Liquidity Hunt SwiftEdgeThe "Liquidity Hunt Dashboard By SwiftEdge" indicator is designed to assist traders in identifying potential liquidity zones by placing a dynamic target line based on swing points and weighted liquidity. It leverages technical analysis tools such as SMA (Simple Moving Average), pivot points, and volume to predict market movements and provides daily statistics on hits and success rate. The target line updates automatically when the price hits it, adapting to the market trend (up, down, or neutral). A dashboard displays the current price, target level, prediction, and trend, making it easy to make informed trading decisions.
Features:
Target Line: A yellow dashed line marks the next expected liquidity level (up to approximately 20 pips away on 1m).
Prediction: Displays "Up (Chasing Sell Liquidity)," "Down (Chasing Buy Liquidity)," or "Neutral" based on trend and liquidity.
Daily Statistics: Tracks hits and success rate, resetting daily.
Trend Indicator: Shows market direction ("Up," "Down," or "Neutral") in the dashboard.
Dynamic Updates: The line moves to a new target level when the price hits the current target.
Recommended Settings for 1-Minute Timeframe:
For Indices (e.g., S&P 500):
Lookback Period: 180 (3 hours to capture more stable swing points).
Max Distance (%): 0.015 (approximately 15 pips, suitable for indices).
Cooldown Period: 5 (stabilizes after hits).
Line Duration: 60 (displays the line for 1 hour).
For Crypto (e.g., BTC/USD):
Lookback Period: 120 (2 hours to capture short-term swing points).
Max Distance (%): 0.024 (approximately 20 pips, suitable for volatile crypto markets).
Cooldown Period: 5.
Line Duration: 60.
For Forex (e.g., EUR/USD):
Lookback Period: 180 (3 hours for greater data density in less volatile markets).
Max Distance (%): 0.012 (approximately 10-12 pips, suitable for forex).
Cooldown Period: 5.
Line Duration: 60.
Guide for Higher Timeframes:
This indicator can be adapted for higher timeframes (e.g., 5m, 15m, 1H) by adjusting the settings to account for larger price movements and slower market dynamics. Follow these steps:
Select Your Timeframe: Switch your chart to the desired timeframe (e.g., 5m, 15m, or 1H).
Adjust Lookback Period: Increase the "Lookback Period" to cover a longer historical period. For example:
5m: Set to 360 (equivalent to 6 hours).
15m: Set to 480 (equivalent to 8 hours).
1H: Set to 720 (equivalent to 12 hours).
Adjust Max Distance (%): Higher timeframes require larger targets to account for bigger price swings. For example:
5m: Increase to 0.05 (approximately 50 pips).
15m: Increase to 0.1 (approximately 100 pips).
1H: Increase to 0.2 (approximately 200 pips).
Adjust Cooldown Period: On higher timeframes, you may want a longer cooldown to avoid frequent updates. For example:
5m: Set to 10.
15m: Set to 15.
1H: Set to 20.
Adjust Line Duration: Extend the duration the line is displayed to match the timeframe. For example:
5m: Set to 120 (equivalent to 10 hours).
15m: Set to 240 (equivalent to 60 hours).
1H: Set to 480 (equivalent to 20 days).
Monitor the Dashboard: The dashboard will still show the target level, prediction, and trend, but the values will now reflect the larger timeframe's dynamics.
Usage Instructions:
Set your chart to a 1-minute timeframe (or follow the higher timeframe guide).
Adjust the settings based on the market and timeframe (see recommendations above).
Monitor the dashboard for the current price, target level, and prediction.
Use the yellow line as a potential entry or exit level, and adjust your strategy based on the trend and statistics.
Notes:
This indicator is intended solely for educational and analytical purposes and should not be considered financial advice.
Test the indicator on a demo account before using it with real funds.
The indicator complies with TradingView guidelines by not providing trading advice, automated trading signals, or guarantees of profit.

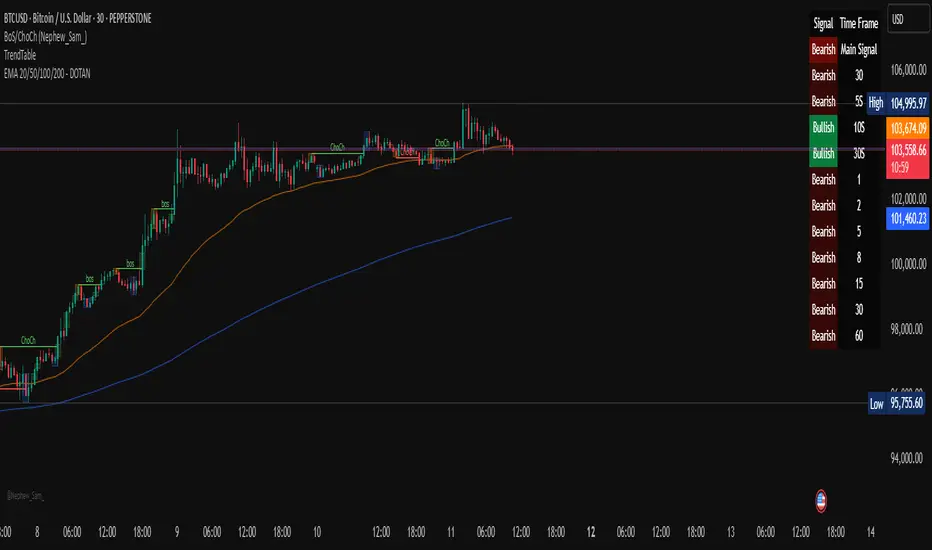
Multi-Timeframe Trend Table - DOTANMulti Timeframe Trend Signal table - Wizord_KS
"Multi-Timeframe Trend Table"
This Pine Script indicator displays a table on the TradingView chart that shows the trend direction (Bullish/Bearish) across multiple timeframes. The trend is determined using a Simple Moving Average (SMA).
🔹 Key Features of the Script
Calculates trend direction based on SMA for:
The current timeframe.
10 different user-defined timeframes.
Determines a "Main Signal" based on trend strength:
Counts the number of bullish and bearish trends across all timeframes.
Uses this count to generate an overall market sentiment (Bullish, Bearish, or Neutral).
The strength of the main signal determines its background transparency.
Displays a table in the top-right corner of the chart showing:
The main trend signal (aggregated from multiple timeframes).
The trend for the current timeframe.
The trend for each of the 10 selected timeframes.
Dual SuperTrend w VIX Filter - Strategy [presentTrading]Hey everyone! Haven't been here for a long time. Been so busy again in the past 2 months. I recently started working on analyzing the combination of trend strategy and VIX, but didn't get outstanding results after a few tries. Sharing this tool with all of you in case you have better insights.
█ Introduction and How it is Different
The Dual SuperTrend with VIX Filter Strategy combines traditional trend following with market volatility analysis. Unlike conventional SuperTrend strategies that focus solely on price action, this experimental system incorporates VIX (Volatility Index) as an adaptive filter to create a more context-aware trading approach. By analyzing where current volatility stands relative to historical norms, the strategy adjusts to different market environments rather than applying uniform logic across all conditions.
BTCUSD 6hr Long Short Performance
█ Strategy, How it Works: Detailed Explanation
🔶 Dual SuperTrend Core
The strategy uses two SuperTrend indicators with different sensitivity settings:
- SuperTrend 1: Length = 13, Multiplier = 3.5
- SuperTrend 2: Length = 8, Multiplier = 5.0
The SuperTrend calculation follows this process:
1. ATR = Average of max(High-Low, |High-PreviousClose|, |Low-PreviousClose|) over 'length' periods
2. UpperBand = (High+Low)/2 - (Multiplier * ATR)
3. LowerBand = (High+Low)/2 + (Multiplier * ATR)
Trend direction is determined by:
- If Close > previous LowerBand, Trend = Bullish (1)
- If Close < previous UpperBand, Trend = Bearish (-1)
- Otherwise, Trend = previous Trend
🔶 VIX Analysis Framework
The core innovation lies in the VIX analysis system:
1. Statistical Analysis:
- VIX Mean = SMA(VIX, 252)
- VIX Standard Deviation = StdDev(VIX, 252)
- VIX Z-Score = (Current VIX - VIX Mean) / VIX StdDev
2. **Volatility Bands:
- Upper Band 1 = VIX Mean + (2 * VIX StdDev)
- Upper Band 2 = VIX Mean + (3 * VIX StdDev)
- Lower Band 1 = VIX Mean - (2 * VIX StdDev)
- Lower Band 2 = VIX Mean - (3 * VIX StdDev)
3. Volatility Regimes:
- "Very Low Volatility": VIX < Lower Band 1
- "Low Volatility": Lower Band 1 ≤ VIX < Mean
- "Normal Volatility": Mean ≤ VIX < Upper Band 1
- "High Volatility": Upper Band 1 ≤ VIX < Upper Band 2
- "Extreme Volatility": VIX ≥ Upper Band 2
4. VIX Trend Detection:
- VIX EMA = EMA(VIX, 10)
- VIX Rising = VIX > VIX EMA
- VIX Falling = VIX < VIX EMA
Local performance:
🔶 Entry Logic Integration
The strategy combines trend signals with volatility filtering:
Long Entry Condition:
- Both SuperTrend 1 AND SuperTrend 2 must be bullish (trend = 1)
- AND selected VIX filter condition must be satisfied
Short Entry Condition:
- Both SuperTrend 1 AND SuperTrend 2 must be bearish (trend = -1)
- AND selected VIX filter condition must be satisfied
Available VIX filter rules include:
- "Below Mean + SD": VIX < Lower Band 1
- "Below Mean": VIX < VIX Mean
- "Above Mean": VIX > VIX Mean
- "Above Mean + SD": VIX > Upper Band 1
- "Falling VIX": VIX < VIX EMA
- "Rising VIX": VIX > VIX EMA
- "Any": No VIX filtering
█ Trade Direction
The strategy allows testing in three modes:
1. **Long Only:** Test volatility effects on uptrends only
2. **Short Only:** Examine volatility's impact on downtrends only
3. **Both (Default):** Compare how volatility affects both trend directions
This enables comparative analysis of how volatility regimes impact bullish versus bearish markets differently.
█ Usage
Use this strategy as an experimental framework:
1. Form a hypothesis about how volatility affects trend reliability
2. Configure VIX filters to test your specific hypothesis
3. Analyze performance across different volatility regimes
4. Compare results between uptrends and downtrends
5. Refine your volatility filtering approach based on results
6. Share your findings with the trading community
This framework allows you to investigate questions like:
- Are uptrends more reliable during rising or falling volatility?
- Do downtrends perform better when volatility is above or below its historical average?
- Should different volatility filters be applied to long vs. short positions?
█ Default Settings
The default settings serve as a starting point for exploration:
SuperTrend Parameters:
- SuperTrend 1 (Length=13, Multiplier=3.5): More responsive to trend changes
- SuperTrend 2 (Length=8, Multiplier=5.0): More selective filter requiring stronger trends
VIX Analysis Settings:
- Lookback Period = 252: Establishes a full market cycle for volatility context
- Standard Deviation Bands = 2 and 3 SD: Creates statistically significant regime boundaries
- VIX Trend Period = 10: Balances responsiveness with noise reduction
Default VIX Filter Selection:
- Long Entry: "Above Mean" - Tests if uptrends perform better during above-average volatility
- Short Entry: "Rising VIX" - Tests if downtrends accelerate when volatility is increasing
Feel Free to share your insight below!!!

Whale Buy Activity Detector (Real-Time)Whale Buy Activity Detector (Real-Time)
This indicator helps to identify abnormal spikes in the volume of purchases, which may indicate the activity of large players ("whales"). It analyzes the volume of purchases and compares it with the average volume over a certain period of time. If the volume of purchases exceeds a set threshold, the indicator marks this as potential whale activity.
Basic parameters:
Volume Threshold (x Average): The coefficient by which the current purchase volume must exceed the average volume in order to be considered abnormal. The default value is 2.0, which means that the purchase volume should be 2 times the average volume for the selected time period. This parameter can be adjusted in the range from 1.0 and higher in increments of 0.1.
Example: If you set the value to 1.5, the indicator will mark situations when the volume of purchases exceeds the average volume by 1.5 times.
Lookback Period: The time period used to calculate the average purchase volume. The default value is 20, which means that the average purchase volume will be calculated for the last 20 candles. This parameter can be set in the range from 1 and above.Example: If you set the value to 10, the average purchase volume will be calculated for the last 10 candles.
How to use:
Buy Volume: Shows the volume of purchases on each candle. This is the volume that was sold at a price higher than the opening price of the candle.
Average Buy Volume: The average volume of purchases over a given time period (Lookback Period). This parameter helps to determine the "normal" level of purchase volume.
Whale Buy: Notes abnormal spikes in the volume of purchases, which may indicate the activity of "whales". The indicator draws a mark on the top of the candle when the purchase volume exceeds the threshold set by the Volume Threshold parameter.
Notifications:
The indicator can send notifications when an abnormal volume of purchases is detected. You can set up notifications via the TradingView menu to receive real-time alerts.
Usage example:
If you are trading in a highly volatile market, you can increase the Volume Threshold to filter out small volume spikes.
If you trade in a low-volatility market, you can reduce the Volume Threshold to capture even small anomalies.

Quarterly Theory ICT 02 [TradingFinder] True Open Session 90 Min🔵 Introduction
The Quarterly Theory ICT indicator is an advanced analytical system built on ICT (Inner Circle Trader) concepts and fractal time. It divides time into four quarters (Q1, Q2, Q3, Q4), and is designed based on the consistent repetition of these phases across all trading timeframes (annual, monthly, weekly, daily, and even shorter trading sessions).
Each cycle consists of four distinct phases: the first phase (Q1) is the Accumulation phase, characterized by price consolidation; the second phase (Q2), known as Manipulation or Judas Swing, is marked by initial false movements indicating a potential shift; the third phase (Q3) is Distribution, where price volatility peaks; and the fourth phase (Q4) is Continuation/Reversal, determining whether the previous trend continues or reverses.
🔵 How to Use
The central concept of this strategy is the "True Open," which refers to the actual starting point of each time cycle. The True Open is typically defined at the beginning of the second phase (Q2) of each cycle. Prices trading above or below the True Open serve as a benchmark for predicting the market's potential direction and guiding trading decisions.
The practical application of the Quarterly Theory strategy relies on accurately identifying True Open points across various timeframes.
True Open points are defined as follows :
Yearly Cycle :
Q1: January, February, March
Q2: April, May, June (True Open: April Monthly Open)
Q3: July, August, September
Q4: October, November, December
Monthly Cycle :
Q1: First Monday of the month
Q2: Second Monday of the month (True Open: Daily Candle Open price on the second Monday)
Q3: Third Monday of the month
Q4: Fourth Monday of the month
Weekly Cycle :
Q1: Monday
Q2: Tuesday (True Open: Daily Candle Open Price on Tuesday)
Q3: Wednesday
Q4: Thursday
Daily Cycle :
Q1: 18:00 - 00:00 (Asian session)
Q2: 00:00 - 06:00 (True Open: Start of London Session)
Q3: 06:00 - 12:00 (NY AM)
Q4: 12:00 - 18:00 (NY PM)
90 Min Asian Session :
Q1: 18:00 - 19:30
Q2: 19:30 - 21:00 (True Open at 19:30)
Q3: 21:00 - 22:30
Q4: 22:30 - 00:00
90 Min London Session :
Q1: 00:00 - 01:30
Q2: 01:30 - 03:00 (True Open at 01:30)
Q3: 03:00 - 04:30
Q4: 04:30 - 06:00
90 Min New York AM Session :
Q1: 06:00 - 07:30
Q2: 07:30 - 09:00 (True Open at 07:30)
Q3: 09:00 - 10:30
Q4: 10:30 - 12:00
90 Min New York PM Session :
Q1: 12:00 - 13:30
Q2: 13:30 - 15:00 (True Open at 13:30)
Q3: 15:00 - 16:30
Q4: 16:30 - 18:00
Micro Cycle (22.5-Minute Quarters) : Each 90-minute quarter is further divided into four 22.5-minute sub-segments (Micro Sessions).
True Opens in these sessions are defined as follows :
Asian Micro Session :
True Session Open : 19:30 - 19:52:30
London Micro Session :
T rue Session Open : 01:30 - 01:52:30
New York AM Micro Session :
True Session Open : 07:30 - 07:52:30
New York PM Micro Session :
True Session Open : 13:30 - 13:52:30
By accurately identifying these True Open points across various timeframes, traders can effectively forecast the market direction, analyze price movements in detail, and optimize their trading positions. Prices trading above or below these key levels serve as critical benchmarks for determining market direction and making informed trading decisions.
🔵 Setting
Show True Range : Enable or disable the display of the True Range on the chart, including the option to customize the color.
Extend True Range Line : Choose how to extend the True Range line on the chart, with the following options:
None: No line extension
Right: Extend the line to the right
Left: Extend the line to the left
Both: Extend the line in both directions (left and right)
Show Table : Determines whether the table—which summarizes the phases (Q1 to Q4)—is displayed.
Show More Info : Adds additional details to the table, such as the name of the phase (Accumulation, Manipulation, Distribution, or Continuation/Reversal) or further specifics about each cycle.
🔵 Conclusion
The Quarterly Theory ICT, by dividing time into four distinct quarters (Q1, Q2, Q3, and Q4) and emphasizing the concept of the True Open, provides a structured and repeatable framework for analyzing price action across multiple time frames.
The consistent repetition of phases—Accumulation, Manipulation (Judas Swing), Distribution, and Continuation/Reversal—allows traders to effectively identify recurring price patterns and critical market turning points. Utilizing the True Open as a benchmark, traders can more accurately determine potential directional bias, optimize trade entries and exits, and manage risk effectively.
By incorporating principles of ICT (Inner Circle Trader) and fractal time, this strategy enhances market forecasting accuracy across annual, monthly, weekly, daily, and shorter trading sessions. This systematic approach helps traders gain deeper insight into market structure and confidently execute informed trading decisions.

Advanced Support and Resistance Levels[MAP]Advanced Support and Resistance Levels Indicator
Author
Developed by:
Overview
The "Advanced Support and Resistance Levels" indicator, created, is a sophisticated tool designed for TradingView's Pine Script v6 platform. It identifies and plots key support and resistance levels on a price chart, enhancing technical analysis by incorporating pivot strength, volume weighting, and level decay. The indicator overlays lines, zones, and labels on the chart, providing a visual representation of significant price levels where the market has historically reversed or consolidated.
Purpose
This indicator, authored by , aims to:
Detect significant pivot points (highs and lows) with customizable strength requirements.
Track and rank support/resistance levels based on their recency, volume, and number of touches.
Display these levels as lines and optional zones, with strength-based visual cues (e.g., line thickness and opacity).
Offer flexibility through user-configurable settings to adapt to different trading styles and market conditions.
Features
Pivot Detection:
Identifies high and low pivots using a strength parameter, requiring a specified number of bars on either side where no higher highs or lower lows occur.
Incorporates closing price checks and SMA-based trend confirmation to filter out noise and ensure pivots align with the broader market direction.
Level Management:
Maintains a dynamic array of levels with attributes: price, type (support/resistance), bars since last touch, strength, and volume.
Merges nearby levels within a tolerance percentage, updating prices with a strength-weighted average.
Prunes weaker or older levels when exceeding the maximum allowed, prioritizing those with higher calculated strength.
Strength Calculation:
Combines the number of touches (strength), volume (if enabled), and age decay (if enabled) into a single metric.
Volume weighting uses a logarithmic scale to emphasize high-volume pivots without over-amplifying extreme values.
Age decay reduces the importance of older levels over time, ensuring relevance to current price action.
Visualization:
Draws horizontal lines at each level, with thickness reflecting the number of touches (up to a user-defined maximum).
Optional price zones around levels, sized as a percentage of the price, to indicate areas of influence.
Labels display the level type (S for support, R for resistance), price, and strength score, with position (left or right) customizable.
Line opacity varies with strength, providing a visual hierarchy of level significance.
Plots small triangles at detected pivot points for reference.
Inputs
Lookback Period (lookback, default: 20): Number of bars to consider for trend confirmation via SMA. Range: 5–100.
Pivot Strength (strength, default: 2): Number of bars required on each side of a pivot to confirm it. Range: 1–10.
Price Tolerance % (tolerance, default: 0.5): Percentage range for merging similar levels. Range: 0.1–5.
Max Levels to Show (maxLevels, default: 10): Maximum number of levels displayed. Range: 2–50.
Zone Size % (zoneSizePercent, default: 0.1): Size of the S/R zone as a percentage of the price. Range: 0–1.
Line Width (lineWidth, default: 1): Maximum thickness of level lines. Range: 1–5.
Show Labels (showLabels, default: true): Toggle visibility of level labels.
Label Position (labelPos, default: "Right"): Position of labels ("Left" or "Right").
Level Strength Decay (levelDecay, default: true): Enable gradual reduction in strength for older levels.
Volume Weighting (volumeWeight, default: true): Incorporate volume into level strength calculations.
Support Color (supportColor, default: green): Color for support levels.
Resistance Color (resistColor, default: red): Color for resistance levels.
How It Works
Pivot Detection:
Checks for pivots only after enough bars (2 * strength) have passed.
A high pivot requires strength bars before and after with no higher highs or closes, and a short-term SMA above a long-term SMA.
A low pivot requires strength bars before and after with no lower lows or closes, and a short-term SMA below a long-term SMA.
Level Tracking:
New pivots create levels with initial strength and volume.
Existing levels within tolerance are updated: strength increases, volume takes the maximum value, and price adjusts via a weighted average.
Levels older than lookback * 4 bars with strength below 0.5 are removed.
If the number of levels exceeds maxLevels, the weakest (by calculated strength) are pruned using a selection sort algorithm.
Drawing:
Updates on the last confirmed bar or in real-time.
Lines extend lookback bars left and right from the current bar, with thickness based on touches.
Zones (if enabled) are drawn symmetrically around the level price.
Labels show detailed info, with opacity tied to strength.
Usage
Add to Chart: Apply the indicator to any TradingView chart via the Pine Script editor, as designed by .
Adjust Settings: Customize inputs to match your trading strategy (e.g., increase strength for stronger pivots, adjust tolerance for tighter level merging).
Interpret Levels: Focus on thicker, less transparent lines for stronger levels; use zones to identify potential reversal areas.
Combine with Other Tools: Pair with trend indicators or oscillators for confluence in trading decisions.
Notes
Performance: The indicator uses arrays and sorting, which may slow down on very long charts with many levels. Keep maxLevels reasonable for efficiency.
Accuracy: Enhanced by trend confirmation and volume weighting, making it more reliable than basic S/R indicators, thanks to 's design.
Limitations: Real-time updates may shift levels as new pivots form; historical levels are more stable.
Example Settings
For day trading: lookback=10, strength=1, tolerance=0.3, maxLevels=5.
For swing trading: lookback=50, strength=3, tolerance=0.7, maxLevels=10.
Credits
Author: – Creator of this advanced support and resistance tool, blending precision and customization for traders.

Double Top/Bottom Fractals DetectorDouble Top/Bottom Detector with Williams Fractals (Extended + Early Signal)
This indicator combines the classic Williams Fractals methodology with an enhanced mechanism to detect potential reversal patterns—namely, double tops and double bottoms. It does so by using two separate detection schemes:
Confirmed Fractals for Pattern Formation:
The indicator calculates confirmed fractals using the traditional Williams Fractals rules. A fractal is confirmed if a bar’s high (for an up fractal) or low (for a down fractal) is the highest or lowest compared to a specified number of bars on both sides (default: 2 bars on the left and 2 on the right).
Once a confirmed fractal is identified, its price (high for tops, low for bottoms) and bar index are stored in an internal array (up to the 10 most recent confirmed fractals).
When a new confirmed fractal appears, the indicator compares it with previous confirmed fractals. If the new fractal is within a user-defined maximum bar distance (e.g., 20 bars) and the price difference is within a specified tolerance (default: 0.8%), the indicator assumes that a double top (if comparing highs) or a double bottom (if comparing lows) pattern is forming.
A signal is then generated by placing a label on the chart—SELL for a double top and BUY for a double bottom.
Early Signal Generation:
To capture potential reversals sooner, the indicator also includes an “early signal” mechanism. This uses asymmetric offsets different from the confirmed fractal calculation:
Signal Right Offset: Defines the candidate bar used for early signal detection (default is 1 bar).
Signal Left Offset: Defines the number of bars to the left of the candidate that must confirm the candidate’s price is the extreme (default is 2 bars).
For an early top candidate, the candidate bar’s high must be greater than the highs of the bars specified by the left offset and also higher than the bar immediately to its right. For an early bottom candidate, the corresponding condition applies for lows.
If the early candidate’s price level is within the acceptable tolerance when compared to any of the previously stored confirmed fractals (again, within the allowed bar distance), an early signal is generated—displayed as SELL_EARLY or BUY_EARLY.
The early signal block can be enabled or disabled via a checkbox input, allowing traders to choose whether to use these proactive signals.
Key Parameters:
n:
The number of bars used to confirm a fractal. The fractal is considered valid if the bar’s high (or low) is higher (or lower) than the highs (or lows) of the preceding and following n bars.
maxBarsApart:
The maximum number of bars allowed between two fractals for them to be considered part of the same double top or bottom pattern.
tolerancePercent:
The maximum allowed percentage difference (default: 0.8%) between the high (or low) values of two fractals to qualify them as matching for the pattern.
signalLeftOffset & signalRightOffset:
These parameters define the asymmetric offsets for early signal detection. The left offset (default: 2) specifies how many bars to look back, while the right offset (default: 1) specifies the candidate bar’s position.
earlySignalsEnabled:
A checkbox option that allows users to enable or disable early signal generation. When disabled, the indicator only uses confirmed fractal signals.
How It Works:
Fractal Calculation and Plotting:
The confirmed fractals are calculated using the traditional method, ensuring robust identification by verifying the pattern with a symmetrical offset. These confirmed fractals are plotted on the chart using triangle shapes (upwards for potential double bottoms and downwards for potential double tops).
Pattern Detection:
Upon detection of a new confirmed fractal, the indicator checks up to 10 previous fractals stored in internal arrays. If the new fractal’s high or low is within the tolerance range and close enough in terms of bars to one of the stored fractals, it signifies the formation of a double top or double bottom. A corresponding SELL or BUY label is then placed on the chart.
Early Signal Feature:
If enabled, the early signal block checks for candidate bars based on the defined asymmetric offsets. These candidates are evaluated to see if their high/low levels meet the early confirmation criteria relative to nearby bars. If they also match one of the confirmed fractal levels (within tolerance and bar distance), an early signal is issued with a label (SELL_EARLY or BUY_EARLY) on the chart.
Benefits for Traders:
Timely Alerts:
By combining both confirmed and early signals, the indicator offers a proactive approach to detect reversals sooner, potentially improving entry and exit timing.
Flexibility:
With adjustable parameters (including the option to disable early signals), traders can fine-tune the indicator to better suit different markets, timeframes, and trading styles.
Enhanced Pattern Recognition:
The dual-layered approach (confirmed fractals plus early detection) helps filter out false signals and captures the essential formation of double tops and bottoms more reliably.

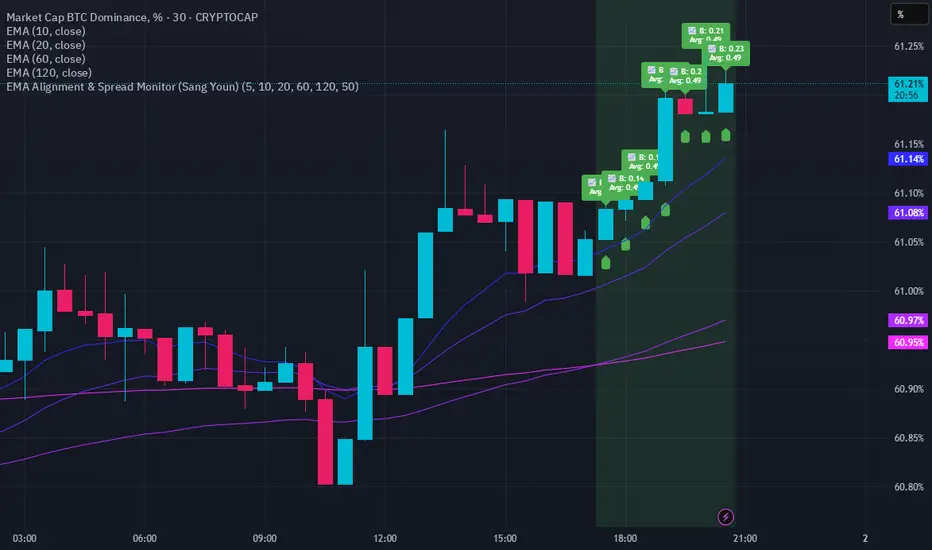
EMA Alignment & Spread Monitor (Sang Youn)Overview
The EMA Alignment & Spread Monitor is a dynamic trading script designed to monitor EMA (Exponential Moving Average) alignments, track spread deviations, and provide real-time alerts when significant conditions are met. This script allows traders to customize their EMA periods, analyze market trends based on EMA positioning, and receive visual and audio alerts when key spread conditions occur.
🔹 Key Features
✅ Customizable EMA Periods – Users can input their own EMA lengths to adapt the script to various market conditions. (Default: 5, 10, 20, 60, 120)
✅ EMA Alignment Detection – Identifies bullish alignment (all EMAs in ascending order) and bearish alignment (all EMAs in descending order).
✅ Spread Calculation & Monitoring – Computes the spread difference between each EMA and tracks the average spread over a user-defined period.
✅ Deviation Alerts – Notifies traders when:
Bullish Trend: The spread exceeds its average, indicating a potential strong uptrend.
Bearish Trend: The spread falls below its average, signaling a possible downtrend.
✅ Chart Annotations – Displays 📈 (green triangle) when bullish spread exceeds average and 📉 (red triangle) when bearish spread drops below average for easy visualization.
✅ Real-time Alerts – Sends alerts when spread conditions are met, helping traders react to market shifts efficiently.
✅ Spread Histogram – Visual representation of bullish and bearish spread levels for trend analysis.
🔹 How It Works
1️⃣ Set your EMA periods in the script settings (default: 5, 10, 20, 60, 120).
2️⃣ Define the spread average calculation length (default: 50 candles).
3️⃣ The script tracks EMA alignment to determine bullish or bearish trends.
4️⃣ If the spread deviates significantly from its average, the script:
Places a 📈 green triangle above candles in a bullish trend when spread > average.
Places a 📉 red triangle below candles in a bearish trend when spread < average.
Triggers an alert for timely decision-making.
5️⃣ Use the histogram & real-time alerts to stay ahead of market movements.
Volume Stack US Top 40 [Pt]█ Overview
Volume Stack US Top 40 is a versatile TradingView indicator designed to give you an at-a-glance view of market sentiment and volume dynamics across the top 40 U.S. large-cap stocks. Inspired by the popular Saty Volume Stack, this enhanced version aggregates essential volume and price strength data from major tickers on both the NYSE and NASDAQ, and works seamlessly on all timeframes.
█ Key Features
Dynamic Buy / Sell Volume Stack: This indicator dynamically stacks the volume bars so that the side with higher volume appears on top. For example, green over red signals more buy-side volume, while red over green indicates greater sell-side volume.
Cross-Market Analysis: Easily toggle between NYSE and NASDAQ to analyze the most influential U.S. stocks. The indicator automatically loads the correct set of tickers based on your selection.
Flexible Coverage: Choose from Top 10, Top 20, Top 30, or Top 40 tickers to tailor the tool to your desired scope of analysis.
Dynamic Table Display: A neat on-chart table lists the selected ticker symbols along with visual cues that reflect each stock’s strength. You can even remove exchange prefixes for a cleaner look.
█ Inputs & Settings
Market Selector: Choose whether to view data from the NYSE or NASDAQ; the indicator automatically loads the corresponding list of top tickers.
Number of Tickers: Select from ‘Top 10’, ‘Top 20’, ‘Top 30’, or ‘Top 40’ stocks to define the breadth of your analysis.
Color Options: Customize the colors for bullish and bearish histogram bars to suit your personal style.
Table Preferences: Adjust the on-chart table’s display style (grid or one row), text size, and decide whether to show exchange information alongside ticker symbols.
█ Usage & Benefits
Volume Stack US Top 40 is ideal for traders and investors who need a clear yet powerful tool to gauge overall market strength. By combining volume and price action data across multiple major stocks, it helps you:
Quickly assess whether the market sentiment is bullish or bearish.
Confirm trends by comparing volume patterns against intraday price movements.
Enhance your trading decisions with a visual representation of market breadth and dynamic buy/sell volume stacking.
Its intuitive design means you spend less time adjusting complex settings and more time making confident, informed decisions.

Asset Allocation CalculatorOverview
This script is a tool that automatically calculates asset allocation for your investment portfolio. Users can set the weight of multiple assets and monitor the portfolio value in real time based on price fluctuations.
Key Features
Supports input of asset allocation percentages
Dynamic allocation calculation based on real-time price data
Automatically calculates allocated amounts for each asset based on the total investment amount
User-friendly interface with intuitive visual feedback
Settings
Total Capital : Enter the total capital, including the value of assets.
Quantity rounding : Using the rounding function may cause the target allocation to exceed 100%.
Tickers, Weight, Holdings :
To retrieve accurate asset prices, specify both the exchange and the ticker.
If you want to include cash in your portfolio, use $.
Ensure that the total allocation sums to 100%.
Refer to the pre-filled example for the correct format.
Table Settings : You can adjust the table's position, height, font size, and background color.
How to Use
By buying or selling the quantity shown in the Buy column, you can continuously maintain your target allocation.
Hold - Current holdings
Buy - Quantity to buy or sell to reach the target allocation
Target - Quantity aimed for after buying or selling
Caution
It can only calculate for a single currency, so do not mix multiple currency markets.
자산 배분 계산기
소개
이 스크립트는 투자 포트폴리오의 자산 배분을 자동으로 계산해주는 도구입니다. 사용자는 여러 자산의 비중을 설정할 수 있으며, 가격 변동에 따라 포트폴리오 가치를 실시간으로 모니터링할 수 있습니다.
주요 기능
자산 배분 비율 입력 지원
실시간 가격 데이터를 기반으로 한 동적 배분 계산
총 투자 금액을 기준으로 각 자산에 할당된 금액 자동 계산
직관적인 시각적 피드백을 제공하는 사용자 친화적인 인터페이스
설정
Total Capital : 자산 가치를 포함한 총 자본금을 입력하세요.
Quantity rounding : 반올림 기능을 사용하면 목표 비중이 100%를 초과할 수 있습니다.
Tickers, Weight, Holdings :
정확한 자산 가격을 불러오기 위해 거래소와 티커를 함께 입력하세요.
포트폴리오에 현금을 포함하려면 '$'를 사용하세요.
비중 합계가 반드시 100%가 되도록 설정하세요.
예제 형식을 참고하여 올바르게 입력하세요.
한국(원화) 시장을 위한 입력 예시입니다.
KRX:360750, 17.5, 100
KRX:310960, 17.5, 120
KRX:148070, 25, 20
KRX:305080, 25, 10
KRX:139320, 10, 150
UPBIT:BTCKRW, 5, 0.002
$,0,5000000
Table Settings : 테이블의 위치, 높이, 글자 크기 및 배경색을 조정할 수 있습니다.
사용 방법
Buy 열에 표시된 수량만큼 매수 또는 매도하면 목표 비중을 지속적으로 유지할 수 있습니다.
Hold - 현재 보유 수량
Buy - 목표 비중을 맞추기 위해 매수 또는 매도해야 하는 수량
Target - 매수, 매도 후 목표로 하는 수량
주의
한 가지 통화로만 계산할 수 있으니 여러 통화 시장을 혼용하지 마세요.

Enhanced KLSE Banker Flow Oscillator# Enhanced KLSE Banker Flow Oscillator
## Description
The Enhanced KLSE Banker Flow Oscillator is a sophisticated technical analysis tool designed specifically for the Malaysian stock market (KLSE). This indicator analyzes price and volume relationships to identify potential smart money movements, providing early signals for market reversals and continuation patterns.
The oscillator measures the buying and selling pressure in the market with a focus on detecting institutional activity. By combining money flow calculations with volume filters and price action analysis, it helps traders identify high-probability trading opportunities with reduced noise.
## Key Features
- Dual-Timeframe Analysis: Combines long-term money flow trends with short-term momentum shifts for more accurate signals
- Adaptive Volume Filtering: Automatically adjusts volume thresholds based on recent market conditions
- Advanced Divergence Detection: Identifies potential trend reversals through price-flow divergences
- Early Signal Detection: Provides anticipatory signals before major price movements occur
- Multiple Signal Types: Offers both early alerts and strong confirmation signals with clear visual markers
- Volatility Adjustment: Adapts sensitivity based on current market volatility for more reliable signals
- Comprehensive Visual Feedback: Color-coded oscillator, signal markers, and optional text labels
- Customizable Display Options: Toggle momentum histogram, early signals, and zone fills
- Organized Settings Interface: Logically grouped parameters for easier configuration
## Indicator Components
1. Main Oscillator Line: The primary banker flow line that fluctuates above and below zero
2. Early Signal Line: Secondary indicator showing potential emerging signals
3. Momentum Histogram: Visual representation of flow momentum changes
4. Zone Fills: Color-coded background highlighting positive and negative zones
5. Signal Markers: Visual indicators for entry and exit points
6. Reference Lines: Key levels for strong and early signals
7. Signal Labels: Optional text annotations for significant signals
## Signal Types
1. Strong Buy Signal (Green Arrow): Major bullish signal with high probability of success
2. Strong Sell Signal (Red Arrow): Major bearish signal with high probability of success
3. Early Buy Signal (Blue Circle): First indication of potential bullish trend
4. Early Sell Signal (Red Circle): First indication of potential bearish trend
5. Bullish Divergence (Yellow Triangle Up): Price making lower lows while flow makes higher lows
6. Bearish Divergence (Yellow Triangle Down): Price making higher highs while flow makes lower highs
## Parameters Explained
### Core Settings
- MFI Base Length (14): Primary calculation period for money flow index
- Short-term Flow Length (5): Calculation period for early signals
- KLSE Sensitivity (1.8): Multiplier for flow calculations, higher = more sensitive
- Smoothing Length (5): Smoothing period for the main oscillator line
### Volume Filter Settings
- Volume Filter % (65): Minimum volume threshold as percentage of average
- Use Adaptive Volume Filter (true): Dynamically adjusts volume thresholds
### Signal Levels
- Strong Signal Level (15): Threshold for strong buy/sell signals
- Early Signal Level (10): Threshold for early buy/sell signals
- Early Signal Threshold (0.75): Sensitivity factor for early signals
### Advanced Settings
- Divergence Lookback (34): Period for checking price-flow divergences
- Show Signal Labels (true): Toggle text labels for signals
### Visual Settings
- Show Momentum Histogram (true): Toggle the momentum histogram display
- Show Early Signal (true): Toggle the early signal line display
- Show Zone Fills (true): Toggle background color fills
## How to Use This Indicator
### Installation
1. Add the indicator to your TradingView chart
2. Default settings are optimized for KLSE stocks
3. Customize parameters if needed for specific stocks
### Basic Interpretation
- Oscillator Above Zero: Bullish bias, buying pressure dominates
- Oscillator Below Zero: Bearish bias, selling pressure dominates
- Crossing Zero Line: Potential shift in market sentiment
- Extreme Readings: Possible overbought/oversold conditions
### Advanced Interpretation
- Divergences: Early warning of trend exhaustion
- Signal Confluences: Multiple signal types appearing together increase reliability
- Volume Confirmation: Signals with higher volume are more significant
- Momentum Alignment: Histogram should confirm direction of main oscillator
### Trading Strategies
#### Trend Following Strategy
1. Identify market trend direction
2. Wait for pullbacks shown by oscillator moving against trend
3. Enter when oscillator reverses back in trend direction with a Strong signal
4. Place stop loss below/above recent swing low/high
5. Take profit at previous resistance/support levels
#### Counter-Trend Strategy
1. Look for oscillator reaching extreme levels
2. Identify divergence between price and oscillator
3. Wait for oscillator to cross Early signal threshold
4. Enter position against prevailing trend
5. Use tight stop loss (1 ATR from entry)
6. Take profit at first resistance/support level
#### Breakout Confirmation Strategy
1. Identify stock consolidating in a range
2. Wait for price to break out of range
3. Confirm breakout with oscillator crossing zero line in breakout direction
4. Enter position in breakout direction
5. Place stop loss below/above the breakout level
6. Trail stop as price advances
### Signal Hierarchy and Reliability
From highest to lowest reliability:
1. Strong Buy/Sell signals with divergence and high volume
2. Strong Buy/Sell signals with high volume
3. Divergence signals followed by Early signals
4. Strong Buy/Sell signals with normal volume
5. Early Buy/Sell signals with high volume
6. Early Buy/Sell signals with normal volume
## Complete Trading Plan Example
### KLSE Market Trading System
#### Pre-Trading Preparation
1. Review overall market sentiment (bullish, bearish, or neutral)
2. Scan for stocks showing significant banker flow signals
3. Note key support/resistance levels for watchlist stocks
4. Prioritize trade candidates based on signal strength and volume
#### Entry Rules for Long Positions
1. Banker Flow Oscillator above zero line (positive flow environment)
2. One or more of the following signals present:
- Strong Buy signal (green arrow)
- Bullish Divergence signal (yellow triangle up)
- Early Buy signal (blue circle) with confirming price action
3. Entry confirmation requirements:
- Volume above 65% of 20-day average
- Price above short-term moving average (e.g., 20 EMA)
- No immediate resistance within 3% of entry price
4. Entry on the next candle open after signal confirmation
#### Entry Rules for Short Positions
1. Banker Flow Oscillator below zero line (negative flow environment)
2. One or more of the following signals present:
- Strong Sell signal (red arrow)
- Bearish Divergence signal (yellow triangle down)
- Early Sell signal (red circle) with confirming price action
3. Entry confirmation requirements:
- Volume above 65% of 20-day average
- Price below short-term moving average (e.g., 20 EMA)
- No immediate support within 3% of entry price
4. Entry on the next candle open after signal confirmation
#### Position Sizing Rules
1. Base risk per trade: 1% of trading capital
2. Position size calculation: Capital × Risk% ÷ Stop Loss Distance
3. Position size adjustments:
- Increase by 20% for Strong signals with above-average volume
- Decrease by 20% for Early signals without confirming price action
- Standard size for all other valid signals
#### Stop Loss Placement
1. For Long Positions:
- Place stop below the most recent swing low
- Minimum distance: 1.5 × ATR(14)
- Maximum risk: 1% of trading capital
2. For Short Positions:
- Place stop above the most recent swing high
- Minimum distance: 1.5 × ATR(14)
- Maximum risk: 1% of trading capital
#### Take Profit Strategy
1. First Target (33% of position):
- 1.5:1 reward-to-risk ratio
- Move stop to breakeven after reaching first target
2. Second Target (33% of position):
- 2.5:1 reward-to-risk ratio
- Trail stop at previous day's low/high
3. Final Target (34% of position):
- 4:1 reward-to-risk ratio or
- Exit when opposing signal appears (e.g., Strong Sell for long positions)
#### Trade Management Rules
1. After reaching first target:
- Move stop to breakeven
- Consider adding to position if new confirming signal appears
2. After reaching second target:
- Trail stop using banker flow signals
- Exit remaining position when:
- Oscillator crosses zero line in opposite direction
- Opposing signal appears
- Price closes below/above trailing stop level
3. Maximum holding period:
- 20 trading days for trend-following trades
- 10 trading days for counter-trend trades
- Re-evaluate if targets not reached within timeframe
#### Risk Management Safeguards
1. Maximum open positions: 5 trades
2. Maximum sector exposure: 40% of trading capital
3. Maximum daily drawdown limit: 3% of trading capital
4. Mandatory stop trading rules:
- After three consecutive losing trades
- After reaching 5% account drawdown
- Resume after two-day cooling period and strategy review
#### Performance Tracking
1. Track for each trade:
- Signal type that triggered entry
- Oscillator reading at entry and exit
- Volume relative to average
- Price action confirmation patterns
- Holding period
- Reward-to-risk achieved
2. Review performance metrics weekly:
- Win rate by signal type
- Average reward-to-risk ratio
- Profit factor
- Maximum drawdown
3. Adjust strategy parameters based on performance:
- Increase position size for highest performing signals
- Decrease or eliminate trades based on underperforming signals
## Advanced Usage Tips
1. Combine with Support/Resistance:
- Signals are more reliable when they occur at key support/resistance levels
- Look for banker flow divergence at major price levels
2. Multiple Timeframe Analysis:
- Use the oscillator on both daily and weekly timeframes
- Stronger signals when both timeframes align
- Enter on shorter timeframe when confirmed by longer timeframe
3. Sector Rotation Strategy:
- Compare banker flow across different sectors
- Rotate capital to sectors showing strongest positive flow
- Avoid sectors with persistent negative flow
4. Volatility Adjustments:
- During high volatility periods, wait for Strong signals only
- During low volatility periods, Early signals can be more actionable
5. Optimizing Parameters:
- For more volatile stocks: Increase Smoothing Length (6-8)
- For less volatile stocks: Decrease KLSE Sensitivity (1.2-1.5)
- For intraday trading: Reduce all length parameters by 30-50%
## Fine-Tuning for Different Markets
While optimized for KLSE, the indicator can be adapted for other markets:
1. For US Stocks:
- Reduce KLSE Sensitivity to 1.5
- Increase Volume Filter to 75%
- Adjust Strong Signal Level to 18
2. For Forex:
- Increase Smoothing Length to 8
- Reduce Early Signal Threshold to 0.6
- Focus more on divergence signals than crossovers
3. For Cryptocurrencies:
- Increase KLSE Sensitivity to 2.2
- Reduce Signal Levels (Strong: 12, Early: 8)
- Use higher Volume Filter (80%)
By thoroughly understanding and properly implementing the Enhanced KLSE Banker Flow Oscillator, traders can gain a significant edge in identifying institutional money flow and making more informed trading decisions, particularly in the Malaysian stock market.

Smart Volume S/R Pro [The_lurker]مؤشر "Smart Volume S/R Pro " هو أداة تحليل فني متقدمة مصممة لمساعدة المتداولين في تحديد مستويات الدعم والمقاومة القوية بناءً على حجم التداول، مع إضافة ميزات تحليلية متطورة مثل تصفية الاتجاه ، مناطق الثقة ، تقييم القوة ، حساب احتمالية الاختراق ، قياس السيولة ، تحديد الأهداف السعرية ، ومستويات فيبوناتشي . وايضا تقديم تسميات (Labels) بجانب كل مستوى دعم ومقاومة، تحتوي على أرقام ومعلومات دقيقة تعكس حالة السوق. هذه التسميات ليست مجرد زينة، بل أدوات تحليلية تساعد المتداولين على اتخاذ قرارات مستنيرة بناءً على بيانات السوقيهدف هذا المؤشر إلى توفير رؤية شاملة للسوق .
الوظائف الرئيسية للمؤشر
1- تحديد مستويات الدعم والمقاومة بناءً على حجم التداول العالي
يقوم المؤشر بتحليل الأشرطة (Bars) السابقة (حتى 300 شريط افتراضيًا) لتحديد النقاط التي شهدت أعلى مستويات حجم التداول.
يرسم خطوط أفقية تمثل مستويات المقاومة (عند أعلى سعر في تلك الأشرطة) والدعم (عند أدنى سعر)، ويمكن للمستخدم اختيار عدد الخطوط المعروضة (من 1 إلى 6).
2- تصفية الاتجاه باستخدام مؤشر ADX
يستخدم المؤشر مؤشر الاتجاه المتوسط (ADX) لتقييم قوة الاتجاه في السوق.
عندما تكون قوة الاتجاه عالية (تتجاوز عتبة محددة، 25 افتراضيًا)، يقلل المؤشر عدد مستويات الدعم والمقاومة المعروضة للتركيز فقط على المستويات الأكثر أهمية.
3- مناطق الثقة الديناميكية
يضيف المؤشر مناطق حول مستويات الدعم والمقاومة بناءً على متوسط المدى الحقيقي (ATR)، مما يساعد المتداولين على تصور النطاقات التي قد يتفاعل فيها السعر مع هذه المستويات.
يمكن تعديل عرض هذه المناطق باستخدام مضاعف ATR.
4- تقييم قوة المستويات
يحسب المؤشر قوة كل مستوى بناءً على حجم التداول، عدد المرات التي تم اختبار المستوى فيها (Touch Count)، وقرب السعر الحالي من المستوى.
يتم عرض درجة القوة (من 0 إلى 100) بجانب كل مستوى إذا تم تفعيل هذه الخاصية.
5- احتمالية الاختراق
يقدّر المؤشر احتمالية اختراق كل مستوى بناءً على الزخم (ROC)، قوة المستوى، والمسافة بين السعر الحالي والمستوى.
يظهر الاحتمال كنسبة مئوية إذا تم تفعيل الخيار، مما يساعد المتداولين على توقع الحركات المحتملة.
6- تحليل السيولة التاريخية
يقيس المؤشر السيولة حول كل مستوى بناءً على حجم التداول في النطاقات القريبة منه.
يمكن عرض قيم السيولة في التسميات أو استخدامها لتعديل عرض الخطوط (الخطوط الأكثر سيولة تظهر أعرض).
7- الأهداف السعرية
عند تفعيل هذه الخاصية، يحسب المؤشر أهداف سعرية للاختراق (Breakout) والارتداد (Reversal) بناءً على الزخم وقوة المستوى وATR.
يمكن عرض هذه الأهداف كنصوص في التسميات أو كخطوط أفقية على الرسم البياني.
8- مستويات فيبوناتشي
يرسم المؤشر مستويات فيبوناتشي (0.0، 0.236، 0.382، 0.5، 0.618، 0.786، 1.0) بناءً على أعلى وأدنى سعر في فترة النظرة الخلفية.
يمكن للمستخدم اختيار أي من هذه المستويات لعرضها أو إخفائها.
9- تنبيه شامل للاختراق
يوفر المؤشر تنبيهًا واحدًا يشمل جميع المستويات، حيث يُطلق التنبيه عندما يخترق السعر أي مستوى دعم أو مقاومة مع رسالة توضح نوع الاختراق والمستوى المخترق.
كيفية عمل المؤشر
الخطوة الأولى: يحدد المؤشر الأشرطة ذات الحجم العالي خلال فترة النظرة الخلفية المحددة (Lookback Period).
الخطوة الثانية: يرسم مستويات الدعم والمقاومة بناءً على أعلى وأدنى الأسعار في تلك الأشرطة، مع مراعاة عدد الخطوط المختارة من المستخدم.
الخطوة الثالثة: يطبق مرشح الاتجاه (إذا كان مفعلاً) لتقليل عدد المستويات في حالة الاتجاه القوي.
الخطوة الرابعة: يضيف التحليلات الإضافية مثل القوة، السيولة، احتمالية الاختراق، والأهداف السعرية، ويرسم مناطق الثقة ومستويات فيبوناتشي حسب الإعدادات.
الخطوة الخامسة: يراقب السعر ويطلق تنبيهًا عند الاختراق.
الإعدادات القابلة للتخصيص
1- فترة النظرة الخلفية (Lookback Period): عدد الأشرطة التي يتم تحليلها (افتراضيًا 300).
2- عدد الخطوط (Number of Lines): من 1 إلى 6 مستويات دعم ومقاومة.
3- الألوان والأنماط: يمكن تغيير ألوان الخطوط وأنماطها (ممتلئة، متقطعة، منقطة).
4- التسميات: تفعيل/تعطيل التسميات، وحجمها، وموقعها، ولون النص.
5- مرشح الاتجاه: تفعيل/تعطيل ADX، وتعديل طوله وعتبته.
6- مناطق الثقة: تفعيل/تعطيل، وتعديل طول ATR ومضاعفه.
7- القوة واحتمالية الاختراق: تفعيل/تعطيل العرض، وتعديل طول ROC.
8- السيولة: تفعيل/تعطيل تأثير السيولة على عرض الخطوط وقيمها في التسميات.
9- الأهداف السعرية: تفعيل/تعطيل الأهداف وعرضها كخطوط.
10- فيبوناتشي: اختيار المستويات المعروضة ولون الخطوط.
فوائد المؤشر
دقة عالية: يعتمد على حجم التداول لتحديد المستويات، مما يجعله أكثر موثوقية من المستويات العشوائية.
مرونة: يوفر خيارات تخصيص واسعة تتيح للمتداولين تكييفه حسب استراتيجياتهم.
تحليل شامل: يجمع بين الدعم والمقاومة، الاتجاه، السيولة، والأهداف في أداة واحدة.
سهولة الاستخدام: التسميات والتنبيهات تجعل من السهل متابعة السوق دون تعقيد.
==================================================================================تسميات (Labels) بجانب كل مستوى دعم ومقاومة، تحتوي على أرقام ومعلومات دقيقة تعكس حالة السوق. هذه التسميات ليست مجرد زينة، بل أدوات تحليلية تساعد المتداولين على اتخاذ قرارات مستنيرة بناءً على بيانات السوق. في هذا الشرح، سنستعرض كل رقم أو قيمة تظهر في التسميات ومعناها العملي.
مكونات التسميات
التسميات تظهر بجانب كل مستوى دعم (Support) ومقاومة (Resistance) وتبدأ بحرف "S" للدعم أو "R" للمقاومة، تليها مجموعة من الأرقام والقيم التي يمكن تفعيلها أو تعطيلها حسب إعدادات المستخدم. إليك تفصيل كل عنصر:
1- عدد اللمسات (Touch Count)
الرمز: يظهر مباشرة بعد "S" أو "R" (مثال: "R: 5" أو "S: 3").
المعنى: يشير إلى عدد المرات التي اختبر فيها السعر هذا المستوى دون اختراقه.
الفائدة: كلما زاد عدد اللمسات، كلما كان المستوى أقوى وأكثر أهمية. على سبيل المثال، إذا كان "R: 5"، فهذا يعني أن السعر ارتد من هذا المستوى 5 مرات، مما يجعله مقاومة قوية محتملة.
2- قوة المستوى (Strength Rating)
الرمز: يظهر بين قوسين مربعين (مثال: " ").
المعنى: قيمة من 0 إلى 100 تعكس قوة المستوى بناءً على عوامل مثل حجم التداول، عدد اللمسات، وقرب السعر الحالي من المستوى.
الفائدة: القيم العالية (مثل 75 أو أكثر) تشير إلى مستوى قوي يصعب اختراقه، بينما القيم المنخفضة (مثل 30 أو أقل) تدل على ضعف المستوى وسهولة اختراقه. يمكن للمتداول استخدام هذا لتحديد المستويات الأكثر موثوقية.
3- احتمالية الاختراق (Breakout Probability)
الرمز: يبدأ بحرف "B" متبوعًا بنسبة مئوية (مثال: "B: 60%").
المعنى: نسبة من 0% إلى 100% تُظهر احتمالية اختراق السعر للمستوى بناءً على الزخم الحالي، قوة المستوى، والمسافة بين السعر والمستوى.
الفائدة: نسبة مرتفعة (مثل 60% أو أكثر) تعني أن السعر قد يخترق المستوى قريبًا، بينما النسب المنخفضة (مثل 20%) تشير إلى احتمال ارتداد السعر. هذا مفيد لتوقع الحركة التالية.
4- قيمة السيولة (Liquidity Value)
الرمز: يبدأ بحرف "L" متبوعًا برقم (مثال: "L: 1200").
المعنى: يمثل متوسط حجم التداول في النطاق القريب من المستوى، مما يعكس السيولة التاريخية حوله.
الفائدة: القيم العالية تدل على وجود سيولة كبيرة، مما يعني أن السعر قد يتفاعل بقوة مع هذا المستوى (إما بالارتداد أو الاختراق). القيم المنخفضة تشير إلى سيولة ضعيفة، مما قد يجعل المستوى أقل تأثيرًا.
5- الأهداف السعرية (Price Targets)
الرمز: يبدأ بـ "BT" (هدف الاختراق) و"RT" (هدف الارتداد) متبوعين بأرقام (مثال: "BT: 150.50 RT: 148.20").
المعنى:
BT (Breakout Target): السعر المحتمل الذي قد يصل إليه السعر بعد اختراق المستوى.
RT (Reversal Target): السعر المحتمل الذي قد يصل إليه السعر إذا ارتد من المستوى.
الفائدة: تساعد المتداولين في تحديد نقاط الخروج المحتملة بعد الاختراق أو الارتداد، مما يسهل وضع خطة تداول دقيقة.
أمثلة عملية
تسمية مقاومة: "R: 4 B: 25% L: 1500 BT: 155.00 RT: 152.00"
المستوى اختُبر 4 مرات، قوته 80 (قوي جدًا)، احتمالية الاختراق 25% (منخفضة، أي احتمال ارتداد أعلى)، السيولة 1500 (مرتفعة)، هدف الاختراق 155.00، هدف الارتداد 152.00.
الاستنتاج: المستوى قوي ومن المرجح أن يرتد السعر منه، لكن إذا اخترق، فقد يصل إلى 155.00.
تسمية دعم: "S: 2 B: 70% L: 800 BT: 145.00 RT: 147.50"
المستوى اختُبر مرتين، قوته 40 (متوسطة إلى ضعيفة)، احتمالية الاختراق 70% (مرتفعة)، السيولة 800 (متوسطة)، هدف الاختراق 145.00، هدف الارتداد 147.50.
الاستنتاج: المستوى ضعيف ومن المحتمل أن يخترقه السعر ليهبط إلى 145.00.
كيفية الاستفادة من التسميات
تحديد القوة والضعف: استخدم قوة المستوى (Strength) لمعرفة ما إذا كان المستوى موثوقًا للارتداد أو عرضة للاختراق.
توقع الحركة: انظر إلى احتمالية الاختراق (Breakout Probability) لتحديد ما إذا كنت ستنتظر اختراقًا أو ترتدًا.
إدارة المخاطر: استخدم الأهداف السعرية (BT وRT) لتحديد نقاط جني الأرباح أو وقف الخسارة.
تقييم السيولة: ركز على المستويات ذات السيولة العالية لأنها غالبًا تكون نقاط تحول رئيسية في السوق.
تأكيد التحليل: ادمج عدد اللمسات مع القوة والسيولة للحصول على صورة كاملة عن أهمية المستوى.
تخصيص التسميات
يمكن للمستخدم تفعيل أو تعطيل أي من هذه القيم (القوة، الاحتمالية، السيولة، الأهداف) من إعدادات المؤشر.
يمكن أيضًا تغيير حجم التسميات (صغير، عادي، كبير)، موقعها (يمين، يسار، أعلى، أسفل)، ولون النص لتناسب احتياجاتك.
التسميات في هذا المؤشر هي بمثابة لوحة تحكم صغيرة بجانب كل مستوى دعم ومقاومة، تقدم لك معلومات فورية عن قوته، احتمالية اختراقه، سيولته، وأهدافه السعرية. بفهم هذه الأرقام، يمكنك تحسين قراراتك في التداول، سواء كنت تبحث عن نقاط دخول، خروج، أو إدارة مخاطر. إذا كنت تريد أداة تجمع بين البساطة والعمق التحليلي .
تنويه:
المؤشر هو أداة مساعدة فقط ويجب استخدامه مع التحليل الفني والأساسي لتحقيق أفضل النتائج.
إخلاء المسؤولية
لا يُقصد بالمعلومات والمنشورات أن تكون، أو تشكل، أي نصيحة مالية أو استثمارية أو تجارية أو أنواع أخرى من النصائح أو التوصيات المقدمة أو المعتمدة من TradingView.
The Smart Volume S/R Pro indicator is an advanced technical analysis tool designed to help traders identify strong support and resistance levels based on trading volume, with the addition of advanced analytical features such as trend filtering, confidence zones, strength assessment, breakout probability calculation, liquidity measurement, price target identification, and Fibonacci levels. It also provides labels next to each support and resistance level, containing accurate numbers and information that reflect the market condition. These labels are not just decorations, but analytical tools that help traders make informed decisions based on market data. This indicator aims to provide a comprehensive view of the market.
Main functions of the indicator
1- Identifying support and resistance levels based on high trading volume
The indicator analyzes previous bars (up to 300 bars by default) to identify the points that witnessed the highest levels of trading volume.
It draws horizontal lines representing resistance levels (at the highest price in those bars) and support (at the lowest price), and the user can choose the number of lines displayed (from 1 to 6).
2- Filtering the trend using the ADX indicator
The indicator uses the Average Directional Index (ADX) to assess the strength of a trend in the market.
When the strength of the trend is high (exceeding a specified threshold, 25 by default), the indicator reduces the number of support and resistance levels displayed to focus only on the most important levels.
3- Dynamic Confidence Zones
The indicator adds zones around support and resistance levels based on the Average True Range (ATR), helping traders visualize the ranges in which the price may interact with these levels.
The width of these zones can be adjusted using the ATR multiplier.
4- Assessing the Strength of Levels
The indicator calculates the strength of each level based on trading volume, the number of times the level has been tested (Touch Count), and the proximity of the current price to the level.
A strength score (from 0 to 100) is displayed next to each level if this feature is enabled.
5- Breakout Probability
The indicator estimates the probability of breaking each level based on momentum (ROC), the strength of the level, and the distance between the current price and the level.
The probability is displayed as a percentage if the option is enabled, helping traders anticipate potential moves.
6- Historical Liquidity Analysis
The indicator measures liquidity around each level based on the trading volume in the ranges near it.
The liquidity values can be displayed in the labels or used to adjust the width of the lines (the most liquid lines appear wider).
7- Price Targets
When this feature is enabled, the indicator calculates price targets for breakout and reversal based on momentum, level strength and ATR.
These targets can be displayed as text in the labels or as horizontal lines on the chart.
8- Fibonacci Levels
The indicator plots Fibonacci levels (0.0, 0.236, 0.382, 0.5, 0.618, 0.786, 1.0) based on the highest and lowest price in the lookback period.
The user can choose which of these levels to display or hide.
9- Comprehensive Breakout Alert
The indicator provides a single alert that includes all levels, where the alert is triggered when the price breaks any support or resistance level with a message explaining the type of breakout and the level broken.
How the indicator works
Step 1: The indicator identifies the bars with high volume during the specified Lookback Period.
Step 2: Draws support and resistance levels based on the highest and lowest prices in those bars, taking into account the number of lines selected by the user.
Step 3: Apply the trend filter (if enabled) to reduce the number of levels in case of a strong trend.
Step 4: Adds additional analyses such as strength, liquidity, breakout probability, and price targets, and draws confidence zones and Fibonacci levels according to the settings.
Step 5: Monitors the price and triggers an alert when the breakout occurs.
Customizable Settings
1- Lookback Period: Number of bars to analyze (default 300).
2- Number of Lines: From 1 to 6 support and resistance levels.
3- Colors and Styles: Line colors and styles can be changed (filled, dashed, dotted).
4- Labels: Enable/disable labels, their size, location, and text color.
5- Trend Filter: Enable/disable ADX, and modify its length and threshold.
6- Confidence Zones: Enable/disable, and modify the ATR length and multiplier.
7- Strength and Breakout Probability: Enable/disable the display, and modify the ROC length.
8- Liquidity: Enable/disable the effect of liquidity on the display of the lines and their values in the labels.
9- Price Targets: Enable/disable the targets and display them as lines.
10- Fibonacci: Choose the displayed levels and the color of the lines.
Indicator Benefits
High Accuracy: It relies on trading volume to determine the levels, which makes it more reliable than random levels.
Flexibility: It provides extensive customization options that allow traders to adapt it to their strategies.
Comprehensive Analysis: Combines support and resistance, trend, liquidity, and targets in one tool. Ease of Use: Labels and alerts make it easy to follow the market without complexity.
Labels next to each support and resistance level contain accurate numbers and information that reflect the market situation. These labels are not just decorations, but analytical tools that help traders make informed decisions based on market data. In this explanation, we will review each number or value that appears in the labels and their practical meaning.
Label Components
Labels appear next to each support and resistance level and begin with the letter "S" for support or "R" for resistance, followed by a set of numbers and values that can be enabled or disabled according to the user's settings. Here is a breakdown of each element:
1- Touch Count
Symbol: Appears immediately after "S" or "R" (example: "R: 5" or "S: 3").
Meaning: Indicates the number of times the price has tested this level without breaking it.
Benefit: The more touches, the stronger and more important the level. For example, if it is "R: 5", it means that the price has bounced off this level 5 times, making it a potentially strong resistance.
2- Strength Rating
Symbol: Appears between square brackets (example: " ").
Meaning: A value from 0 to 100 that reflects the strength of the level based on factors such as trading volume, number of touches, and proximity of the current price to the level.
Benefit: High values (such as 75 or more) indicate a strong level that is difficult to break, while low values (such as 30 or less) indicate a weak level that is easy to break. A trader can use this to determine the most reliable levels.
3- Breakout Probability
Symbol: Starts with the letter "B" followed by a percentage (example: "B: 60%").
Meaning: A percentage from 0% to 100% that shows the probability of the price breaking the level based on the current momentum, the strength of the level, and the distance between the price and the level.
Interest: A high percentage (such as 60% or more) means that the price may soon break through the level, while low percentages (such as 20%) indicate that the price may bounce. This is useful for anticipating the next move.
4- Liquidity Value
Symbol: Starts with the letter "L" followed by a number (example: "L: 1200").
Meaning: Represents the average trading volume in the range near the level, reflecting historical liquidity around it.
Interest: High values indicate high liquidity, meaning that the price may react strongly to this level (either by bouncing or breaking through). Low values indicate low liquidity, which may make the level less influential.
5- Price Targets
Symbol: Starts with "BT" (breakout target) and "RT" (rebound target) followed by numbers (example: "BT: 150.50 RT: 148.20").
Meaning:
BT (Breakout Target): The potential price that the price may reach after breaking the level.
RT (Reversal Target): The potential price that the price may reach if it rebounds from the level.
Utility: Helps traders identify potential exit points after a breakout or rebound, making it easier to develop an accurate trading plan.
Working examples
Resistance label: "R: 4 B: 25% L: 1500 BT: 155.00 RT: 152.00"
Level tested 4 times, strength 80 (very strong), probability of breakout 25% (low, i.e. higher probability of rebound), liquidity 1500 (high), breakout target 155.00, rebound target 152.00.
Conclusion: The level is strong and the price is likely to rebound from it, but if it breaks, it may reach 155.00.
Support Label: "S: 2 B: 70% L: 800 BT: 145.00 RT: 147.50"
Level tested twice, Strength 40 (medium to weak), Breakout Probability 70% (high), Liquidity 800 (medium), Breakout Target 145.00, Rebound Target 147.50.
Conclusion: The level is weak and the price is likely to break it to drop to 145.00.
How to use labels
Determine strength and weakness: Use the level's strength to see if the level is reliable for a bounce or vulnerable to a breakout.
Predict the move: Look at the Breakout Probability to determine whether to wait for a breakout or a bounce.
Risk Management: Use price targets (BT and RT) to set take profit or stop loss points.
Liquidity Evaluation: Focus on levels with high liquidity as they are often key turning points in the market.
Analysis Confirmation: Combine the number of touches with strength and liquidity to get a complete picture of the level’s importance.
Customize Labels
The user can enable or disable any of these values (strength, probability, liquidity, targets) from the indicator settings.
The size of the labels (small, normal, large), their position (right, left, top, bottom), and the color of the text can also be changed to suit your needs.
The labels in this indicator act as a small dashboard next to each support and resistance level, providing you with instant information about its strength, probability of breakout, liquidity, and price targets. By understanding these numbers, you can improve your trading decisions, whether you are looking for entry points, exit points, or risk management. If you want a tool that combines simplicity with analytical depth.
Disclaimer:
The indicator is an auxiliary tool only and should be used in conjunction with technical and fundamental analysis for best results.
Disclaimer
The information and posts are not intended to be, or constitute, any financial, investment, trading or other types of advice or recommendations provided or endorsed by TradingView.

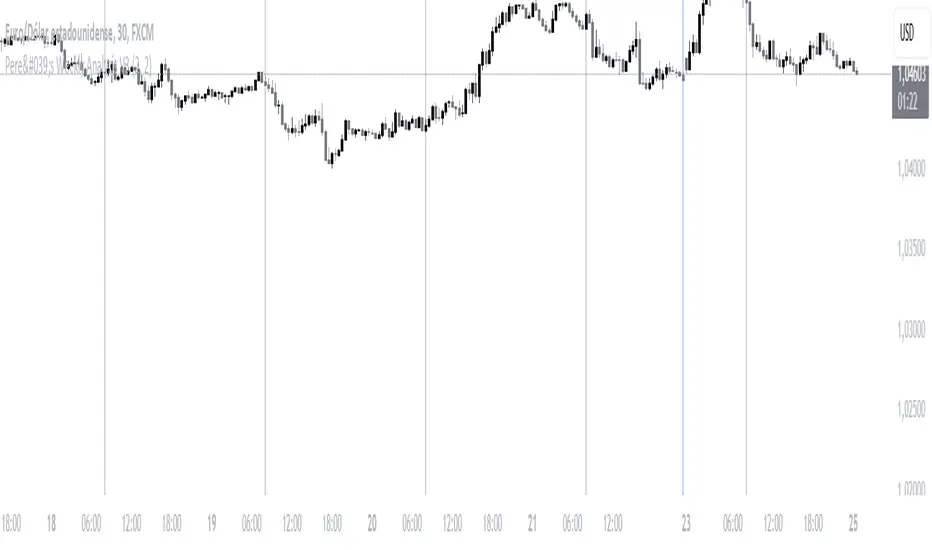
Pere's Weekly Analysis V3This indicator is very simple; it is basically composed of a series of thin vertical lines and thicker ones:
- The thin lines symbolize the opening of the London session, which marks the beginning of a new day in the forex market.
- The thick lines, due to their prominence, represent the end of a week with the closing of the Asian session.
The combination of these two lines allows for a deeper understanding of what happens each day, enabling market analysis in lower timeframes, such as a 5-minute or 10-minute chart, without losing sight of the daily opening and closing references.
This indicator can be used to identify previous days' highs and lows, mark them as potential liquidity zones, and look for price reactions to these areas during the current day. Traders can combine this indicator with their personal strategies, simplifying chart analysis.
It is essential to have a solid understanding of market behavior and always trade with optimal risk management.
ESPAÑOL:
Este indicador es muy sencillo, básicamente está compuesto por una serie de líneas verticales delgadas y otras más gruesas:
- Las delgadas simbolizan la apertura de la sesión de Londres, es decir el inicio de un día nuevo en el mercado del forex.
- Las gruesas por su saldo simbolizan el final de una semana con el cierre de la sesión asiática.
Las combinación de estas 2 líneas nos permite tener una comprensión más profunda de lo que ocurre en cada día, pudiendo analizar el mercado en temporalidades más bajas, como por ejemplo, una temporalidad de 5 minutos o de 10 minutos, Pero sin perder las referencias del inicio y final de cada día.
Este indicador se puede utilizar para identificar máximos y mínimos de los días anteriores, marcarlos como potenciales zonas de liquidez, y buscar reacciones a dichas zonas durante el día actual. Los trader puede combinar este indicar con sus estrategias personales simplificando la lectura de los gráficos.
Es importante tener una buena comprensión del comportamiento de los mercado y siempre operar con una óptima gestión del riesgo.