Non-Psychological Levels🟩 Non-Psychological Levels is a structural analysis tool that segments price action into objective ranges, identifying Broken and Unbroken levels without relying on psychological or time-based assumptions. By emphasizing mechanically derived price behavior, it provides traders with a clear framework for analyzing support and resistance in a consistent and unbiased manner across various market conditions.
This indicator introduces a new approach to understanding market structure by focusing on price movement within defined segments, free from behavioral patterns, round numbers, or specific time intervals. While the indicator is time-agnostic in design, it works within the natural time progression of the chart, ensuring that segmentation aligns with the inherent structure of price movement. Broken levels, where price has breached a structural boundary, and Unbroken levels, which remain intact, are visualized with horizontal lines. These structural zones are complemented by dynamically boxed segments that contextualize both historical and ongoing price behavior.
By offering an objective perspective, the Non-Psychological Levels indicator complements psychology-based tools, helping traders explore market dynamics from multiple angles. When structural levels align with psychological zones, they reinforce critical price areas; when they differ, they provide opportunities to analyze price behavior from an alternative lens. This indicator is designed as both an educational framework and a practical tool, encouraging a deeper understanding of structural price behavior in technical analysis.
⭕ THEORY AND CONCEPT ⭕
The Non-Psychological Levels indicator is grounded in the principle of analyzing price behavior without reliance on psychological assumptions or time-based factors. Its primary purpose is to provide a structural framework for identifying support and resistance levels by focusing solely on price movement within mechanically defined segments. By removing external influences such as sentiment, time intervals, or market sessions, the indicator offers an unbiased lens through which traders can observe price dynamics.
Non-psychology, as defined here, refers to an approach that excludes behavioral and emotional patterns—like fear, greed, or herd mentality—from price analysis. Traditional tools often depend on these patterns to identify zones such as pivots or Fibonacci retracements, but these methods can be inconsistent in volatile markets. In contrast, the Non-Psychological Levels indicator focuses entirely on what price is doing, free from assumptions about trader behavior or external time constraints.
The indicator’s time-agnostic and mechanically driven design segments price action into consistent ranges, highlighting "Broken" levels (where price breaches structural boundaries) and "Unbroken" levels (where price holds). These structural zones remain unaffected by subjective or external influences, ensuring clarity and consistency across different markets and timeframes. By doing so, the indicator reveals a pure view of price structure, independent of psychological biases.
Importantly, the Non-Psychological Levels indicator is not intended to replace psychology-based tools but to complement them. When its structural levels align with psychological zones like round numbers or session highs/lows, the significance of these areas is reinforced. Conversely, when the levels differ, the contrast provides traders with alternative insights into market dynamics. This dual perspective—blending mechanical objectivity with behavioral analysis—enhances the depth and flexibility of market evaluation.
The following principles outline the theoretical foundation of the indicator and its unique contribution to structural price analysis:
Time-Agnostic Design : The indicator avoids reliance on time-based factors like daily opens, session intervals, or specific events. Instead, it segments price action using bar indexes, ensuring that structural levels are identified independently of external time variables. While the x-axis of a chart inherently represents time, this indicator abstracts away its influence, allowing traders to focus purely on price movement without the bias of temporal context.
Mechanical and Neutral Framework : Every calculation within the indicator is predetermined by a set of mechanical rules, ensuring no subjective input or interpretation affects the results. This objectivity guarantees that levels are derived solely from observed price behavior, providing a reliable framework that traders can trust to remain consistent across different assets, timeframes, and market conditions.
Broken and Unbroken Levels : Broken levels represent zones where price has breached a structural boundary, while Unbroken levels highlight areas where price has consistently respected its range. This distinction provides a clear and systematic method for identifying key support and resistance levels, offering insights into where future price interactions are most likely to occur.
Neutral Price Behavior : By dividing price action into equal segments, the indicator removes the influence of external factors like trader sentiment or psychological expectations. Each segment independently determines significant levels based purely on price action, enabling a structural view of the market that abstracts away behavioral or emotional biases.
Complement to Psychological Tools : While the indicator itself avoids behavioral assumptions, its levels can align with psychological zones like round numbers, pivots, or Fibonacci levels. When these structural and psychological levels overlap, it reinforces the importance of key areas, while divergences offer opportunities to examine price behavior from a new perspective.
Educational Value : The indicator encourages traders to explore the contrast between structural and psychological analysis. By introducing a framework that isolates price behavior from external influences, it challenges traditional methods of technical analysis, fostering deeper insights into market structure and behavior.
🔍 UNDERSTANDING STRUCTURAL LEVELS 🔍
The Non-Psychological Levels indicator offers a straightforward yet powerful way to understand market structure by segmenting price action into mechanically defined ranges. This segmentation highlights two key elements: "Broken" levels, where price has breached structural boundaries, and "Unbroken" levels, which remain intact and respected by price action. Together, these components create a framework for identifying potential areas of support and resistance.
Broken Levels : These are structural boundaries that price has surpassed, indicating areas where previous support or resistance failed. Broken levels often signal transitions in price behavior, such as shifts in momentum or the start of trending movements. They provide insight into zones where price has already tested and moved beyond.
Unbroken Levels : These levels remain intact within a given price segment, marking areas where price has consistently respected boundaries. Unbroken levels are particularly useful for identifying potential reversal points or zones of continued support or resistance. Their persistence across price action often makes them reliable indicators of market structure.
The visual segmentation of price action into distinct ranges allows traders to observe how price transitions between structural zones. For example:
- Clusters of Unbroken levels near the current price may suggest strong support or resistance, offering areas of interest for reversals or breakouts.
- Gaps between Unbroken levels highlight areas of price inefficiency or low interaction, which may become significant if revisited.
By focusing solely on structural price behavior, the Non-Psychological Levels indicator enables traders to analyze price independently of time or psychological factors. This makes it a valuable tool for understanding price dynamics objectively, whether used on its own or alongside other indicators.
🛠️ SETTINGS 🛠️
The Non-Psychological Levels indicator offers various customizable settings to help users tailor its visualization to their specific trading style and market conditions. These settings allow adjustments to sensitivity, level projection, and the source of price calculations (e.g., wicks or closing prices). Below, we outline each setting and its impact on the chart, along with examples to illustrate their functionality.
Custom Settings
Sensitivity : This setting adjusts the balance between detailed and broader structural levels by controlling the number of segments. Higher values result in more segments, revealing finer price levels, while lower values consolidate segments to highlight major price movements.
Source : Allows the user to choose between 'Wick' or 'Close' for detecting levels. Selecting 'Wick' emphasizes the absolute highs and lows of price action, while 'Close' focuses on closing prices within each segment.
Level Labels : Configures the visual representation of price levels, allowing users to toggle between price values, symbols (▲ ▼), or disabling labels altogether. This setting ensures clarity in how Broken and Unbroken levels are displayed on the chart.
Unbroken Levels : - - - Users can customize the colors and label styles for Unbroken levels, which highlight areas where price has respected structural boundaries.
Broken Levels : -|- Similar to Unbroken levels, users can specify the visual appearance of Broken levels, including color customization for Broken highs and lows. These settings help distinguish areas where price has breached a structural boundary.
Projection Options : This setting allows users to control how broken and unbroken levels are visually extended on the chart. The Future option projects lines forward to the right of the current price, showing potential future relevance of levels. The All option extends lines both forward and backward, providing a comprehensive view of how levels align with historical and potential future price action. The None option disables projections, keeping the chart focused solely on current segment levels without any extensions.
Segments : Includes options for customizing the segment visualization:
- Live Segment : Toggles the display of a highlighted box representing the current developing segment, helping users focus on ongoing price action.
- Boxes : Allows users to display filled boxes around each segment for additional visual emphasis.
- Segment Colors : Users can define separate colors for support (lower) and resistance (upper) segments, making it easier to interpret directional trends.
- Boundaries : Enables or disables vertical lines to mark segment boundaries, providing a clearer view of structural divisions.
Repaint : This setting allows users to enable or disable triangle labels within the live segment. When enabled, the triangles dynamically update to reflect real-time price behavior during the live bar but will repaint until the bar is fully confirmed. Disabling this option prevents the triangles from appearing during the live bar, reducing potential confusion as they may otherwise flash on and off during price updates. This setting ensures users can choose their preferred visualization while maintaining clarity in real-time analysis.
Color Settings : Offers extensive customization for all visual elements, including Broken and Unbroken levels, segment boundaries, and live segments. These settings ensure the indicator can adapt to individual preferences for chart readability.
🖼️ CHART EXAMPLES 🖼️
The following chart examples illustrate different configurations and features of the Non-Psychological Levels indicator. These examples highlight how the indicator’s settings influence the visualization of structural price behavior, helping traders understand its functionality in various scenarios.
Broken and Unbroken Levels : Orange prices are Broken HIghs. Blue prices are Broken Lows. Green and Red are Unbroken.
Boundaries : Enable Boundaries to visualize segments.
High Sensitivity Setting : A high sensitivity setting produces fewer segments and levels, emphasizing broader price ranges and major structural zones. This configuration is better suited for higher timeframes or identifying overarching trends.
Low Sensitivity Setting : A low sensitivity setting results in a greater number of segments and levels, offering a granular view of price structure. This configuration is ideal for analyzing detailed price movements on lower timeframes.
Live Segment with Triangles Enabled : This example shows the live segment box with triangle labels enabled. These triangles update dynamically during the live bar but may repaint until the bar is confirmed, helping traders observe real-time price behavior.
Broken and Unbroken Levels : This example highlights Broken levels (where price has breached structural boundaries and are drawn through subsequent price action) and Unbroken levels (where price has respected structural boundaries). These distinctions visually identify areas of potential support and resistance.
Broken and Unbroken Levels with Projection: All : This example demonstrates the "Project All" feature, where broken and unbroken levels are extended both forward and backward on the chart. This visualization highlights historical and potential future support and resistance zones, helping traders better understand how price interacts with these structural levels over time.
Segment Boxes with Boundaries : Filled boxes around individual segments visually distinguish each price interval, offering clarity in observing structural price transitions.
📊 SUMMARY 📊
The Non-Psychological Levels indicator provides a unique framework for analyzing structural price behavior through the identification of Broken and Unbroken levels. These levels act as a mechanical representation of support and resistance, independent of psychological biases or time-based factors. By focusing purely on price movement within defined segments, the indicator offers a neutral and consistent approach to understanding market dynamics.
This method complements traditional tools by providing an unbiased perspective. When structural levels align with psychological zones—such as round numbers or session-based highs and lows—they reinforce the significance of these areas as key price zones. When they diverge, the indicator introduces an alternative view, prompting further exploration of price behavior. This dual perspective enhances the depth of analysis by combining the mechanical and behavioral aspects of price action.
The Non-Psychological Levels indicator is not designed to generate trading signals or predict future price movements but serves as a visual and educational tool. Its adaptability across all markets and timeframes allows traders to integrate it into their broader strategies. By highlighting structural price dynamics, the indicator offers a fresh perspective on market analysis while remaining compatible with other technical tools.
⚙️ COMPATIBILITY AND LIMITATIONS ⚙️
Asset Compatibility :
The Non-Psychological Levels indicator is compatible with all asset classes, including cryptocurrencies, forex, stocks, and commodities. It can be applied to any chart or timeframe, making it a flexible tool for structural price analysis. Users should adjust the Sensitivity setting to ensure the segmentation aligns with the price behavior of the specific asset being analyzed. For instance, higher sensitivity values are more suitable for assets with large price ranges, while lower values work well for assets with tighter ranges.
Visual Range Dependency :
The indicator is optimized to perform calculations only within the visible range of the chart. This is a significant advantage, as it prevents unnecessary calculations and maintains efficient performance. However, because of this dependency, levels may appear to "recalculate" when the chart is zoomed in or out quickly or shifted abruptly. While this does not affect the integrity of the levels, it may cause a temporary lag as the indicator adjusts to the new visual range.
Persistence of Levels Beyond Visibility :
Even if levels are not visible on the chart due to zoom or scroll settings, they still exist in the background and are recalculated when revisited. This ensures that the structural price analysis remains consistent, regardless of the chart view.
Box Limitations in Pine Script :
The indicator is subject to Pine Script's inherent limitation of 500 boxes. This means that no more than 500 segments or level boxes can be drawn on the chart simultaneously. For most configurations, this limitation is mitigated by focusing on the visual range, but users employing very low sensitivity settings may exceed the limit. In such cases, only the most recent 500 boxes will be displayed, potentially omitting earlier segments.
Lag with Low Sensitivity Settings :
When sensitivity is set to a low value, the indicator creates many more segments, resulting in finer granularity and a higher number of boxes. While this provides detailed structural levels, it may increase the likelihood of exceeding Pine Script’s 500-box limit or cause a temporary lag when rendering a dense set of boxes over a wide visual range. Users should adjust sensitivity to balance detail with performance, especially on assets with high volatility or broad price ranges.
Live Segment Caution :
The live segment box updates in real time to reflect price movements as the segment is still developing. Since the segment high and segment low are not yet finalized, users should interpret this feature as a dynamic visualization of current price behavior rather than a definitive structural analysis. This ensures clarity during ongoing price action while maintaining the integrity of the indicator's framework.
Cross-Market Versatility :
The indicator’s time-agnostic and mechanical design ensures that it functions identically across all markets and timeframes. However, users should consider the unique characteristics of different markets when interpreting the results, as certain assets (e.g., highly volatile cryptocurrencies) may require sensitivity adjustments for optimal segmentation.
Visual Range Dependency: Levels recalculate efficiently within the chart's visible range but may lag temporarily when zooming or scrolling quickly.
These considerations ensure that the Non-Psychological Levels indicator remains robust and versatile while highlighting some inherent limitations of Pine Script and real-time recalculations. Users can mitigate these constraints by carefully adjusting sensitivity and understanding how the visual range dependency affects performance.
⚠️ DISCLAIMER ⚠️
The Non-Psychological Levels indicator is a visual analysis tool and is not designed as a predictive or trading signal indicator. Its primary purpose is to highlight structural price levels, providing an objective framework for understanding support and resistance within mechanically segmented price action.
The indicator operates within the visible range of the chart to ensure efficiency and adaptiveness, but this recalculation should not be interpreted as a forecast of future price behavior. While the structural levels may align with significant price zones in hindsight, they are purely a reflection of observed price dynamics and should not be used as standalone trading signals.
This indicator is intended as an educational and visual aid to complement other analysis methods. Users are encouraged to integrate it into a broader trading strategy and make adjustments to the settings based on their individual needs and market conditions.
🧠 BEYOND THE CODE 🧠
The Non-Psychological Levels indicator, like other xxattaxx indicators , is designed with education and community collaboration in mind. Its open-source nature encourages exploration, experimentation, and the development of new approaches to price analysis. By focusing on structural price behavior rather than psychological or time-based factors, this indicator introduces a fresh perspective for users to study.
Beyond its visual utility, the indicator serves as an educational framework for understanding the concept of non-psychological analysis. It offers traders an opportunity to explore price dynamics in a purely mechanical way, challenging conventional methods and fostering deeper insights into structural behavior. This approach is especially valuable for those interested in exploring new concepts or seeking alternative perspectives on market analysis.
Your comments, suggestions, and discussions are invaluable in shaping the future of this project. We actively encourage your feedback and contributions, which will directly help us refine and improve the Non-Psychological Levels indicator. We look forward to seeing the creative ways in which you use and enhance this tool. MVS
Pesquisar nos scripts por "美国标普500指数成分股"

Industry Group StrengthThe Industry Group Strength indicator is designed to help traders identify the best-performing stocks within specific industry groups. The movement of individual stocks is often closely tied to the overall performance of their industry. By focusing on industry groups, this indicator allows you to find the top-performing stocks within an industry.
Thanks to a recent Pine Script update, an indicator like this is now possible. Special thanks to @PineCoders for introducing the dynamic requests feature.
How this indicator works:
The indicator contains predefined lists of stocks for each industry group. To be included in these lists, stocks must meet the following basic filters:
Market capitalization over 2B
Price greater than $10
Primary listing status
Once the relevant stocks are filtered, the indicator automatically recognizes the industry group of the current stock displayed on the chart. It then retrieves and displays data for that entire industry group.
Data Points Available:
The user can choose between three different data points to rank and compare stocks:
YTD (Year-To-Date) Return: Measures how much a stock has gained or lost since the start of the year.
RS Rating: A relative strength rating for a user-selected lookback period (explained below).
% Return: The percentage return over a user-selected lookback period.
Stock Ranking:
Stocks are ranked based on their performance within their respective industry groups, allowing users to easily identify which stocks are leading or lagging behind others in the same sector.
Visualization:
The indicator presents stocks in a table format, with performance metrics displayed both as text labels and color-coded lines. The color gradient represents the percentile rank, making it visually clear which stocks are outperforming or underperforming within their industry group.
Relative Strength (RS):
Relative Strength (RS) measures a stock’s performance relative to a benchmark, typically the S&P 500 (the default setting). It is calculated by dividing the closing price of the stock by the closing price of the S&P 500.
If the stock rises while the S&P 500 falls, or if the stock rises more sharply than the S&P 500, the RS value increases. Conversely, if the stock falls while the S&P 500 rises, the RS value decreases. This indicator normalizes the RS value into a range from 1 to 99, allowing for easier comparison across different stocks, regardless of their raw performance. This normalized RS value helps traders quickly assess how a stock is performing relative to others.

SP500 RatiosThe "SP500 Ratios" indicator is a powerful tool developed for the TradingView platform, allowing users to access a variety of financial ratios and inflation-adjusted data related to the S&P 500 index. This indicator integrates with Nasdaq Data Link (formerly known as Quandl) to retrieve historical data, providing a comprehensive overview of key financial metrics associated with the S&P 500.
Key Features
Price to Sales Ratio: Quarterly ratio of price to sales (revenue) for the S&P 500.
Dividend Yield: Monthly dividend yield based on 12-month dividend per share.
Price Earnings Ratio (PE Ratio): Monthly price-to-earnings ratio based on trailing twelve-month reported earnings.
CAPE Ratio (Shiller PE Ratio): Monthly cyclically adjusted PE ratio, based on average inflation-adjusted earnings over the past ten years.
Earnings Yield: Monthly earnings yield, the inverse of the PE ratio.
Price to Book Ratio: Quarterly ratio of price to book value.
Inflation Adjusted S&P 500: Monthly S&P 500 level adjusted for inflation.
Revenue Per Share: Quarterly trailing twelve-month sales per share, not adjusted for inflation.
Earnings Per Share: Monthly real earnings per share, adjusted for inflation.
User Configuration
The indicator offers flexibility through user-configurable options. You can choose to display or hide each metric according to your analysis needs. Users can also adjust the line width for better visibility on the chart.
Visualization
The selected data is plotted on the chart with distinct colors for each metric, facilitating visual analysis. A dynamic legend table is also generated in the top-right corner of the chart, listing the currently displayed metrics with their associated colors.
This indicator is ideal for traders and analysts seeking detailed insights into the financial performance and valuations of the S&P 500, while benefiting from the customization flexibility offered by TradingView.

Volatility Projection Levels (VPL)### Indicator Name: **Volatility Projection Levels (VPL)**
### Description:
The **Volatility Projection Levels (VPL)** indicator is a powerful tool designed to help traders anticipate key support and resistance levels for the E-mini S&P 500 (ES) by leveraging the CBOE Volatility Index (^VIX). This indicator utilizes historical volatility data to project potential price movements for the upcoming month, offering clear visual cues that enhance swing trading strategies.
### Key Features:
- **Volatility-Based Projections**: The VPL indicator uses the previous month’s closing value of the VIX, normalizing it for monthly analysis by dividing by the square root of 12. This calculated percentage is then applied to the E-mini S&P 500’s closing price from the last day of the previous month.
- **Upper and Lower Projection Levels**: The indicator calculates two essential levels:
- **Upper Projection Level**: The previous month’s closing price of the E-mini S&P 500 plus the calculated volatility percentage.
- **Lower Projection Level**: The previous month’s closing price of the E-mini S&P 500 minus the calculated volatility percentage.
- **Continuous Visualization**: The VPL indicator plots these projection levels on the chart throughout the entire month, providing traders with a consistent reference for potential support and resistance zones. This continuous visualization allows for better anticipation of market movements.
- **Previous Month's Close Reference**: Additionally, the indicator plots the previous month’s closing price as a reference point, offering further context for current price action.
### Use Cases:
- **Swing Trading**: The VPL indicator is ideal for swing traders looking to exploit predicted price ranges within a monthly timeframe.
- **Support & Resistance Identification**: It aids traders in identifying critical levels where the market may encounter support or resistance, thus informing entry and exit decisions.
- **Risk Management**: By forecasting potential price levels, traders can set more strategic stop-loss and take-profit levels, enhancing risk management.
### Summary:
The **Volatility Projection Levels (VPL)** indicator equips traders with a forward-looking tool that incorporates volatility data into market analysis. By projecting key price levels based on historical VIX data, the VPL indicator enhances decision-making, helping traders anticipate market movements and optimize their trading strategies.
Made by Serpenttrading

Market Breadth - AsymmetrikMarket Breadth - Asymmetrik User Manual
Overview
The Market Breadth - Asymmetrik is a script designed to provide insights into the overall market condition by plotting three key indicators based on stocks within the S&P 500 index. It helps traders assess market momentum and strength through visual cues and is especially useful for understanding the proportion of stocks trading above their respective moving averages.
Features
1. Market Breadth Indicators:
- Breadth 20D (green line): Represents the percentage of stocks in the S&P 500 that are above their 20-day moving average.
- Breadth 50D (yellow line): Represents the percentage of stocks in the S&P 500 that are above their 50-day moving average.
- Breadth 100D (red line): Represents the percentage of stocks in the S&P 500 that are above their 100-day moving average.
2. Horizontal Lines for Context:
- Green line at 10%
- Lighter green line at 20%
- Grey line at 50%
- Light red line at 80%
- Dark red line at 90%
3. Background Color Alerts:
- Green background when all three indicators are under 20%, indicating a potential oversold market condition.
- Red background when all three indicators are over 80%, indicating a potential overbought market condition.
Interpreting the Indicator
- Market Breadth Lines: Observe the plotted lines to assess the percentage of stocks above their moving averages.
- Horizontal Lines: Use the horizontal lines to quickly identify important threshold levels.
- Background Colors: Pay attention to background colors for quick insights:
- Green: All indicators suggest a potentially oversold market condition (below 20).
- Red: All indicators suggest a potentially overbought market condition (above 80).
Troubleshooting
- If the indicator does not appear as expected, please contact me.
- This indicator works only on daily and weekly timeframes.
Conclusion
This Market Breadth Indicator offers a visual representation of market momentum and strength through three key indicators, helping you identify potential buying and selling zones.

Earnings Yield & Dividend Yield (vs SP500, treasury, IG)# What's this script?
I created this because I wanted to compare the Earnings/Dividend yield of SP500 and the symbol with the time period of the chart.
Plot the following yields.
Earnings Yield of S&P500.
Calculated using S&P 500 Earnings by Month provided by Nasdaq date link.
(data.nasdaq.com)
Dividend Yield of S&P500.
Calculated using S&P 500 Dividend by Month provided by Nasdaq date link.
(data.nasdaq.com)
Earnings Yield of the displayed symbol.
Dividend Yield of the displayed symbol.
Treasury constant maturity rate. default is 10Y(FRED:DGS10).
Investment grade corporate bond yields by Moody's.
Grades from Aaa to Baa are represented by color bands.
Investment grade bond yields by BofA.
Grades from AAA to BBB are represented by color bands.
-----------
◇これなに?
request.quandl()を用いてSP500の益回りと配当利回りが得られますが
月間データなのでチャートの時間間隔でみたかったのと、
SP500とシンボルの益回りや配当利回りを比較したかったのでつくりました。
下記を表示します
- SP500の益回りと配当利回り
- 表示シンボルの益回りや配当利回り
- 設定画面で指定した財務省債券(デフォルトは10年)
- 投資適格社債(MoodysとBofAでかなり違ったので両方)をカラーバンドで表示
かんたんなものですけど、おやくにたてればさいわいです

Rsi strategy for BTC with (Rsi SPX)
I hope this strategy is just an idea and a starting point, I use the correlation of the Sp500 with the Btc, this does not mean that this correlation will exist forever!. I love Trading view and I'm learning to program, I find correlations very interesting and here is a simple strategy.
This is a trading strategy script written in Pine Script language for use in TradingView. Here is a brief overview of the strategy:
The script uses the RSI (Relative Strength Index) technical indicator with a period of 14 on two securities: the S&P 500 (SPX) and the symbol corresponding to the current chart (presumably Bitcoin, based on the variable name "Btc_1h_fixed"). The RSI is plotted on the chart for both securities.
The script then sets up two trading conditions using the RSI values:
A long entry condition: when the RSI for the current symbol crosses above the RSI for the S&P 500, a long trade is opened using the "strategy.entry" function.
A short entry condition: when the RSI for the current symbol crosses below the RSI for the S&P 500, a short trade is opened using the "strategy.entry" function.
The script also includes a take profit input parameter that allows the user to set a percentage profit target for closing the trade. The take profit is set using the "strategy.exit" function.
Overall, the strategy aims to take advantage of divergences in RSI values between the current symbol and the S&P 500 by opening long or short trades accordingly. The take profit parameter allows the user to set a specific profit target for each trade. However, the script does not include any stop loss or risk management features, which should be considered when implementing the strategy in a real trading scenario.

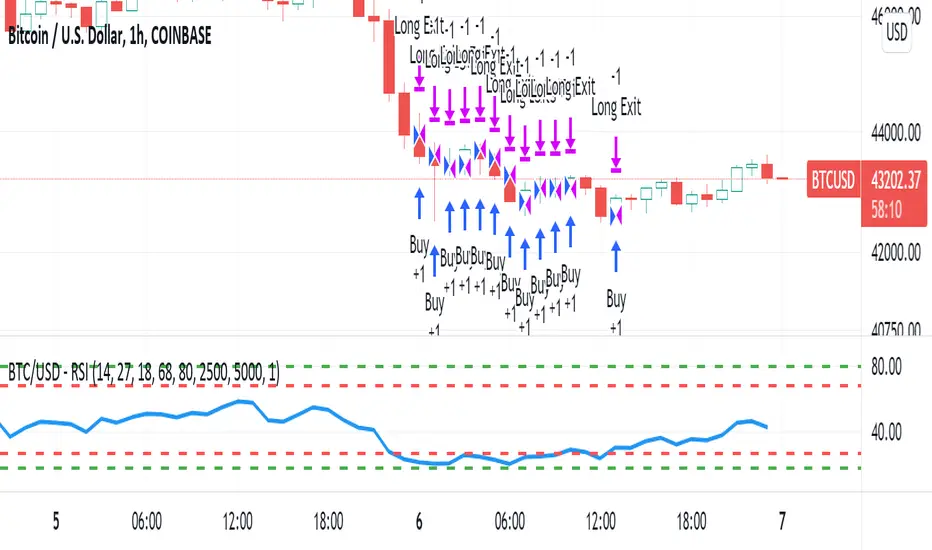
BTC/USD - RSIIF RSI (14) reaches 68 ... sell 1 lot size ( with TP 250 points and SL 500 points)
IF RSI (14) reaches 27 ... buy 1 lot size ( with TP 250points and SL 500 points)
IF RSI (14) reaches 80 ... sell 1 lot size ( with TP 250 points and SL 500 points)
IF RSI (14) reaches 18 ... buy 1 lot size ( with TP 250points and SL 500 points)
VIX MTF MomentumSweet little momentum gadget to track the VIX Index.
What is the VIX?
The CBOE S&P 500 Volatility Index (VIX) is known as the 'Fear Index' which can measure how worried traders are that the S&P 500 might suddenly drop within the next 30 days.
When the VIX starts moving higher, it is telling you that traders are getting nervous. When the VIX starts moving lower, it is telling you that traders are gaining confidence.
VIX calculation?
The Chicago Board of Options Exchange Market Volatility Index (VIX) is a measure of implied volatility (Of the S&P 500 securities options), based on the prices of a basket of S&P 500 Index options with 30 days to expiration.
How to use:
If VIX Momentum is above 0 (RED) traders are getting nervous.
If VIX Momentum is below 0 (GREEN) traders are gaining confidence.
Follow to get updates and new scripts: www.tradingview.com

Open Interest Rank-BuschiEnglish:
One part of the "Commitment of Traders-Report" is the Open Interest which is shown in this indicator (source: Quandl database).
Unlike my also published indicator "Open Interest-Buschi", the values here are not absolute but in a ranking system from 0 to 100 with individual time frames-
The following futures are included:
30-year Bonds (ZB)
10-year Notes ( ZN )
Soybeans (ZS)
Soybean Meal (ZM)
Soybean Oil (ZL)
Corn ( ZC )
Soft Red Winter Wheat (ZW)
Hard Red Winter Wheat (KE)
Lean Hogs (HE)
Live Cattle ( LE )
Gold ( GC )
Silver (SI)
Copper (HG)
Crude Oil ( CL )
Heating Oil (HO)
RBOB Gasoline ( RB )
Natural Gas ( NG )
Australian Dollar (A6)
British Pound (B6)
Canadian Dollar (D6)
Euro (E6)
Japanese Yen (J6)
Swiss Franc (S6)
Sugar ( SB )
Coffee (KC)
Cocoa ( CC )
Cotton ( CT )
S&P 500 E-Mini (ES)
Russell 2000 E-Mini (RTY)
Dow Jones Industrial Mini (YM)
Nasdaq 100 E-Mini (NQ)
Platin (PL)
Palladium (PA)
Aluminium (AUP)
Steel ( HRC )
Ethanol (AEZ)
Brent Crude Oil (J26)
Rice (ZR)
Oat (ZO)
Milk (DL)
Orange Juice (JO)
Lumber (LS)
Feeder Cattle (GF)
S&P 500 ( SP )
Dow Jones Industrial Average Index (DJIA)
New Zealand Dollar (N6)
Deutsch:
Ein Bestandteil des "Commitment of Traders-Report" ist das Open Interest, das in diesem Indikator dargestellt wird (Quelle: Quandl Datenbank).
Anders als in meinem ebenfalls veröffentlichten Indikator "Open Interest-Buschi" werden hier nicht die absoluten Werte dargestellt, sondern in einem Ranking-System von 0 bis 100 mit individuellen Zeitrahmen.
Folgende Futures sind enthalten:
30-jährige US-Staatsanleihen (ZB)
10-jährige US-Staatsanleihen ( ZN )
Sojabohnen(ZS)
Sojabohnen-Mehl (ZM)
Sojabohnen-Öl (ZL)
Mais( ZC )
Soft Red Winter-Weizen (ZW)
Hard Red Winter-Weizen (KE)
Magerschweine (HE)
Lebendrinder ( LE )
Gold ( GC )
Silber (SI)
Kupfer(HG)
Rohöl ( CL )
Heizöl (HO)
Benzin ( RB )
Erdgas ( NG )
Australischer Dollar (A6)
Britisches Pfund (B6)
Kanadischer Dollar (D6)
Euro (E6)
Japanischer Yen (J6)
Schweizer Franken (S6)
Zucker ( SB )
Kaffee (KC)
Kakao ( CC )
Baumwolle ( CT )
S&P 500 E-Mini (ES)
Russell 2000 E-Mini (RTY)
Dow Jones Industrial Mini (YM)
Nasdaq 100 E-Mini (NQ)
Platin (PL)
Palladium (PA)
Aluminium (AUP)
Stahl ( HRC )
Ethanol (AEZ)
Brent Rohöl (J26)
Reis (ZR)
Hafer (ZO)
Milch (DL)
Orangensaft (JO)
Holz (LS)
Mastrinder (GF)
S&P 500 ( SP )
Dow Jones Industrial Average Index (DJIA)
Neuseeland Dollar (N6)

Open Interest-Buschi
English:
One part of the "Commitment of Traders-Report" is the Open Interest which is shown in this indicator (source: Quandl database).
The following futures are included:
30-year Bonds (ZB)
10-year Notes (ZN)
Soybeans (ZS)
Soybean Meal (ZM)
Soybean Oil (ZL)
Corn (ZC)
Soft Red Winter Wheat (ZW)
Hard Red Winter Wheat(KE)
Lean Hogs (HE)
Live Cattle (LE)
Gold (GC)
Silver (SI)
Copper (HG)
Crude Oil (CL)
Heating Oil (HO)
RBOB Gasoline (RB)
Natural Gas (NG)
Australian Dollar (A6)
British Pound (B6)
Canadian Dollar (D6)
Euro (E6)
Japanese Yen (J6)
Swiss Franc (S6)
Sugar (SB)
Coffee (KC)
Cocoa (CC)
Cotton (CT)
S&P 500 E-Mini (ES)
Russell 2000 E-Mini (RTY)
Dow Jones Industrial Mini (YM)
Nasdaq 100 E-Mini (NQ)
Platin (PL)
Palladium (PA)
Aluminium (AUP)
Steel (HRC)
Ethanol (AEZ)
Brent Crude Oil (J26)
Rice (ZR)
Oat (ZO)
Milk (DL)
Orange Juice (JO)
Lumber (LS)
Feeder Cattle (GF)
S&P 500 (SP)
Dow Jones Industrial Average Index (DJIA)
New Zealand Dollar (N6)
Deutsch:
Ein Bestandteil des "Commitment of Traders-Report" ist das Open Interest, das in diesem Indikator dargestellt wird (Quelle: Quandl Datenbank).
Folgende Futures sind enthalten:
30-jährige US-Staatsanleihen (ZB)
10-jährige US-Staatsanleihen (ZN)
Sojabohnen(ZS)
Sojabohnen-Mehl (ZM)
Sojabohnen-Öl (ZL)
Mais(ZC)
Soft Red Winter-Weizen (ZW)
Hard Red Winter-Weizen (KE)
Magerschweine (HE)
Lebendrinder (LE)
Gold (GC)
Silber (SI)
Kupfer(HG)
Rohöl (CL)
Heizöl (HO)
Benzin (RB)
Erdgas (NG)
Australischer Dollar (A6)
Britisches Pfund (B6)
Kanadischer Dollar (D6)
Euro (E6)
Japanischer Yen (J6)
Schweizer Franken (S6)
Zucker (SB)
Kaffee (KC)
Kakao (CC)
Baumwolle (CT)
S&P 500 E-Mini (ES)
Russell 2000 E-Mini (RTY)
Dow Jones Industrial Mini (YM)
Nasdaq 100 E-Mini (NQ)
Platin (PL)
Palladium (PA)
Aluminium (AUP)
Stahl (HRC)
Ethanol (AEZ)
Brent Rohöl (J26)
Reis (ZR)
Hafer (ZO)
Milch (DL)
Orangensaft (JO)
Holz (LS)
Mastrinder (GF)
S&P 500 (SP)
Dow Jones Industrial Average Index (DJIA)
Neuseeland Dollar (N6)

Dynamic Equity Allocation Model//@version=6
indicator('Dynamic Equity Allocation Model', shorttitle = 'DEAM', overlay = false, precision = 1, scale = scale.right, max_bars_back = 500)
// DYNAMIC EQUITY ALLOCATION MODEL
// Quantitative framework for dynamic portfolio allocation between stocks and cash.
// Analyzes five dimensions: market regime, risk metrics, valuation, sentiment,
// and macro conditions to generate allocation recommendations (0-100% equity).
//
// Uses real-time data from TradingView including fundamentals (P/E, ROE, ERP),
// volatility indicators (VIX), credit spreads, yield curves, and market structure.
// INPUT PARAMETERS
group1 = 'Model Configuration'
model_type = input.string('Adaptive', 'Allocation Model Type', options = , group = group1, tooltip = 'Conservative: Slower to increase equity, Aggressive: Faster allocation changes, Adaptive: Dynamic based on regime')
use_crisis_detection = input.bool(true, 'Enable Crisis Detection System', group = group1, tooltip = 'Automatic detection and response to crisis conditions')
use_regime_model = input.bool(true, 'Use Market Regime Detection', group = group1, tooltip = 'Identify Bull/Bear/Crisis regimes for dynamic allocation')
group2 = 'Portfolio Risk Management'
target_portfolio_volatility = input.float(12.0, 'Target Portfolio Volatility (%)', minval = 3, maxval = 20, step = 0.5, group = group2, tooltip = 'Target portfolio volatility (Cash reduces volatility: 50% Equity = ~10% vol, 100% Equity = ~20% vol)')
max_portfolio_drawdown = input.float(15.0, 'Maximum Portfolio Drawdown (%)', minval = 5, maxval = 35, step = 2.5, group = group2, tooltip = 'Maximum acceptable PORTFOLIO drawdown (not market drawdown - portfolio with cash has lower drawdown)')
enable_portfolio_risk_scaling = input.bool(true, 'Enable Portfolio Risk Scaling', group = group2, tooltip = 'Scale allocation based on actual portfolio risk characteristics (recommended)')
risk_lookback = input.int(252, 'Risk Calculation Period (Days)', minval = 60, maxval = 504, group = group2, tooltip = 'Period for calculating volatility and risk metrics')
group3 = 'Component Weights (Total = 100%)'
w_regime = input.float(35.0, 'Market Regime Weight (%)', minval = 0, maxval = 100, step = 5, group = group3)
w_risk = input.float(25.0, 'Risk Metrics Weight (%)', minval = 0, maxval = 100, step = 5, group = group3)
w_valuation = input.float(20.0, 'Valuation Weight (%)', minval = 0, maxval = 100, step = 5, group = group3)
w_sentiment = input.float(15.0, 'Sentiment Weight (%)', minval = 0, maxval = 100, step = 5, group = group3)
w_macro = input.float(5.0, 'Macro Weight (%)', minval = 0, maxval = 100, step = 5, group = group3)
group4 = 'Crisis Detection Thresholds'
crisis_vix_threshold = input.float(40, 'Crisis VIX Level', minval = 30, maxval = 80, group = group4, tooltip = 'VIX level indicating crisis conditions (COVID peaked at 82)')
crisis_drawdown_threshold = input.float(15, 'Crisis Drawdown Threshold (%)', minval = 10, maxval = 30, group = group4, tooltip = 'Market drawdown indicating crisis conditions')
crisis_credit_spread = input.float(500, 'Crisis Credit Spread (bps)', minval = 300, maxval = 1000, group = group4, tooltip = 'High yield spread indicating crisis conditions')
group5 = 'Display Settings'
show_components = input.bool(false, 'Show Component Breakdown', group = group5, tooltip = 'Display individual component analysis lines')
show_regime_background = input.bool(true, 'Show Dynamic Background', group = group5, tooltip = 'Color background based on allocation signals')
show_reference_lines = input.bool(false, 'Show Reference Lines', group = group5, tooltip = 'Display allocation percentage reference lines')
show_dashboard = input.bool(true, 'Show Analytics Dashboard', group = group5, tooltip = 'Display comprehensive analytics table')
show_confidence_bands = input.bool(false, 'Show Confidence Bands', group = group5, tooltip = 'Display uncertainty quantification bands')
smoothing_period = input.int(3, 'Smoothing Period', minval = 1, maxval = 10, group = group5, tooltip = 'Smoothing to reduce allocation noise')
background_intensity = input.int(95, 'Background Intensity (%)', minval = 90, maxval = 99, group = group5, tooltip = 'Higher values = more transparent background')
// Styling Options
color_scheme = input.string('EdgeTools', 'Color Theme', options = , group = 'Appearance', tooltip = 'Professional color themes')
use_dark_mode = input.bool(true, 'Optimize for Dark Theme', group = 'Appearance')
main_line_width = input.int(3, 'Main Line Width', minval = 1, maxval = 5, group = 'Appearance')
// DATA RETRIEVAL
// Market Data
sp500 = request.security('SPY', timeframe.period, close)
sp500_high = request.security('SPY', timeframe.period, high)
sp500_low = request.security('SPY', timeframe.period, low)
sp500_volume = request.security('SPY', timeframe.period, volume)
// Volatility Indicators
vix = request.security('VIX', timeframe.period, close)
vix9d = request.security('VIX9D', timeframe.period, close)
vxn = request.security('VXN', timeframe.period, close)
// Fixed Income and Credit
us2y = request.security('US02Y', timeframe.period, close)
us10y = request.security('US10Y', timeframe.period, close)
us3m = request.security('US03MY', timeframe.period, close)
hyg = request.security('HYG', timeframe.period, close)
lqd = request.security('LQD', timeframe.period, close)
tlt = request.security('TLT', timeframe.period, close)
// Safe Haven Assets
gold = request.security('GLD', timeframe.period, close)
usd = request.security('DXY', timeframe.period, close)
yen = request.security('JPYUSD', timeframe.period, close)
// Financial data with fallback values
get_financial_data(symbol, fin_id, period, fallback) =>
data = request.financial(symbol, fin_id, period, ignore_invalid_symbol = true)
na(data) ? fallback : data
// SPY fundamental metrics
spy_earnings_per_share = get_financial_data('AMEX:SPY', 'EARNINGS_PER_SHARE_BASIC', 'TTM', 20.0)
spy_operating_earnings_yield = get_financial_data('AMEX:SPY', 'OPERATING_EARNINGS_YIELD', 'FY', 4.5)
spy_dividend_yield = get_financial_data('AMEX:SPY', 'DIVIDENDS_YIELD', 'FY', 1.8)
spy_buyback_yield = get_financial_data('AMEX:SPY', 'BUYBACK_YIELD', 'FY', 2.0)
spy_net_margin = get_financial_data('AMEX:SPY', 'NET_MARGIN', 'TTM', 12.0)
spy_debt_to_equity = get_financial_data('AMEX:SPY', 'DEBT_TO_EQUITY', 'FY', 0.5)
spy_return_on_equity = get_financial_data('AMEX:SPY', 'RETURN_ON_EQUITY', 'FY', 15.0)
spy_free_cash_flow = get_financial_data('AMEX:SPY', 'FREE_CASH_FLOW', 'TTM', 100000000)
spy_ebitda = get_financial_data('AMEX:SPY', 'EBITDA', 'TTM', 200000000)
spy_pe_forward = get_financial_data('AMEX:SPY', 'PRICE_EARNINGS_FORWARD', 'FY', 18.0)
spy_total_debt = get_financial_data('AMEX:SPY', 'TOTAL_DEBT', 'FY', 500000000)
spy_total_equity = get_financial_data('AMEX:SPY', 'TOTAL_EQUITY', 'FY', 1000000000)
spy_enterprise_value = get_financial_data('AMEX:SPY', 'ENTERPRISE_VALUE', 'FY', 30000000000)
spy_revenue_growth = get_financial_data('AMEX:SPY', 'REVENUE_ONE_YEAR_GROWTH', 'TTM', 5.0)
// Market Breadth Indicators
nya = request.security('NYA', timeframe.period, close)
rut = request.security('IWM', timeframe.period, close)
// Sector Performance
xlk = request.security('XLK', timeframe.period, close)
xlu = request.security('XLU', timeframe.period, close)
xlf = request.security('XLF', timeframe.period, close)
// MARKET REGIME DETECTION
// Calculate Market Trend
sma_20 = ta.sma(sp500, 20)
sma_50 = ta.sma(sp500, 50)
sma_200 = ta.sma(sp500, 200)
ema_10 = ta.ema(sp500, 10)
// Market Structure Score
trend_strength = 0.0
trend_strength := trend_strength + (sp500 > sma_20 ? 1 : -1)
trend_strength := trend_strength + (sp500 > sma_50 ? 1 : -1)
trend_strength := trend_strength + (sp500 > sma_200 ? 2 : -2)
trend_strength := trend_strength + (sma_50 > sma_200 ? 2 : -2)
// Volatility Regime
returns = math.log(sp500 / sp500 )
realized_vol_20d = ta.stdev(returns, 20) * math.sqrt(252) * 100
realized_vol_60d = ta.stdev(returns, 60) * math.sqrt(252) * 100
ewma_vol = ta.ema(math.pow(returns, 2), 20)
realized_vol = math.sqrt(ewma_vol * 252) * 100
vol_premium = vix - realized_vol
// Drawdown Calculation
running_max = ta.highest(sp500, risk_lookback)
current_drawdown = (running_max - sp500) / running_max * 100
// Regime Score
regime_score = 0.0
// Trend Component (40%)
if trend_strength >= 4
regime_score := regime_score + 40
regime_score
else if trend_strength >= 2
regime_score := regime_score + 30
regime_score
else if trend_strength >= 0
regime_score := regime_score + 20
regime_score
else if trend_strength >= -2
regime_score := regime_score + 10
regime_score
else
regime_score := regime_score + 0
regime_score
// Volatility Component (30%)
if vix < 15
regime_score := regime_score + 30
regime_score
else if vix < 20
regime_score := regime_score + 25
regime_score
else if vix < 25
regime_score := regime_score + 15
regime_score
else if vix < 35
regime_score := regime_score + 5
regime_score
else
regime_score := regime_score + 0
regime_score
// Drawdown Component (30%)
if current_drawdown < 3
regime_score := regime_score + 30
regime_score
else if current_drawdown < 7
regime_score := regime_score + 20
regime_score
else if current_drawdown < 12
regime_score := regime_score + 10
regime_score
else if current_drawdown < 20
regime_score := regime_score + 5
regime_score
else
regime_score := regime_score + 0
regime_score
// Classify Regime
market_regime = regime_score >= 80 ? 'Strong Bull' : regime_score >= 60 ? 'Bull Market' : regime_score >= 40 ? 'Neutral' : regime_score >= 20 ? 'Correction' : regime_score >= 10 ? 'Bear Market' : 'Crisis'
// RISK-BASED ALLOCATION
// Calculate Market Risk
parkinson_hl = math.log(sp500_high / sp500_low)
parkinson_vol = parkinson_hl / (2 * math.sqrt(math.log(2))) * math.sqrt(252) * 100
garman_klass_vol = math.sqrt((0.5 * math.pow(math.log(sp500_high / sp500_low), 2) - (2 * math.log(2) - 1) * math.pow(math.log(sp500 / sp500 ), 2)) * 252) * 100
market_volatility_20d = math.max(ta.stdev(returns, 20) * math.sqrt(252) * 100, parkinson_vol)
market_volatility_60d = ta.stdev(returns, 60) * math.sqrt(252) * 100
market_drawdown = current_drawdown
// Initialize risk allocation
risk_allocation = 50.0
if enable_portfolio_risk_scaling
// Volatility-based allocation
vol_based_allocation = target_portfolio_volatility / math.max(market_volatility_20d, 5.0) * 100
vol_based_allocation := math.max(0, math.min(100, vol_based_allocation))
// Drawdown-based allocation
dd_based_allocation = 100.0
if market_drawdown > 1.0
dd_based_allocation := max_portfolio_drawdown / market_drawdown * 100
dd_based_allocation := math.max(0, math.min(100, dd_based_allocation))
dd_based_allocation
// Combine (conservative)
risk_allocation := math.min(vol_based_allocation, dd_based_allocation)
// Dynamic adjustment
current_equity_estimate = 50.0
estimated_portfolio_vol = current_equity_estimate / 100 * market_volatility_20d
estimated_portfolio_dd = current_equity_estimate / 100 * market_drawdown
vol_utilization = estimated_portfolio_vol / target_portfolio_volatility
dd_utilization = estimated_portfolio_dd / max_portfolio_drawdown
risk_utilization = math.max(vol_utilization, dd_utilization)
risk_adjustment_factor = 1.0
if risk_utilization > 1.0
risk_adjustment_factor := math.exp(-0.5 * (risk_utilization - 1.0))
risk_adjustment_factor := math.max(0.5, risk_adjustment_factor)
risk_adjustment_factor
else if risk_utilization < 0.9
risk_adjustment_factor := 1.0 + 0.2 * math.log(1.0 / risk_utilization)
risk_adjustment_factor := math.min(1.3, risk_adjustment_factor)
risk_adjustment_factor
risk_allocation := risk_allocation * risk_adjustment_factor
risk_allocation
else
vol_scalar = target_portfolio_volatility / math.max(market_volatility_20d, 10)
vol_scalar := math.min(1.5, math.max(0.2, vol_scalar))
drawdown_penalty = 0.0
if current_drawdown > max_portfolio_drawdown
drawdown_penalty := (current_drawdown - max_portfolio_drawdown) / max_portfolio_drawdown
drawdown_penalty := math.min(1.0, drawdown_penalty)
drawdown_penalty
risk_allocation := 100 * vol_scalar * (1 - drawdown_penalty)
risk_allocation
risk_allocation := math.max(0, math.min(100, risk_allocation))
// VALUATION ANALYSIS
// Valuation Metrics
actual_pe_ratio = spy_earnings_per_share > 0 ? sp500 / spy_earnings_per_share : spy_pe_forward
actual_earnings_yield = nz(spy_operating_earnings_yield, 0) > 0 ? spy_operating_earnings_yield : 100 / actual_pe_ratio
total_shareholder_yield = spy_dividend_yield + spy_buyback_yield
// Equity Risk Premium (multi-method calculation)
method1_erp = actual_earnings_yield - us10y
method2_erp = actual_earnings_yield + spy_buyback_yield - us10y
payout_ratio = spy_dividend_yield > 0 and actual_earnings_yield > 0 ? spy_dividend_yield / actual_earnings_yield : 0.4
sustainable_growth = spy_return_on_equity * (1 - payout_ratio) / 100
method3_erp = spy_dividend_yield + sustainable_growth * 100 - us10y
implied_growth = spy_revenue_growth * 0.7
method4_erp = total_shareholder_yield + implied_growth - us10y
equity_risk_premium = method1_erp * 0.35 + method2_erp * 0.30 + method3_erp * 0.20 + method4_erp * 0.15
ev_ebitda_ratio = spy_enterprise_value > 0 and spy_ebitda > 0 ? spy_enterprise_value / spy_ebitda : 15.0
debt_equity_health = spy_debt_to_equity < 1.0 ? 1.2 : spy_debt_to_equity < 2.0 ? 1.0 : 0.8
// Valuation Score
base_valuation_score = 50.0
if equity_risk_premium > 4
base_valuation_score := 95
base_valuation_score
else if equity_risk_premium > 3
base_valuation_score := 85
base_valuation_score
else if equity_risk_premium > 2
base_valuation_score := 70
base_valuation_score
else if equity_risk_premium > 1
base_valuation_score := 55
base_valuation_score
else if equity_risk_premium > 0
base_valuation_score := 40
base_valuation_score
else if equity_risk_premium > -1
base_valuation_score := 25
base_valuation_score
else
base_valuation_score := 10
base_valuation_score
growth_adjustment = spy_revenue_growth > 10 ? 10 : spy_revenue_growth > 5 ? 5 : 0
margin_adjustment = spy_net_margin > 15 ? 5 : spy_net_margin < 8 ? -5 : 0
roe_adjustment = spy_return_on_equity > 20 ? 5 : spy_return_on_equity < 10 ? -5 : 0
valuation_score = base_valuation_score + growth_adjustment + margin_adjustment + roe_adjustment
valuation_score := math.max(0, math.min(100, valuation_score * debt_equity_health))
// SENTIMENT ANALYSIS
// VIX Term Structure
vix_term_structure = vix9d > 0 ? vix / vix9d : 1
backwardation = vix_term_structure > 1.05
steep_backwardation = vix_term_structure > 1.15
// Safe Haven Flows
gold_momentum = ta.roc(gold, 20)
dollar_momentum = ta.roc(usd, 20)
yen_momentum = ta.roc(yen, 20)
treasury_momentum = ta.roc(tlt, 20)
safe_haven_flow = gold_momentum * 0.3 + treasury_momentum * 0.3 + dollar_momentum * 0.25 + yen_momentum * 0.15
// Advanced Sentiment Analysis
vix_percentile = ta.percentrank(vix, 252)
vix_zscore = (vix - ta.sma(vix, 252)) / ta.stdev(vix, 252)
vix_momentum = ta.roc(vix, 5)
vvix_proxy = ta.stdev(vix_momentum, 20) * math.sqrt(252)
risk_reversal_proxy = (vix - realized_vol) / realized_vol
// Sentiment Score
base_sentiment = 50.0
vix_adjustment = 0.0
if vix_zscore < -1.5
vix_adjustment := 40
vix_adjustment
else if vix_zscore < -0.5
vix_adjustment := 20
vix_adjustment
else if vix_zscore < 0.5
vix_adjustment := 0
vix_adjustment
else if vix_zscore < 1.5
vix_adjustment := -20
vix_adjustment
else
vix_adjustment := -40
vix_adjustment
term_structure_adjustment = backwardation ? -15 : steep_backwardation ? -30 : 5
vvix_adjustment = vvix_proxy > 2.0 ? -10 : vvix_proxy < 1.0 ? 10 : 0
sentiment_score = base_sentiment + vix_adjustment + term_structure_adjustment + vvix_adjustment
sentiment_score := math.max(0, math.min(100, sentiment_score))
// MACRO ANALYSIS
// Yield Curve
yield_spread_2_10 = us10y - us2y
yield_spread_3m_10 = us10y - us3m
// Credit Conditions
hyg_return = ta.roc(hyg, 20)
lqd_return = ta.roc(lqd, 20)
tlt_return = ta.roc(tlt, 20)
hyg_duration = 4.0
lqd_duration = 8.0
tlt_duration = 17.0
hyg_log_returns = math.log(hyg / hyg )
lqd_log_returns = math.log(lqd / lqd )
hyg_volatility = ta.stdev(hyg_log_returns, 20) * math.sqrt(252)
lqd_volatility = ta.stdev(lqd_log_returns, 20) * math.sqrt(252)
hyg_yield_proxy = -math.log(hyg / hyg ) * 100
lqd_yield_proxy = -math.log(lqd / lqd ) * 100
tlt_yield = us10y
hyg_spread = (hyg_yield_proxy - tlt_yield) * 100
lqd_spread = (lqd_yield_proxy - tlt_yield) * 100
hyg_distance = (hyg - ta.lowest(hyg, 252)) / (ta.highest(hyg, 252) - ta.lowest(hyg, 252))
lqd_distance = (lqd - ta.lowest(lqd, 252)) / (ta.highest(lqd, 252) - ta.lowest(lqd, 252))
default_risk_proxy = 2.0 - (hyg_distance + lqd_distance)
credit_spread = hyg_spread * 0.5 + (hyg_volatility - lqd_volatility) * 1000 * 0.3 + default_risk_proxy * 200 * 0.2
credit_spread := math.max(50, credit_spread)
credit_market_health = hyg_return > lqd_return ? 1 : -1
flight_to_quality = tlt_return > (hyg_return + lqd_return) / 2
// Macro Score
macro_score = 50.0
yield_curve_score = 0
if yield_spread_2_10 > 1.5 and yield_spread_3m_10 > 2
yield_curve_score := 40
yield_curve_score
else if yield_spread_2_10 > 0.5 and yield_spread_3m_10 > 1
yield_curve_score := 30
yield_curve_score
else if yield_spread_2_10 > 0 and yield_spread_3m_10 > 0
yield_curve_score := 20
yield_curve_score
else if yield_spread_2_10 < 0 or yield_spread_3m_10 < 0
yield_curve_score := 10
yield_curve_score
else
yield_curve_score := 5
yield_curve_score
credit_conditions_score = 0
if credit_spread < 200 and not flight_to_quality
credit_conditions_score := 30
credit_conditions_score
else if credit_spread < 400 and credit_market_health > 0
credit_conditions_score := 20
credit_conditions_score
else if credit_spread < 600
credit_conditions_score := 15
credit_conditions_score
else if credit_spread < 1000
credit_conditions_score := 10
credit_conditions_score
else
credit_conditions_score := 0
credit_conditions_score
financial_stability_score = 0
if spy_debt_to_equity < 0.5 and spy_return_on_equity > 15
financial_stability_score := 20
financial_stability_score
else if spy_debt_to_equity < 1.0 and spy_return_on_equity > 10
financial_stability_score := 15
financial_stability_score
else if spy_debt_to_equity < 1.5
financial_stability_score := 10
financial_stability_score
else
financial_stability_score := 5
financial_stability_score
macro_score := yield_curve_score + credit_conditions_score + financial_stability_score
macro_score := math.max(0, math.min(100, macro_score))
// CRISIS DETECTION
crisis_indicators = 0
if vix > crisis_vix_threshold
crisis_indicators := crisis_indicators + 1
crisis_indicators
if vix > 60
crisis_indicators := crisis_indicators + 2
crisis_indicators
if current_drawdown > crisis_drawdown_threshold
crisis_indicators := crisis_indicators + 1
crisis_indicators
if current_drawdown > 25
crisis_indicators := crisis_indicators + 1
crisis_indicators
if credit_spread > crisis_credit_spread
crisis_indicators := crisis_indicators + 1
crisis_indicators
sp500_roc_5 = ta.roc(sp500, 5)
tlt_roc_5 = ta.roc(tlt, 5)
if sp500_roc_5 < -10 and tlt_roc_5 < -5
crisis_indicators := crisis_indicators + 2
crisis_indicators
volume_spike = sp500_volume > ta.sma(sp500_volume, 20) * 2
sp500_roc_1 = ta.roc(sp500, 1)
if volume_spike and sp500_roc_1 < -3
crisis_indicators := crisis_indicators + 1
crisis_indicators
is_crisis = crisis_indicators >= 3
is_severe_crisis = crisis_indicators >= 5
// FINAL ALLOCATION CALCULATION
// Convert regime to base allocation
regime_allocation = market_regime == 'Strong Bull' ? 100 : market_regime == 'Bull Market' ? 80 : market_regime == 'Neutral' ? 60 : market_regime == 'Correction' ? 40 : market_regime == 'Bear Market' ? 20 : 0
// Normalize weights
total_weight = w_regime + w_risk + w_valuation + w_sentiment + w_macro
w_regime_norm = w_regime / total_weight
w_risk_norm = w_risk / total_weight
w_valuation_norm = w_valuation / total_weight
w_sentiment_norm = w_sentiment / total_weight
w_macro_norm = w_macro / total_weight
// Calculate Weighted Allocation
weighted_allocation = regime_allocation * w_regime_norm + risk_allocation * w_risk_norm + valuation_score * w_valuation_norm + sentiment_score * w_sentiment_norm + macro_score * w_macro_norm
// Apply Crisis Override
if use_crisis_detection
if is_severe_crisis
weighted_allocation := math.min(weighted_allocation, 10)
weighted_allocation
else if is_crisis
weighted_allocation := math.min(weighted_allocation, 25)
weighted_allocation
// Model Type Adjustment
model_adjustment = 0.0
if model_type == 'Conservative'
model_adjustment := -10
model_adjustment
else if model_type == 'Aggressive'
model_adjustment := 10
model_adjustment
else if model_type == 'Adaptive'
recent_return = (sp500 - sp500 ) / sp500 * 100
if recent_return > 5
model_adjustment := 5
model_adjustment
else if recent_return < -5
model_adjustment := -5
model_adjustment
// Apply adjustment and bounds
final_allocation = weighted_allocation + model_adjustment
final_allocation := math.max(0, math.min(100, final_allocation))
// Smooth allocation
smoothed_allocation = ta.sma(final_allocation, smoothing_period)
// Calculate portfolio risk metrics (only for internal alerts)
actual_portfolio_volatility = smoothed_allocation / 100 * market_volatility_20d
actual_portfolio_drawdown = smoothed_allocation / 100 * current_drawdown
// VISUALIZATION
// Color definitions
var color primary_color = #2196F3
var color bullish_color = #4CAF50
var color bearish_color = #FF5252
var color neutral_color = #808080
var color text_color = color.white
var color bg_color = #000000
var color table_bg_color = #1E1E1E
var color header_bg_color = #2D2D2D
switch color_scheme // Apply color scheme
'Gold' =>
primary_color := use_dark_mode ? #FFD700 : #DAA520
bullish_color := use_dark_mode ? #FFA500 : #FF8C00
bearish_color := use_dark_mode ? #FF5252 : #D32F2F
neutral_color := use_dark_mode ? #C0C0C0 : #808080
text_color := use_dark_mode ? color.white : color.black
bg_color := use_dark_mode ? #000000 : #FFFFFF
table_bg_color := use_dark_mode ? #1A1A00 : #FFFEF0
header_bg_color := use_dark_mode ? #2D2600 : #F5F5DC
header_bg_color
'EdgeTools' =>
primary_color := use_dark_mode ? #4682B4 : #1E90FF
bullish_color := use_dark_mode ? #4CAF50 : #388E3C
bearish_color := use_dark_mode ? #FF5252 : #D32F2F
neutral_color := use_dark_mode ? #708090 : #696969
text_color := use_dark_mode ? color.white : color.black
bg_color := use_dark_mode ? #000000 : #FFFFFF
table_bg_color := use_dark_mode ? #0F1419 : #F0F8FF
header_bg_color := use_dark_mode ? #1E2A3A : #E6F3FF
header_bg_color
'Behavioral' =>
primary_color := #808080
bullish_color := #00FF00
bearish_color := #8B0000
neutral_color := #FFBF00
text_color := use_dark_mode ? color.white : color.black
bg_color := use_dark_mode ? #000000 : #FFFFFF
table_bg_color := use_dark_mode ? #1A1A1A : #F8F8F8
header_bg_color := use_dark_mode ? #2D2D2D : #E8E8E8
header_bg_color
'Quant' =>
primary_color := #808080
bullish_color := #FFA500
bearish_color := #8B0000
neutral_color := #4682B4
text_color := use_dark_mode ? color.white : color.black
bg_color := use_dark_mode ? #000000 : #FFFFFF
table_bg_color := use_dark_mode ? #0D0D0D : #FAFAFA
header_bg_color := use_dark_mode ? #1A1A1A : #F0F0F0
header_bg_color
'Ocean' =>
primary_color := use_dark_mode ? #20B2AA : #008B8B
bullish_color := use_dark_mode ? #00CED1 : #4682B4
bearish_color := use_dark_mode ? #FF4500 : #B22222
neutral_color := use_dark_mode ? #87CEEB : #2F4F4F
text_color := use_dark_mode ? #F0F8FF : #191970
bg_color := use_dark_mode ? #001F3F : #F0F8FF
table_bg_color := use_dark_mode ? #001A2E : #E6F7FF
header_bg_color := use_dark_mode ? #002A47 : #CCF2FF
header_bg_color
'Fire' =>
primary_color := use_dark_mode ? #FF6347 : #DC143C
bullish_color := use_dark_mode ? #FFD700 : #FF8C00
bearish_color := use_dark_mode ? #8B0000 : #800000
neutral_color := use_dark_mode ? #FFA500 : #CD853F
text_color := use_dark_mode ? #FFFAF0 : #2F1B14
bg_color := use_dark_mode ? #2F1B14 : #FFFAF0
table_bg_color := use_dark_mode ? #261611 : #FFF8F0
header_bg_color := use_dark_mode ? #3D241A : #FFE4CC
header_bg_color
'Matrix' =>
primary_color := use_dark_mode ? #00FF41 : #006400
bullish_color := use_dark_mode ? #39FF14 : #228B22
bearish_color := use_dark_mode ? #FF073A : #8B0000
neutral_color := use_dark_mode ? #00FFFF : #008B8B
text_color := use_dark_mode ? #C0FF8C : #003300
bg_color := use_dark_mode ? #0D1B0D : #F0FFF0
table_bg_color := use_dark_mode ? #0A1A0A : #E8FFF0
header_bg_color := use_dark_mode ? #112B11 : #CCFFCC
header_bg_color
'Arctic' =>
primary_color := use_dark_mode ? #87CEFA : #4169E1
bullish_color := use_dark_mode ? #00BFFF : #0000CD
bearish_color := use_dark_mode ? #FF1493 : #8B008B
neutral_color := use_dark_mode ? #B0E0E6 : #483D8B
text_color := use_dark_mode ? #F8F8FF : #191970
bg_color := use_dark_mode ? #191970 : #F8F8FF
table_bg_color := use_dark_mode ? #141B47 : #F0F8FF
header_bg_color := use_dark_mode ? #1E2A5C : #E0F0FF
header_bg_color
// Transparency settings
bg_transparency = use_dark_mode ? 85 : 92
zone_transparency = use_dark_mode ? 90 : 95
band_transparency = use_dark_mode ? 70 : 85
table_transparency = use_dark_mode ? 80 : 15
// Allocation color
alloc_color = smoothed_allocation >= 80 ? bullish_color : smoothed_allocation >= 60 ? color.new(bullish_color, 30) : smoothed_allocation >= 40 ? primary_color : smoothed_allocation >= 20 ? color.new(bearish_color, 30) : bearish_color
// Dynamic background
var color dynamic_bg_color = na
if show_regime_background
if smoothed_allocation >= 70
dynamic_bg_color := color.new(bullish_color, background_intensity)
dynamic_bg_color
else if smoothed_allocation <= 30
dynamic_bg_color := color.new(bearish_color, background_intensity)
dynamic_bg_color
else if smoothed_allocation > 60 or smoothed_allocation < 40
dynamic_bg_color := color.new(primary_color, math.min(99, background_intensity + 2))
dynamic_bg_color
bgcolor(dynamic_bg_color, title = 'Allocation Signal Background')
// Plot main allocation line
plot(smoothed_allocation, 'Equity Allocation %', color = alloc_color, linewidth = math.max(1, main_line_width))
// Reference lines (static colors for hline)
hline_bullish_color = color_scheme == 'Gold' ? use_dark_mode ? #FFA500 : #FF8C00 : color_scheme == 'EdgeTools' ? use_dark_mode ? #4CAF50 : #388E3C : color_scheme == 'Behavioral' ? #00FF00 : color_scheme == 'Quant' ? #FFA500 : color_scheme == 'Ocean' ? use_dark_mode ? #00CED1 : #4682B4 : color_scheme == 'Fire' ? use_dark_mode ? #FFD700 : #FF8C00 : color_scheme == 'Matrix' ? use_dark_mode ? #39FF14 : #228B22 : color_scheme == 'Arctic' ? use_dark_mode ? #00BFFF : #0000CD : #4CAF50
hline_bearish_color = color_scheme == 'Gold' ? use_dark_mode ? #FF5252 : #D32F2F : color_scheme == 'EdgeTools' ? use_dark_mode ? #FF5252 : #D32F2F : color_scheme == 'Behavioral' ? #8B0000 : color_scheme == 'Quant' ? #8B0000 : color_scheme == 'Ocean' ? use_dark_mode ? #FF4500 : #B22222 : color_scheme == 'Fire' ? use_dark_mode ? #8B0000 : #800000 : color_scheme == 'Matrix' ? use_dark_mode ? #FF073A : #8B0000 : color_scheme == 'Arctic' ? use_dark_mode ? #FF1493 : #8B008B : #FF5252
hline_primary_color = color_scheme == 'Gold' ? use_dark_mode ? #FFD700 : #DAA520 : color_scheme == 'EdgeTools' ? use_dark_mode ? #4682B4 : #1E90FF : color_scheme == 'Behavioral' ? #808080 : color_scheme == 'Quant' ? #808080 : color_scheme == 'Ocean' ? use_dark_mode ? #20B2AA : #008B8B : color_scheme == 'Fire' ? use_dark_mode ? #FF6347 : #DC143C : color_scheme == 'Matrix' ? use_dark_mode ? #00FF41 : #006400 : color_scheme == 'Arctic' ? use_dark_mode ? #87CEFA : #4169E1 : #2196F3
hline(show_reference_lines ? 100 : na, '100% Equity', color = color.new(hline_bullish_color, 70), linestyle = hline.style_dotted, linewidth = 1)
hline(show_reference_lines ? 80 : na, '80% Equity', color = color.new(hline_bullish_color, 40), linestyle = hline.style_dashed, linewidth = 1)
hline(show_reference_lines ? 60 : na, '60% Equity', color = color.new(hline_bullish_color, 60), linestyle = hline.style_dotted, linewidth = 1)
hline(50, '50% Balanced', color = color.new(hline_primary_color, 50), linestyle = hline.style_solid, linewidth = 2)
hline(show_reference_lines ? 40 : na, '40% Equity', color = color.new(hline_bearish_color, 60), linestyle = hline.style_dotted, linewidth = 1)
hline(show_reference_lines ? 20 : na, '20% Equity', color = color.new(hline_bearish_color, 40), linestyle = hline.style_dashed, linewidth = 1)
hline(show_reference_lines ? 0 : na, '0% Equity', color = color.new(hline_bearish_color, 70), linestyle = hline.style_dotted, linewidth = 1)
// Component plots
plot(show_components ? regime_allocation : na, 'Regime', color = color.new(#4ECDC4, 70), linewidth = 1)
plot(show_components ? risk_allocation : na, 'Risk', color = color.new(#FF6B6B, 70), linewidth = 1)
plot(show_components ? valuation_score : na, 'Valuation', color = color.new(#45B7D1, 70), linewidth = 1)
plot(show_components ? sentiment_score : na, 'Sentiment', color = color.new(#FFD93D, 70), linewidth = 1)
plot(show_components ? macro_score : na, 'Macro', color = color.new(#6BCF7F, 70), linewidth = 1)
// Confidence bands
upper_band = plot(show_confidence_bands ? math.min(100, smoothed_allocation + ta.stdev(smoothed_allocation, 20)) : na, color = color.new(neutral_color, band_transparency), display = display.none, title = 'Upper Band')
lower_band = plot(show_confidence_bands ? math.max(0, smoothed_allocation - ta.stdev(smoothed_allocation, 20)) : na, color = color.new(neutral_color, band_transparency), display = display.none, title = 'Lower Band')
fill(upper_band, lower_band, color = show_confidence_bands ? color.new(neutral_color, zone_transparency) : na, title = 'Uncertainty')
// DASHBOARD
if show_dashboard and barstate.islast
var table dashboard = table.new(position.top_right, 2, 20, border_width = 1, bgcolor = color.new(table_bg_color, table_transparency))
table.clear(dashboard, 0, 0, 1, 19)
// Header
header_color = color.new(header_bg_color, 20)
dashboard_text_color = text_color
table.cell(dashboard, 0, 0, 'DEAM', text_color = dashboard_text_color, bgcolor = header_color, text_size = size.normal)
table.cell(dashboard, 1, 0, model_type, text_color = dashboard_text_color, bgcolor = header_color, text_size = size.normal)
// Core metrics
table.cell(dashboard, 0, 1, 'Equity Allocation', text_color = dashboard_text_color, text_size = size.small)
table.cell(dashboard, 1, 1, str.tostring(smoothed_allocation, '##.#') + '%', text_color = alloc_color, text_size = size.small)
table.cell(dashboard, 0, 2, 'Cash Allocation', text_color = dashboard_text_color, text_size = size.small)
cash_color = 100 - smoothed_allocation > 70 ? bearish_color : primary_color
table.cell(dashboard, 1, 2, str.tostring(100 - smoothed_allocation, '##.#') + '%', text_color = cash_color, text_size = size.small)
// Signal
signal_text = 'NEUTRAL'
signal_color = primary_color
if smoothed_allocation >= 70
signal_text := 'BULLISH'
signal_color := bullish_color
signal_color
else if smoothed_allocation <= 30
signal_text := 'BEARISH'
signal_color := bearish_color
signal_color
table.cell(dashboard, 0, 3, 'Signal', text_color = dashboard_text_color, text_size = size.small)
table.cell(dashboard, 1, 3, signal_text, text_color = signal_color, text_size = size.small)
// Market Regime
table.cell(dashboard, 0, 4, 'Regime', text_color = dashboard_text_color, text_size = size.small)
regime_color_display = market_regime == 'Strong Bull' or market_regime == 'Bull Market' ? bullish_color : market_regime == 'Neutral' ? primary_color : market_regime == 'Crisis' ? bearish_color : bearish_color
table.cell(dashboard, 1, 4, market_regime, text_color = regime_color_display, text_size = size.small)
// VIX
table.cell(dashboard, 0, 5, 'VIX Level', text_color = dashboard_text_color, text_size = size.small)
vix_color_display = vix < 20 ? bullish_color : vix < 30 ? primary_color : bearish_color
table.cell(dashboard, 1, 5, str.tostring(vix, '##.##'), text_color = vix_color_display, text_size = size.small)
// Market Drawdown
table.cell(dashboard, 0, 6, 'Market DD', text_color = dashboard_text_color, text_size = size.small)
market_dd_color = current_drawdown < 5 ? bullish_color : current_drawdown < 10 ? primary_color : bearish_color
table.cell(dashboard, 1, 6, '-' + str.tostring(current_drawdown, '##.#') + '%', text_color = market_dd_color, text_size = size.small)
// Crisis Detection
table.cell(dashboard, 0, 7, 'Crisis Detection', text_color = dashboard_text_color, text_size = size.small)
crisis_text = is_severe_crisis ? 'SEVERE' : is_crisis ? 'CRISIS' : 'Normal'
crisis_display_color = is_severe_crisis or is_crisis ? bearish_color : bullish_color
table.cell(dashboard, 1, 7, crisis_text, text_color = crisis_display_color, text_size = size.small)
// Real Data Section
financial_bg = color.new(primary_color, 85)
table.cell(dashboard, 0, 8, 'REAL DATA', text_color = dashboard_text_color, bgcolor = financial_bg, text_size = size.small)
table.cell(dashboard, 1, 8, 'Live Metrics', text_color = dashboard_text_color, bgcolor = financial_bg, text_size = size.small)
// P/E Ratio
table.cell(dashboard, 0, 9, 'P/E Ratio', text_color = dashboard_text_color, text_size = size.small)
pe_color = actual_pe_ratio < 18 ? bullish_color : actual_pe_ratio < 25 ? primary_color : bearish_color
table.cell(dashboard, 1, 9, str.tostring(actual_pe_ratio, '##.#'), text_color = pe_color, text_size = size.small)
// ERP
table.cell(dashboard, 0, 10, 'ERP', text_color = dashboard_text_color, text_size = size.small)
erp_color = equity_risk_premium > 2 ? bullish_color : equity_risk_premium > 0 ? primary_color : bearish_color
table.cell(dashboard, 1, 10, str.tostring(equity_risk_premium, '##.##') + '%', text_color = erp_color, text_size = size.small)
// ROE
table.cell(dashboard, 0, 11, 'ROE', text_color = dashboard_text_color, text_size = size.small)
roe_color = spy_return_on_equity > 20 ? bullish_color : spy_return_on_equity > 10 ? primary_color : bearish_color
table.cell(dashboard, 1, 11, str.tostring(spy_return_on_equity, '##.#') + '%', text_color = roe_color, text_size = size.small)
// D/E Ratio
table.cell(dashboard, 0, 12, 'D/E Ratio', text_color = dashboard_text_color, text_size = size.small)
de_color = spy_debt_to_equity < 0.5 ? bullish_color : spy_debt_to_equity < 1.0 ? primary_color : bearish_color
table.cell(dashboard, 1, 12, str.tostring(spy_debt_to_equity, '##.##'), text_color = de_color, text_size = size.small)
// Shareholder Yield
table.cell(dashboard, 0, 13, 'Dividend+Buyback', text_color = dashboard_text_color, text_size = size.small)
yield_color = total_shareholder_yield > 4 ? bullish_color : total_shareholder_yield > 2 ? primary_color : bearish_color
table.cell(dashboard, 1, 13, str.tostring(total_shareholder_yield, '##.#') + '%', text_color = yield_color, text_size = size.small)
// Component Scores
component_bg = color.new(neutral_color, 80)
table.cell(dashboard, 0, 14, 'Components', text_color = dashboard_text_color, bgcolor = component_bg, text_size = size.small)
table.cell(dashboard, 1, 14, 'Scores', text_color = dashboard_text_color, bgcolor = component_bg, text_size = size.small)
table.cell(dashboard, 0, 15, 'Regime', text_color = dashboard_text_color, text_size = size.small)
regime_score_color = regime_allocation > 60 ? bullish_color : regime_allocation < 40 ? bearish_color : primary_color
table.cell(dashboard, 1, 15, str.tostring(regime_allocation, '##'), text_color = regime_score_color, text_size = size.small)
table.cell(dashboard, 0, 16, 'Risk', text_color = dashboard_text_color, text_size = size.small)
risk_score_color = risk_allocation > 60 ? bullish_color : risk_allocation < 40 ? bearish_color : primary_color
table.cell(dashboard, 1, 16, str.tostring(risk_allocation, '##'), text_color = risk_score_color, text_size = size.small)
table.cell(dashboard, 0, 17, 'Valuation', text_color = dashboard_text_color, text_size = size.small)
val_score_color = valuation_score > 60 ? bullish_color : valuation_score < 40 ? bearish_color : primary_color
table.cell(dashboard, 1, 17, str.tostring(valuation_score, '##'), text_color = val_score_color, text_size = size.small)
table.cell(dashboard, 0, 18, 'Sentiment', text_color = dashboard_text_color, text_size = size.small)
sent_score_color = sentiment_score > 60 ? bullish_color : sentiment_score < 40 ? bearish_color : primary_color
table.cell(dashboard, 1, 18, str.tostring(sentiment_score, '##'), text_color = sent_score_color, text_size = size.small)
table.cell(dashboard, 0, 19, 'Macro', text_color = dashboard_text_color, text_size = size.small)
macro_score_color = macro_score > 60 ? bullish_color : macro_score < 40 ? bearish_color : primary_color
table.cell(dashboard, 1, 19, str.tostring(macro_score, '##'), text_color = macro_score_color, text_size = size.small)
// ALERTS
// Major allocation changes
alertcondition(smoothed_allocation >= 80 and smoothed_allocation < 80, 'High Equity Allocation', 'Equity allocation reached 80% - Bull market conditions')
alertcondition(smoothed_allocation <= 20 and smoothed_allocation > 20, 'Low Equity Allocation', 'Equity allocation dropped to 20% - Defensive positioning')
// Crisis alerts
alertcondition(is_crisis and not is_crisis , 'CRISIS DETECTED', 'Crisis conditions detected - Reducing equity allocation')
alertcondition(is_severe_crisis and not is_severe_crisis , 'SEVERE CRISIS', 'Severe crisis detected - Maximum defensive positioning')
// Regime changes
regime_changed = market_regime != market_regime
alertcondition(regime_changed, 'Regime Change', 'Market regime has changed')
// Risk management alerts
risk_breach = enable_portfolio_risk_scaling and (actual_portfolio_volatility > target_portfolio_volatility * 1.2 or actual_portfolio_drawdown > max_portfolio_drawdown * 1.2)
alertcondition(risk_breach, 'Risk Breach', 'Portfolio risk exceeds target parameters')
// USAGE
// The indicator displays a recommended equity allocation percentage (0-100%).
// Example: 75% allocation = 75% stocks, 25% cash/bonds.
//
// The model combines market regime analysis (trend, volatility, drawdowns),
// risk management (portfolio-level targeting), valuation metrics (P/E, ERP),
// sentiment indicators (VIX term structure), and macro factors (yield curve,
// credit spreads) into a single allocation signal.
//
// Crisis detection automatically reduces exposure when multiple warning signals
// converge. Alerts available for major allocation shifts and regime changes.
//
// Designed for SPY/S&P 500 portfolio allocation. Adjust component weights and
// risk parameters in settings to match your risk tolerance.
View in Pine
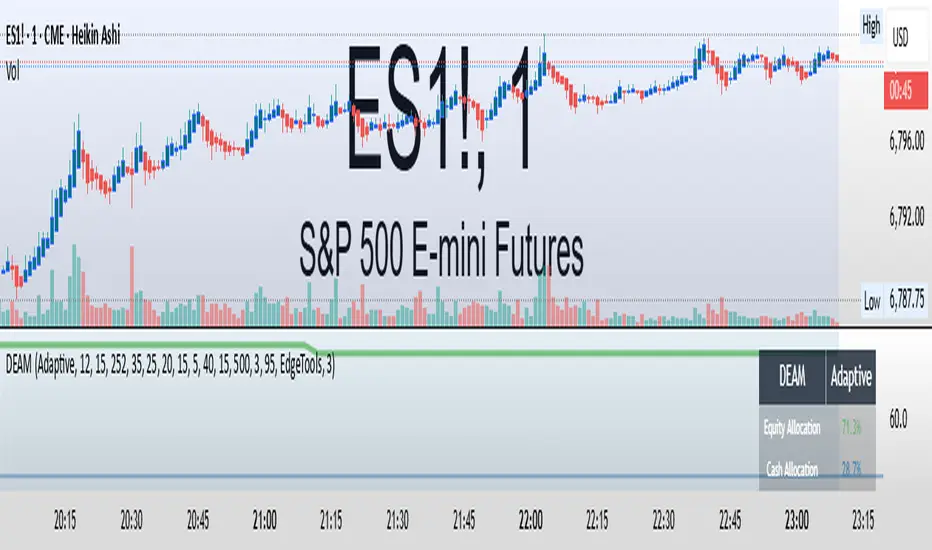
Naveen Prabhu with EMA//@version=6
indicator('Naveen Prabhu with EMA', overlay = true, max_labels_count = 500, max_lines_count = 500, max_boxes_count = 500)
a = input(2, title = 'Key Vaule. \'This changes the sensitivity\'')
c = input(5, title = 'ATR Period')
h = input(false, title = 'Signals from Heikin Ashi Candles')
BULLISH_LEG = 1
BEARISH_LEG = 0
BULLISH = +1
BEARISH = -1
GREEN = #089981
RED = #F23645
BLUE = #2157f3
GRAY = #878b94
MONO_BULLISH = #b2b5be
MONO_BEARISH = #5d606b
HISTORICAL = 'Historical'
PRESENT = 'Present'
COLORED = 'Colored'
MONOCHROME = 'Monochrome'
ALL = 'All'
BOS = 'BOS'
CHOCH = 'CHoCH'
TINY = size.tiny
SMALL = size.small
NORMAL = size.normal
ATR = 'Atr'
RANGE = 'Cumulative Mean Range'
CLOSE = 'Close'
HIGHLOW = 'High/Low'
SOLID = '⎯⎯⎯'
DASHED = '----'
DOTTED = '····'
SMART_GROUP = 'Smart Money Concepts'
INTERNAL_GROUP = 'Real Time Internal Structure'
SWING_GROUP = 'Real Time Swing Structure'
BLOCKS_GROUP = 'Order Blocks'
EQUAL_GROUP = 'EQH/EQL'
GAPS_GROUP = 'Fair Value Gaps'
LEVELS_GROUP = 'Highs & Lows MTF'
ZONES_GROUP = 'Premium & Discount Zones'
modeTooltip = 'Allows to display historical Structure or only the recent ones'
styleTooltip = 'Indicator color theme'
showTrendTooltip = 'Display additional candles with a color reflecting the current trend detected by structure'
showInternalsTooltip = 'Display internal market structure'
internalFilterConfluenceTooltip = 'Filter non significant internal structure breakouts'
showStructureTooltip = 'Display swing market Structure'
showSwingsTooltip = 'Display swing point as labels on the chart'
showHighLowSwingsTooltip = 'Highlight most recent strong and weak high/low points on the chart'
showInternalOrderBlocksTooltip = 'Display internal order blocks on the chart\n\nNumber of internal order blocks to display on the chart'
showSwingOrderBlocksTooltip = 'Display swing order blocks on the chart\n\nNumber of internal swing blocks to display on the chart'
orderBlockFilterTooltip = 'Method used to filter out volatile order blocks \n\nIt is recommended to use the cumulative mean range method when a low amount of data is available'
orderBlockMitigationTooltip = 'Select what values to use for order block mitigation'
showEqualHighsLowsTooltip = 'Display equal highs and equal lows on the chart'
equalHighsLowsLengthTooltip = 'Number of bars used to confirm equal highs and equal lows'
equalHighsLowsThresholdTooltip = 'Sensitivity threshold in a range (0, 1) used for the detection of equal highs & lows\n\nLower values will return fewer but more pertinent results'
showFairValueGapsTooltip = 'Display fair values gaps on the chart'
fairValueGapsThresholdTooltip = 'Filter out non significant fair value gaps'
fairValueGapsTimeframeTooltip = 'Fair value gaps timeframe'
fairValueGapsExtendTooltip = 'Determine how many bars to extend the Fair Value Gap boxes on chart'
showPremiumDiscountZonesTooltip = 'Display premium, discount, and equilibrium zones on chart'
modeInput = input.string( HISTORICAL, 'Mode', group = SMART_GROUP, tooltip = modeTooltip, options = )
styleInput = input.string( COLORED, 'Style', group = SMART_GROUP, tooltip = styleTooltip,options = )
showTrendInput = input( false, 'Color Candles', group = SMART_GROUP, tooltip = showTrendTooltip)
showInternalsInput = input( false, 'Show Internal Structure', group = INTERNAL_GROUP, tooltip = showInternalsTooltip)
showInternalBullInput = input.string( ALL, 'Bullish Structure', group = INTERNAL_GROUP, inline = 'ibull', options = )
internalBullColorInput = input( GREEN, '', group = INTERNAL_GROUP, inline = 'ibull')
showInternalBearInput = input.string( ALL, 'Bearish Structure' , group = INTERNAL_GROUP, inline = 'ibear', options = )
internalBearColorInput = input( RED, '', group = INTERNAL_GROUP, inline = 'ibear')
internalFilterConfluenceInput = input( false, 'Confluence Filter', group = INTERNAL_GROUP, tooltip = internalFilterConfluenceTooltip)
internalStructureSize = input.string( TINY, 'Internal Label Size', group = INTERNAL_GROUP, options = )
showStructureInput = input( false, 'Show Swing Structure', group = SWING_GROUP, tooltip = showStructureTooltip)
showSwingBullInput = input.string( ALL, 'Bullish Structure', group = SWING_GROUP, inline = 'bull', options = )
swingBullColorInput = input( GREEN, '', group = SWING_GROUP, inline = 'bull')
showSwingBearInput = input.string( ALL, 'Bearish Structure', group = SWING_GROUP, inline = 'bear', options = )
swingBearColorInput = input( RED, '', group = SWING_GROUP, inline = 'bear')
swingStructureSize = input.string( SMALL, 'Swing Label Size', group = SWING_GROUP, options = )
showSwingsInput = input( false, 'Show Swings Points', group = SWING_GROUP, tooltip = showSwingsTooltip,inline = 'swings')
swingsLengthInput = input.int( 50, '', group = SWING_GROUP, minval = 10, inline = 'swings')
showHighLowSwingsInput = input( false, 'Show Strong/Weak High/Low',group = SWING_GROUP, tooltip = showHighLowSwingsTooltip)
showInternalOrderBlocksInput = input( true, 'Internal Order Blocks' , group = BLOCKS_GROUP, tooltip = showInternalOrderBlocksTooltip, inline = 'iob')
internalOrderBlocksSizeInput = input.int( 5, '', group = BLOCKS_GROUP, minval = 1, maxval = 20, inline = 'iob')
showSwingOrderBlocksInput = input( true, 'Swing Order Blocks', group = BLOCKS_GROUP, tooltip = showSwingOrderBlocksTooltip, inline = 'ob')
swingOrderBlocksSizeInput = input.int( 5, '', group = BLOCKS_GROUP, minval = 1, maxval = 20, inline = 'ob')
orderBlockFilterInput = input.string( 'Atr', 'Order Block Filter', group = BLOCKS_GROUP, tooltip = orderBlockFilterTooltip, options = )
orderBlockMitigationInput = input.string( HIGHLOW, 'Order Block Mitigation', group = BLOCKS_GROUP, tooltip = orderBlockMitigationTooltip, options = )
internalBullishOrderBlockColor = input.color(color.new(GREEN, 80), 'Internal Bullish OB', group = BLOCKS_GROUP)
internalBearishOrderBlockColor = input.color(color.new(#f77c80, 80), 'Internal Bearish OB', group = BLOCKS_GROUP)
swingBullishOrderBlockColor = input.color(color.new(GREEN, 80), 'Bullish OB', group = BLOCKS_GROUP)
swingBearishOrderBlockColor = input.color(color.new(#b22833, 80), 'Bearish OB', group = BLOCKS_GROUP)
showEqualHighsLowsInput = input( false, 'Equal High/Low', group = EQUAL_GROUP, tooltip = showEqualHighsLowsTooltip)
equalHighsLowsLengthInput = input.int( 3, 'Bars Confirmation', group = EQUAL_GROUP, tooltip = equalHighsLowsLengthTooltip, minval = 1)
equalHighsLowsThresholdInput = input.float( 0.1, 'Threshold', group = EQUAL_GROUP, tooltip = equalHighsLowsThresholdTooltip, minval = 0, maxval = 0.5, step = 0.1)
equalHighsLowsSizeInput = input.string( TINY, 'Label Size', group = EQUAL_GROUP, options = )
showFairValueGapsInput = input( false, 'Fair Value Gaps', group = GAPS_GROUP, tooltip = showFairValueGapsTooltip)
fairValueGapsThresholdInput = input( true, 'Auto Threshold', group = GAPS_GROUP, tooltip = fairValueGapsThresholdTooltip)
fairValueGapsTimeframeInput = input.timeframe('', 'Timeframe', group = GAPS_GROUP, tooltip = fairValueGapsTimeframeTooltip)
fairValueGapsBullColorInput = input.color(color.new(#00ff68, 70), 'Bullish FVG' , group = GAPS_GROUP)
fairValueGapsBearColorInput = input.color(color.new(#ff0008, 70), 'Bearish FVG' , group = GAPS_GROUP)
fairValueGapsExtendInput = input.int( 1, 'Extend FVG', group = GAPS_GROUP, tooltip = fairValueGapsExtendTooltip, minval = 0)
showDailyLevelsInput = input( false, 'Daily', group = LEVELS_GROUP, inline = 'daily')
dailyLevelsStyleInput = input.string( SOLID, '', group = LEVELS_GROUP, inline = 'daily', options = )
dailyLevelsColorInput = input( BLUE, '', group = LEVELS_GROUP, inline = 'daily')
showWeeklyLevelsInput = input( false, 'Weekly', group = LEVELS_GROUP, inline = 'weekly')
weeklyLevelsStyleInput = input.string( SOLID, '', group = LEVELS_GROUP, inline = 'weekly', options = )
weeklyLevelsColorInput = input( BLUE, '', group = LEVELS_GROUP, inline = 'weekly')
showMonthlyLevelsInput = input( false, 'Monthly', group = LEVELS_GROUP, inline = 'monthly')
monthlyLevelsStyleInput = input.string( SOLID, '', group = LEVELS_GROUP, inline = 'monthly', options = )
monthlyLevelsColorInput = input( BLUE, '', group = LEVELS_GROUP, inline = 'monthly')
showPremiumDiscountZonesInput = input( false, 'Premium/Discount Zones', group = ZONES_GROUP , tooltip = showPremiumDiscountZonesTooltip)
premiumZoneColorInput = input.color( RED, 'Premium Zone', group = ZONES_GROUP)
equilibriumZoneColorInput = input.color( GRAY, 'Equilibrium Zone', group = ZONES_GROUP)
discountZoneColorInput = input.color( GREEN, 'Discount Zone', group = ZONES_GROUP)
type alerts
bool internalBullishBOS = false
bool internalBearishBOS = false
bool internalBullishCHoCH = false
bool internalBearishCHoCH = false
bool swingBullishBOS = false
bool swingBearishBOS = false
bool swingBullishCHoCH = false
bool swingBearishCHoCH = false
bool internalBullishOrderBlock = false
bool internalBearishOrderBlock = false
bool swingBullishOrderBlock = false
bool swingBearishOrderBlock = false
bool equalHighs = false
bool equalLows = false
bool bullishFairValueGap = false
bool bearishFairValueGap = false
type trailingExtremes
float top
float bottom
int barTime
int barIndex
int lastTopTime
int lastBottomTime
type fairValueGap
float top
float bottom
int bias
box topBox
box bottomBox
type trend
int bias
type equalDisplay
line l_ine = na
label l_abel = na
type pivot
float currentLevel
float lastLevel
bool crossed
int barTime = time
int barIndex = bar_index
type orderBlock
float barHigh
float barLow
int barTime
int bias
// @variable current swing pivot high
var pivot swingHigh = pivot.new(na,na,false)
// @variable current swing pivot low
var pivot swingLow = pivot.new(na,na,false)
// @variable current internal pivot high
var pivot internalHigh = pivot.new(na,na,false)
// @variable current internal pivot low
var pivot internalLow = pivot.new(na,na,false)
// @variable current equal high pivot
var pivot equalHigh = pivot.new(na,na,false)
// @variable current equal low pivot
var pivot equalLow = pivot.new(na,na,false)
// @variable swing trend bias
var trend swingTrend = trend.new(0)
// @variable internal trend bias
var trend internalTrend = trend.new(0)
// @variable equal high display
var equalDisplay equalHighDisplay = equalDisplay.new()
// @variable equal low display
var equalDisplay equalLowDisplay = equalDisplay.new()
// @variable storage for fairValueGap UDTs
var array fairValueGaps = array.new()
// @variable storage for parsed highs
var array parsedHighs = array.new()
// @variable storage for parsed lows
var array parsedLows = array.new()
// @variable storage for raw highs
var array highs = array.new()
// @variable storage for raw lows
var array lows = array.new()
// @variable storage for bar time values
var array times = array.new()
// @variable last trailing swing high and low
var trailingExtremes trailing = trailingExtremes.new()
// @variable storage for orderBlock UDTs (swing order blocks)
var array swingOrderBlocks = array.new()
// @variable storage for orderBlock UDTs (internal order blocks)
var array internalOrderBlocks = array.new()
// @variable storage for swing order blocks boxes
var array swingOrderBlocksBoxes = array.new()
// @variable storage for internal order blocks boxes
var array internalOrderBlocksBoxes = array.new()
// @variable color for swing bullish structures
var swingBullishColor = styleInput == MONOCHROME ? MONO_BULLISH : swingBullColorInput
// @variable color for swing bearish structures
var swingBearishColor = styleInput == MONOCHROME ? MONO_BEARISH : swingBearColorInput
// @variable color for bullish fair value gaps
var fairValueGapBullishColor = styleInput == MONOCHROME ? color.new(MONO_BULLISH,70) : fairValueGapsBullColorInput
// @variable color for bearish fair value gaps
var fairValueGapBearishColor = styleInput == MONOCHROME ? color.new(MONO_BEARISH,70) : fairValueGapsBearColorInput
// @variable color for premium zone
var premiumZoneColor = styleInput == MONOCHROME ? MONO_BEARISH : premiumZoneColorInput
// @variable color for discount zone
var discountZoneColor = styleInput == MONOCHROME ? MONO_BULLISH : discountZoneColorInput
// @variable bar index on current script iteration
varip int currentBarIndex = bar_index
// @variable bar index on last script iteration
varip int lastBarIndex = bar_index
// @variable alerts in current bar
alerts currentAlerts = alerts.new()
// @variable time at start of chart
var initialTime = time
// we create the needed boxes for displaying order blocks at the first execution
if barstate.isfirst
if showSwingOrderBlocksInput
for index = 1 to swingOrderBlocksSizeInput
swingOrderBlocksBoxes.push(box.new(na,na,na,na,xloc = xloc.bar_time,extend = extend.right))
if showInternalOrderBlocksInput
for index = 1 to internalOrderBlocksSizeInput
internalOrderBlocksBoxes.push(box.new(na,na,na,na,xloc = xloc.bar_time,extend = extend.right))
// @variable source to use in bearish order blocks mitigation
bearishOrderBlockMitigationSource = orderBlockMitigationInput == CLOSE ? close : high
// @variable source to use in bullish order blocks mitigation
bullishOrderBlockMitigationSource = orderBlockMitigationInput == CLOSE ? close : low
// @variable default volatility measure
atrMeasure = ta.atr(200)
// @variable parsed volatility measure by user settings
volatilityMeasure = orderBlockFilterInput == ATR ? atrMeasure : ta.cum(ta.tr)/bar_index
// @variable true if current bar is a high volatility bar
highVolatilityBar = (high - low) >= (2 * volatilityMeasure)
// @variable parsed high
parsedHigh = highVolatilityBar ? low : high
// @variable parsed low
parsedLow = highVolatilityBar ? high : low
// we store current values into the arrays at each bar
parsedHighs.push(parsedHigh)
parsedLows.push(parsedLow)
highs.push(high)
lows.push(low)
times.push(time)
leg(int size) =>
var leg = 0
newLegHigh = high > ta.highest( size)
newLegLow = low < ta.lowest( size)
if newLegHigh
leg := BEARISH_LEG
else if newLegLow
leg := BULLISH_LEG
leg
startOfNewLeg(int leg) => ta.change(leg) != 0
startOfBearishLeg(int leg) => ta.change(leg) == -1
startOfBullishLeg(int leg) => ta.change(leg) == +1
drawLabel(int labelTime, float labelPrice, string tag, color labelColor, string labelStyle) =>
var label l_abel = na
if modeInput == PRESENT
l_abel.delete()
l_abel := label.new(chart.point.new(labelTime,na,labelPrice),tag,xloc.bar_time,color=color(na),textcolor=labelColor,style = labelStyle,size = size.small)
drawEqualHighLow(pivot p_ivot, float level, int size, bool equalHigh) =>
equalDisplay e_qualDisplay = equalHigh ? equalHighDisplay : equalLowDisplay
string tag = 'EQL'
color equalColor = swingBullishColor
string labelStyle = label.style_label_up
if equalHigh
tag := 'EQH'
equalColor := swingBearishColor
labelStyle := label.style_label_down
if modeInput == PRESENT
line.delete( e_qualDisplay.l_ine)
label.delete( e_qualDisplay.l_abel)
e_qualDisplay.l_ine := line.new(chart.point.new(p_ivot.barTime,na,p_ivot.currentLevel), chart.point.new(time ,na,level), xloc = xloc.bar_time, color = equalColor, style = line.style_dotted)
labelPosition = math.round(0.5*(p_ivot.barIndex + bar_index - size))
e_qualDisplay.l_abel := label.new(chart.point.new(na,labelPosition,level), tag, xloc.bar_index, color = color(na), textcolor = equalColor, style = labelStyle, size = equalHighsLowsSizeInput)
getCurrentStructure(int size,bool equalHighLow = false, bool internal = false) =>
currentLeg = leg(size)
newPivot = startOfNewLeg(currentLeg)
pivotLow = startOfBullishLeg(currentLeg)
pivotHigh = startOfBearishLeg(currentLeg)
if newPivot
if pivotLow
pivot p_ivot = equalHighLow ? equalLow : internal ? internalLow : swingLow
if equalHighLow and math.abs(p_ivot.currentLevel - low ) < equalHighsLowsThresholdInput * atrMeasure
drawEqualHighLow(p_ivot, low , size, false)
p_ivot.lastLevel := p_ivot.currentLevel
p_ivot.currentLevel := low
p_ivot.crossed := false
p_ivot.barTime := time
p_ivot.barIndex := bar_index
if not equalHighLow and not internal
trailing.bottom := p_ivot.currentLevel
trailing.barTime := p_ivot.barTime
trailing.barIndex := p_ivot.barIndex
trailing.lastBottomTime := p_ivot.barTime
if showSwingsInput and not internal and not equalHighLow
drawLabel(time , p_ivot.currentLevel, p_ivot.currentLevel < p_ivot.lastLevel ? 'LL' : 'HL', swingBullishColor, label.style_label_up)
else
pivot p_ivot = equalHighLow ? equalHigh : internal ? internalHigh : swingHigh
if equalHighLow and math.abs(p_ivot.currentLevel - high ) < equalHighsLowsThresholdInput * atrMeasure
drawEqualHighLow(p_ivot,high ,size,true)
p_ivot.lastLevel := p_ivot.currentLevel
p_ivot.currentLevel := high
p_ivot.crossed := false
p_ivot.barTime := time
p_ivot.barIndex := bar_index
if not equalHighLow and not internal
trailing.top := p_ivot.currentLevel
trailing.barTime := p_ivot.barTime
trailing.barIndex := p_ivot.barIndex
trailing.lastTopTime := p_ivot.barTime
if showSwingsInput and not internal and not equalHighLow
drawLabel(time , p_ivot.currentLevel, p_ivot.currentLevel > p_ivot.lastLevel ? 'HH' : 'LH', swingBearishColor, label.style_label_down)
drawStructure(pivot p_ivot, string tag, color structureColor, string lineStyle, string labelStyle, string labelSize) =>
var line l_ine = line.new(na,na,na,na,xloc = xloc.bar_time)
var label l_abel = label.new(na,na)
if modeInput == PRESENT
l_ine.delete()
l_abel.delete()
l_ine := line.new(chart.point.new(p_ivot.barTime,na,p_ivot.currentLevel), chart.point.new(time,na,p_ivot.currentLevel), xloc.bar_time, color=structureColor, style=lineStyle)
l_abel := label.new(chart.point.new(na,math.round(0.5*(p_ivot.barIndex+bar_index)),p_ivot.currentLevel), tag, xloc.bar_index, color=color(na), textcolor=structureColor, style=labelStyle, size = labelSize)
deleteOrderBlocks(bool internal = false) =>
array orderBlocks = internal ? internalOrderBlocks : swingOrderBlocks
for in orderBlocks
bool crossedOderBlock = false
if bearishOrderBlockMitigationSource > eachOrderBlock.barHigh and eachOrderBlock.bias == BEARISH
crossedOderBlock := true
if internal
currentAlerts.internalBearishOrderBlock := true
else
currentAlerts.swingBearishOrderBlock := true
else if bullishOrderBlockMitigationSource < eachOrderBlock.barLow and eachOrderBlock.bias == BULLISH
crossedOderBlock := true
if internal
currentAlerts.internalBullishOrderBlock := true
else
currentAlerts.swingBullishOrderBlock := true
if crossedOderBlock
orderBlocks.remove(index)
storeOrdeBlock(pivot p_ivot,bool internal = false,int bias) =>
if (not internal and showSwingOrderBlocksInput) or (internal and showInternalOrderBlocksInput)
array a_rray = na
int parsedIndex = na
if bias == BEARISH
a_rray := parsedHighs.slice(p_ivot.barIndex,bar_index)
parsedIndex := p_ivot.barIndex + a_rray.indexof(a_rray.max())
else
a_rray := parsedLows.slice(p_ivot.barIndex,bar_index)
parsedIndex := p_ivot.barIndex + a_rray.indexof(a_rray.min())
orderBlock o_rderBlock = orderBlock.new(parsedHighs.get(parsedIndex), parsedLows.get(parsedIndex), times.get(parsedIndex),bias)
array orderBlocks = internal ? internalOrderBlocks : swingOrderBlocks
if orderBlocks.size() >= 100
orderBlocks.pop()
orderBlocks.unshift(o_rderBlock)
drawOrderBlocks(bool internal = false) =>
array orderBlocks = internal ? internalOrderBlocks : swingOrderBlocks
orderBlocksSize = orderBlocks.size()
if orderBlocksSize > 0
maxOrderBlocks = internal ? internalOrderBlocksSizeInput : swingOrderBlocksSizeInput
array parsedOrdeBlocks = orderBlocks.slice(0, math.min(maxOrderBlocks,orderBlocksSize))
array b_oxes = internal ? internalOrderBlocksBoxes : swingOrderBlocksBoxes
for in parsedOrdeBlocks
orderBlockColor = styleInput == MONOCHROME ? (eachOrderBlock.bias == BEARISH ? color.new(MONO_BEARISH,80) : color.new(MONO_BULLISH,80)) : internal ? (eachOrderBlock.bias == BEARISH ? internalBearishOrderBlockColor : internalBullishOrderBlockColor) : (eachOrderBlock.bias == BEARISH ? swingBearishOrderBlockColor : swingBullishOrderBlockColor)
box b_ox = b_oxes.get(index)
b_ox.set_top_left_point( chart.point.new(eachOrderBlock.barTime,na,eachOrderBlock.barHigh))
b_ox.set_bottom_right_point(chart.point.new(last_bar_time,na,eachOrderBlock.barLow))
b_ox.set_border_color( internal ? na : orderBlockColor)
b_ox.set_bgcolor( orderBlockColor)
displayStructure(bool internal = false) =>
var bullishBar = true
var bearishBar = true
if internalFilterConfluenceInput
bullishBar := high - math.max(close, open) > math.min(close, open - low)
bearishBar := high - math.max(close, open) < math.min(close, open - low)
pivot p_ivot = internal ? internalHigh : swingHigh
trend t_rend = internal ? internalTrend : swingTrend
lineStyle = internal ? line.style_dashed : line.style_solid
labelSize = internal ? internalStructureSize : swingStructureSize
extraCondition = internal ? internalHigh.currentLevel != swingHigh.currentLevel and bullishBar : true
bullishColor = styleInput == MONOCHROME ? MONO_BULLISH : internal ? internalBullColorInput : swingBullColorInput
if ta.crossover(close,p_ivot.currentLevel) and not p_ivot.crossed and extraCondition
string tag = t_rend.bias == BEARISH ? CHOCH : BOS
if internal
currentAlerts.internalBullishCHoCH := tag == CHOCH
currentAlerts.internalBullishBOS := tag == BOS
else
currentAlerts.swingBullishCHoCH := tag == CHOCH
currentAlerts.swingBullishBOS := tag == BOS
p_ivot.crossed := true
t_rend.bias := BULLISH
displayCondition = internal ? showInternalsInput and (showInternalBullInput == ALL or (showInternalBullInput == BOS and tag != CHOCH) or (showInternalBullInput == CHOCH and tag == CHOCH)) : showStructureInput and (showSwingBullInput == ALL or (showSwingBullInput == BOS and tag != CHOCH) or (showSwingBullInput == CHOCH and tag == CHOCH))
if displayCondition
drawStructure(p_ivot,tag,bullishColor,lineStyle,label.style_label_down,labelSize)
if (internal and showInternalOrderBlocksInput) or (not internal and showSwingOrderBlocksInput)
storeOrdeBlock(p_ivot,internal,BULLISH)
p_ivot := internal ? internalLow : swingLow
extraCondition := internal ? internalLow.currentLevel != swingLow.currentLevel and bearishBar : true
bearishColor = styleInput == MONOCHROME ? MONO_BEARISH : internal ? internalBearColorInput : swingBearColorInput
if ta.crossunder(close,p_ivot.currentLevel) and not p_ivot.crossed and extraCondition
string tag = t_rend.bias == BULLISH ? CHOCH : BOS
if internal
currentAlerts.internalBearishCHoCH := tag == CHOCH
currentAlerts.internalBearishBOS := tag == BOS
else
currentAlerts.swingBearishCHoCH := tag == CHOCH
currentAlerts.swingBearishBOS := tag == BOS
p_ivot.crossed := true
t_rend.bias := BEARISH
displayCondition = internal ? showInternalsInput and (showInternalBearInput == ALL or (showInternalBearInput == BOS and tag != CHOCH) or (showInternalBearInput == CHOCH and tag == CHOCH)) : showStructureInput and (showSwingBearInput == ALL or (showSwingBearInput == BOS and tag != CHOCH) or (showSwingBearInput == CHOCH and tag == CHOCH))
if displayCondition
drawStructure(p_ivot,tag,bearishColor,lineStyle,label.style_label_up,labelSize)
if (internal and showInternalOrderBlocksInput) or (not internal and showSwingOrderBlocksInput)
storeOrdeBlock(p_ivot,internal,BEARISH)
fairValueGapBox(leftTime,rightTime,topPrice,bottomPrice,boxColor) => box.new(chart.point.new(leftTime,na,topPrice),chart.point.new(rightTime + fairValueGapsExtendInput * (time-time ),na,bottomPrice), xloc=xloc.bar_time, border_color = boxColor, bgcolor = boxColor)
deleteFairValueGaps() =>
for in fairValueGaps
if (low < eachFairValueGap.bottom and eachFairValueGap.bias == BULLISH) or (high > eachFairValueGap.top and eachFairValueGap.bias == BEARISH)
eachFairValueGap.topBox.delete()
eachFairValueGap.bottomBox.delete()
fairValueGaps.remove(index)
// @function draw fair value gaps
// @returns fairValueGap ID
drawFairValueGaps() =>
= request.security(syminfo.tickerid, fairValueGapsTimeframeInput, [close , open , time , high , low , time , high , low ],lookahead = barmerge.lookahead_on)
barDeltaPercent = (lastClose - lastOpen) / (lastOpen * 100)
newTimeframe = timeframe.change(fairValueGapsTimeframeInput)
threshold = fairValueGapsThresholdInput ? ta.cum(math.abs(newTimeframe ? barDeltaPercent : 0)) / bar_index * 2 : 0
bullishFairValueGap = currentLow > last2High and lastClose > last2High and barDeltaPercent > threshold and newTimeframe
bearishFairValueGap = currentHigh < last2Low and lastClose < last2Low and -barDeltaPercent > threshold and newTimeframe
if bullishFairValueGap
currentAlerts.bullishFairValueGap := true
fairValueGaps.unshift(fairValueGap.new(currentLow,last2High,BULLISH,fairValueGapBox(lastTime,currentTime,currentLow,math.avg(currentLow,last2High),fairValueGapBullishColor),fairValueGapBox(lastTime,currentTime,math.avg(currentLow,last2High),last2High,fairValueGapBullishColor)))
if bearishFairValueGap
currentAlerts.bearishFairValueGap := true
fairValueGaps.unshift(fairValueGap.new(currentHigh,last2Low,BEARISH,fairValueGapBox(lastTime,currentTime,currentHigh,math.avg(currentHigh,last2Low),fairValueGapBearishColor),fairValueGapBox(lastTime,currentTime,math.avg(currentHigh,last2Low),last2Low,fairValueGapBearishColor)))
getStyle(string style) =>
switch style
SOLID => line.style_solid
DASHED => line.style_dashed
DOTTED => line.style_dotted
drawLevels(string timeframe, bool sameTimeframe, string style, color levelColor) =>
= request.security(syminfo.tickerid, timeframe, [high , low , time , time],lookahead = barmerge.lookahead_on)
float parsedTop = sameTimeframe ? high : topLevel
float parsedBottom = sameTimeframe ? low : bottomLevel
int parsedLeftTime = sameTimeframe ? time : leftTime
int parsedRightTime = sameTimeframe ? time : rightTime
int parsedTopTime = time
int parsedBottomTime = time
if not sameTimeframe
int leftIndex = times.binary_search_rightmost(parsedLeftTime)
int rightIndex = times.binary_search_rightmost(parsedRightTime)
array timeArray = times.slice(leftIndex,rightIndex)
array topArray = highs.slice(leftIndex,rightIndex)
array bottomArray = lows.slice(leftIndex,rightIndex)
parsedTopTime := timeArray.size() > 0 ? timeArray.get(topArray.indexof(topArray.max())) : initialTime
parsedBottomTime := timeArray.size() > 0 ? timeArray.get(bottomArray.indexof(bottomArray.min())) : initialTime
var line topLine = line.new(na, na, na, na, xloc = xloc.bar_time, color = levelColor, style = getStyle(style))
var line bottomLine = line.new(na, na, na, na, xloc = xloc.bar_time, color = levelColor, style = getStyle(style))
var label topLabel = label.new(na, na, xloc = xloc.bar_time, text = str.format('P{0}H',timeframe), color=color(na), textcolor = levelColor, size = size.small, style = label.style_label_left)
var label bottomLabel = label.new(na, na, xloc = xloc.bar_time, text = str.format('P{0}L',timeframe), color=color(na), textcolor = levelColor, size = size.small, style = label.style_label_left)
topLine.set_first_point( chart.point.new(parsedTopTime,na,parsedTop))
topLine.set_second_point( chart.point.new(last_bar_time + 20 * (time-time ),na,parsedTop))
topLabel.set_point( chart.point.new(last_bar_time + 20 * (time-time ),na,parsedTop))
bottomLine.set_first_point( chart.point.new(parsedBottomTime,na,parsedBottom))
bottomLine.set_second_point(chart.point.new(last_bar_time + 20 * (time-time ),na,parsedBottom))
bottomLabel.set_point( chart.point.new(last_bar_time + 20 * (time-time ),na,parsedBottom))
higherTimeframe(string timeframe) => timeframe.in_seconds() > timeframe.in_seconds(timeframe)
updateTrailingExtremes() =>
trailing.top := math.max(high,trailing.top)
trailing.lastTopTime := trailing.top == high ? time : trailing.lastTopTime
trailing.bottom := math.min(low,trailing.bottom)
trailing.lastBottomTime := trailing.bottom == low ? time : trailing.lastBottomTime
drawHighLowSwings() =>
var line topLine = line.new(na, na, na, na, color = swingBearishColor, xloc = xloc.bar_time)
var line bottomLine = line.new(na, na, na, na, color = swingBullishColor, xloc = xloc.bar_time)
var label topLabel = label.new(na, na, color=color(na), textcolor = swingBearishColor, xloc = xloc.bar_time, style = label.style_label_down, size = size.tiny)
var label bottomLabel = label.new(na, na, color=color(na), textcolor = swingBullishColor, xloc = xloc.bar_time, style = label.style_label_up, size = size.tiny)
rightTimeBar = last_bar_time + 20 * (time - time )
topLine.set_first_point( chart.point.new(trailing.lastTopTime, na, trailing.top))
topLine.set_second_point( chart.point.new(rightTimeBar, na, trailing.top))
topLabel.set_point( chart.point.new(rightTimeBar, na, trailing.top))
topLabel.set_text( swingTrend.bias == BEARISH ? 'Strong High' : 'Weak High')
bottomLine.set_first_point( chart.point.new(trailing.lastBottomTime, na, trailing.bottom))
bottomLine.set_second_point(chart.point.new(rightTimeBar, na, trailing.bottom))
bottomLabel.set_point( chart.point.new(rightTimeBar, na, trailing.bottom))
bottomLabel.set_text( swingTrend.bias == BULLISH ? 'Strong Low' : 'Weak Low')
drawZone(float labelLevel, int labelIndex, float top, float bottom, string tag, color zoneColor, string style) =>
var label l_abel = label.new(na,na,text = tag, color=color(na),textcolor = zoneColor, style = style, size = size.small)
var box b_ox = box.new(na,na,na,na,bgcolor = color.new(zoneColor,80),border_color = color(na), xloc = xloc.bar_time)
b_ox.set_top_left_point( chart.point.new(trailing.barTime,na,top))
b_ox.set_bottom_right_point(chart.point.new(last_bar_time,na,bottom))
l_abel.set_point( chart.point.new(na,labelIndex,labelLevel))
// @function draw premium/discount zones
// @returns void
drawPremiumDiscountZones() =>
drawZone(trailing.top, math.round(0.5*(trailing.barIndex + last_bar_index)), trailing.top, 0.95*trailing.top + 0.05*trailing.bottom, 'Premium', premiumZoneColor, label.style_label_down)
equilibriumLevel = math.avg(trailing.top, trailing.bottom)
drawZone(equilibriumLevel, last_bar_index, 0.525*trailing.top + 0.475*trailing.bottom, 0.525*trailing.bottom + 0.475*trailing.top, 'Equilibrium', equilibriumZoneColorInput, label.style_label_left)
drawZone(trailing.bottom, math.round(0.5*(trailing.barIndex + last_bar_index)), 0.95*trailing.bottom + 0.05*trailing.top, trailing.bottom, 'Discount', discountZoneColor, label.style_label_up)
parsedOpen = showTrendInput ? open : na
candleColor = internalTrend.bias == BULLISH ? swingBullishColor : swingBearishColor
plotcandle(parsedOpen,high,low,close,color = candleColor, wickcolor = candleColor, bordercolor = candleColor)
if showHighLowSwingsInput or showPremiumDiscountZonesInput
updateTrailingExtremes()
if showHighLowSwingsInput
drawHighLowSwings()
if showPremiumDiscountZonesInput
drawPremiumDiscountZones()
if showFairValueGapsInput
deleteFairValueGaps()
getCurrentStructure(swingsLengthInput,false)
getCurrentStructure(5,false,true)
if showEqualHighsLowsInput
getCurrentStructure(equalHighsLowsLengthInput,true)
if showInternalsInput or showInternalOrderBlocksInput or showTrendInput
displayStructure(true)
if showStructureInput or showSwingOrderBlocksInput or showHighLowSwingsInput
displayStructure()
if showInternalOrderBlocksInput
deleteOrderBlocks(true)
if showSwingOrderBlocksInput
deleteOrderBlocks()
if showFairValueGapsInput
drawFairValueGaps()
if barstate.islastconfirmedhistory or barstate.islast
if showInternalOrderBlocksInput
drawOrderBlocks(true)
if showSwingOrderBlocksInput
drawOrderBlocks()
lastBarIndex := currentBarIndex
currentBarIndex := bar_index
newBar = currentBarIndex != lastBarIndex
if barstate.islastconfirmedhistory or (barstate.isrealtime and newBar)
if showDailyLevelsInput and not higherTimeframe('D')
drawLevels('D',timeframe.isdaily,dailyLevelsStyleInput,dailyLevelsColorInput)
if showWeeklyLevelsInput and not higherTimeframe('W')
drawLevels('W',timeframe.isweekly,weeklyLevelsStyleInput,weeklyLevelsColorInput)
if showMonthlyLevelsInput and not higherTimeframe('M')
drawLevels('M',timeframe.ismonthly,monthlyLevelsStyleInput,monthlyLevelsColorInput)
xATR = ta.atr(c)
nLoss = a * xATR
src = h ? request.security(ticker.heikinashi(syminfo.tickerid), timeframe.period, close, lookahead = barmerge.lookahead_off) : close
xATRTrailingStop = 0.0
iff_1 = src > nz(xATRTrailingStop , 0) ? src - nLoss : src + nLoss
iff_2 = src < nz(xATRTrailingStop , 0) and src < nz(xATRTrailingStop , 0) ? math.min(nz(xATRTrailingStop ), src + nLoss) : iff_1
xATRTrailingStop := src > nz(xATRTrailingStop , 0) and src > nz(xATRTrailingStop , 0) ? math.max(nz(xATRTrailingStop ), src - nLoss) : iff_2
pos = 0
iff_3 = src > nz(xATRTrailingStop , 0) and src < nz(xATRTrailingStop , 0) ? -1 : nz(pos , 0)
pos := src < nz(xATRTrailingStop , 0) and src > nz(xATRTrailingStop , 0) ? 1 : iff_3
xcolor = pos == -1 ? color.red : pos == 1 ? color.green : color.blue
ema = ta.ema(src, 1)
above = ta.crossover(ema, xATRTrailingStop)
below = ta.crossover(xATRTrailingStop, ema)
buy = src > xATRTrailingStop and above
sell = src < xATRTrailingStop and below
barbuy = src > xATRTrailingStop
barsell = src < xATRTrailingStop
//---------------------------------------------------------------------------------------------------------------------}
//ALERTS
//---------------------------------------------------------------------------------------------------------------------{
alertcondition(currentAlerts.internalBullishBOS, 'Internal Bullish BOS', 'Internal Bullish BOS formed')
alertcondition(currentAlerts.internalBullishCHoCH, 'Internal Bullish CHoCH', 'Internal Bullish CHoCH formed')
alertcondition(currentAlerts.internalBearishBOS, 'Internal Bearish BOS', 'Internal Bearish BOS formed')
alertcondition(currentAlerts.internalBearishCHoCH, 'Internal Bearish CHoCH', 'Internal Bearish CHoCH formed')
alertcondition(currentAlerts.swingBullishBOS, 'Bullish BOS', 'Internal Bullish BOS formed')
alertcondition(currentAlerts.swingBullishCHoCH, 'Bullish CHoCH', 'Internal Bullish CHoCH formed')
alertcondition(currentAlerts.swingBearishBOS, 'Bearish BOS', 'Bearish BOS formed')
alertcondition(currentAlerts.swingBearishCHoCH, 'Bearish CHoCH', 'Bearish CHoCH formed')
alertcondition(currentAlerts.internalBullishOrderBlock, 'Bullish Internal OB Breakout', 'Price broke bullish internal OB')
alertcondition(currentAlerts.internalBearishOrderBlock, 'Bearish Internal OB Breakout', 'Price broke bearish internal OB')
alertcondition(currentAlerts.swingBullishOrderBlock, 'Bullish Swing OB Breakout', 'Price broke bullish swing OB')
alertcondition(currentAlerts.swingBearishOrderBlock, 'Bearish Swing OB Breakout', 'Price broke bearish swing OB')
alertcondition(currentAlerts.equalHighs, 'Equal Highs', 'Equal highs detected')
alertcondition(currentAlerts.equalLows, 'Equal Lows', 'Equal lows detected')
alertcondition(currentAlerts.bullishFairValueGap, 'Bullish FVG', 'Bullish FVG formed')
alertcondition(currentAlerts.bearishFairValueGap, 'Bearish FVG', 'Bearish FVG formed')
alertcondition(buy, 'UT Long', 'UT Long')
alertcondition(sell, 'UT Short', 'UT Short')
plotshape(buy, title = 'Buy', text = 'Buy', style = shape.labelup, location = location.belowbar, color = color.new(color.green, 0), textcolor = color.new(color.white, 0), size = size.tiny)
plotshape(sell, title = 'Sell', text = 'Sell', style = shape.labeldown, location = location.abovebar, color = color.new(color.red, 0), textcolor = color.new(color.white, 0), size = size.tiny)
//--------------------------------------------------------------------------------------
// EMA ADDITIONS (Editable)
//--------------------------------------------------------------------------------------
ema5Len = input.int(5, "5 EMA Length", minval = 1)
ema9Len = input.int(9, "9 EMA Length", minval = 1)
ema5 = ta.ema(src, ema5Len)
ema9 = ta.ema(src, ema9Len)
plot(ema5, "EMA 5", color = color.red, linewidth = 2)
plot(ema9, "EMA 9", color = color.blue, linewidth = 2)
barcolor(barbuy ? color.green : na)
barcolor(barsell ? color.red : na)

Mancini Levels (with alerts, majors only option)This indicator displays Support and Resistance levels on ES or MES (E-mini and Micro E-mini S&P 500 Index Futures) charts by parsing text copied and pasted by the user.
(The levels displayed on the chart above are not valid, they are for illustration only)
Features
Option to display only the major levels
The chart on the left displays both major and minor levels, distinguished by color and line style. The chart on the right shows only the major levels; minor levels are disabled:
Alert function for when the price approaches a major level or zone (within a customizable distance).
The script provides a trigger for alerts. When creating an alert, you can then choose your desired frequency (Only once/Once per bar/Once per bar close/Once per minute) from the TradingView alert pop-up.
The alert message contains the current price and the approached major level price.
Customizable Lookback Period
Set how many days into the past the lines should appear (Subject to a maximum of 5000 bars).
To display lines for the current day only, set this value to 1.
Functions only on ES or MES (E-mini and Micro E-mini S&P 500 Index Futures) charts, as the text format is intended for these instruments.
How to Use
Copy and paste the support and resistance levels into the indicator's "Supports" and "Resistances" input fields.
Format Example:
For the "Supports" input: 6772-6770 (major), 6764 (major), 6757, 6751-54
For the "Resistances" input: 6799 (major), 6814, 6828-30, 6839-40 (major)
The indicator supports the display of zone levels in multiple formats
(e.g., 6235-45 and 6235-6245 and 6245-6235 are all valid).
For hundred- or thousand-point rollovers, please use only the full number format: 5995-6005.
The indicator includes an error-checking system to help you troubleshoot common setup issues.
An on-chart error label will be displayed on the chart if:
The chart instrument is not ES or MES.
The "Supports" and "Resistances" fields are both empty.
A data formatting error is detected (e.g., non-numeric characters, incomplete zones, etc.).
How It Works
For optimal resource efficiency and performance, the script executes all computationally intensive tasks only once, on the very first bar when the chart loads (if barstate.isfirst).
One-time Parsing: The parsing, splitting, and conversion of the text (string) formatted levels, which are provided in the settings, occurs only once.
Persistent Objects: The lines (line.new), fills (linefill.new), and price labels (label.new) that mark the levels are all persistent graphical objects. The script creates these on the first bar and stores their references in arrays declared with the var keyword.
No Redrawing: On subsequent bars, the indicator does not delete and redraw these objects. It merely updates the x-axis position of the existing lines and labels (line.set_x1, line.set_x2, label.set_x) on the last bar (if barstate.islast), ensuring they always remain on the right edge of the chart, following the formation of new bars.
By default, TradingView charts have a limit of 50 lines and 50 labels. Given that the number of levels often exceeds this, the script's drawing logic is as follows:
The number of displayable lines and labels has been increased (to 500) in the indicator's declaration line.
The script applies a prioritized order when drawing levels and labels. Major levels have priority over minor levels during drawing.
Disclaimer
This indicator is provided for educational and informational purposes only. It is not financial advice.
Trading involves substantial risk of loss and is not suitable for every investor. Past performance shown in examples is not indicative of future results.
The indicator provides signals and calculations, but trading decisions are solely your responsibility. Always:
Test strategies on paper before using real money
Never risk more than you can afford to lose
Understand that all trading involves risk
Consider seeking advice from a licensed financial advisor
The publisher makes no guarantees regarding accuracy, profitability, or performance. Use at your own risk.
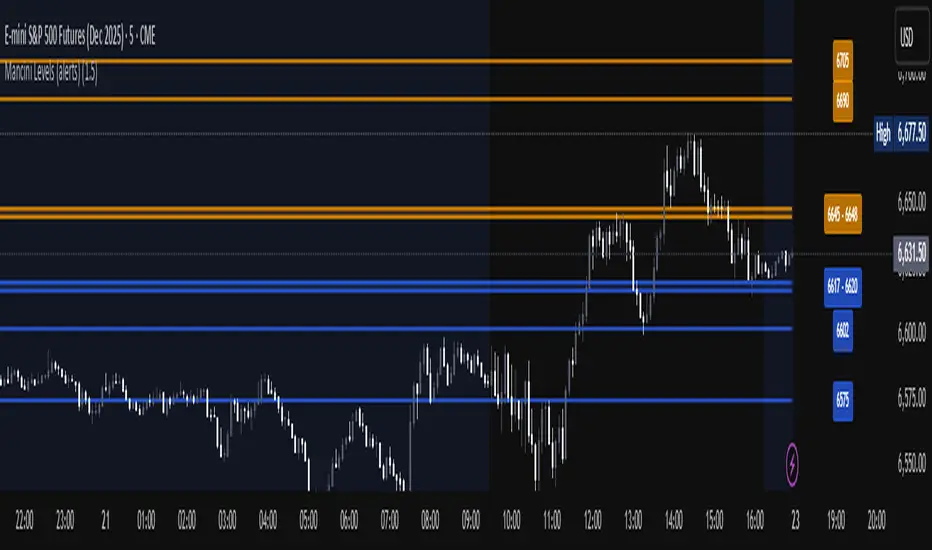
청산맵[by좐주노]//@version=5
indicator("청산맵 "
, overlay = true
, max_lines_count = 500
, max_labels_count = 500
, max_boxes_count = 500)
//------------------------------------------------------------------------------
//Settings
//-----------------------------------------------------------------------------{
length = input(14, '청산기간 기준 ')
area = input.string('꼬리기준', '측정 범위', options = )
intraPrecision = input(false, 'Intrabar Precision', inline = 'intrabar')
intrabarTf = input.timeframe('1', '' , inline = 'intrabar')
filterOptions = input.string('Count', 'Filter Areas By', options = , inline = 'filter')
filterValue = input.float(0, '' , inline = 'filter')
//Style
showTop = input(true, 'Swing High' , inline = 'top', group = 'Style')
topCss = input(color.red, '' , inline = 'top', group = 'Style')
topAreaCss = input(color.new(color.red, 50), 'Area', inline = 'top', group = 'Style')
showBtm = input(true, 'Swing Low' , inline = 'btm', group = 'Style')
btmCss = input(color.teal, '' , inline = 'btm', group = 'Style')
btmAreaCss = input(color.new(color.teal, 50), 'Area', inline = 'btm', group = 'Style')
labelSize = input.string('Tiny', 'Labels Size', options = , group = 'Style')
//-----------------------------------------------------------------------------}
//Functions
//-----------------------------------------------------------------------------{
n = bar_index
get_data()=>
= request.security_lower_tf(syminfo.tickerid, intrabarTf, get_data())
get_counts(condition, top, btm)=>
var count = 0
var vol = 0.
if condition
count := 0
vol := 0.
else
if intraPrecision
if n > length
if array.size(v ) > 0
for in v
vol += array.get(l , index) < top and array.get(h , index) > btm ? element : 0
else
vol += low < top and high > btm ? volume : 0
count += low < top and high > btm ? 1 : 0
set_label(count, vol, x, y, css, lbl_style)=>
var label lbl = na
var label_size = switch labelSize
'Tiny' => size.tiny
'Small' => size.small
'Normal' => size.normal
target = switch filterOptions
'Count' => count
'Volume' => vol
if ta.crossover(target, filterValue)
lbl := label.new(x, y, str.tostring(vol, format.volume)
, style = lbl_style
, size = label_size
, color = #00000000
, textcolor = css)
if target > filterValue
label.set_text(lbl, str.tostring(vol, format.volume))
set_level(condition, crossed, value, count, vol, css)=>
var line lvl = na
target = switch filterOptions
'Count' => count
'Volume' => vol
if condition
if target < filterValue
line.delete(lvl )
else if not crossed
line.set_x2(lvl, n - length)
lvl := line.new(n - length, value, n, value
, color = na)
if not crossed
line.set_x2(lvl, n+3)
if crossed and not crossed
line.set_x2(lvl, n)
line.set_style(lvl, line.style_dashed)
if target > filterValue
line.set_color(lvl, css)
set_zone(condition, x, top, btm, count, vol, css)=>
var box bx = na
target = switch filterOptions
'Count' => count
'Volume' => vol
if ta.crossover(target, filterValue)
bx := box.new(x, top, x + count, btm
, border_color = na
, bgcolor = css)
if target > filterValue
box.set_right(bx, x + count)
//-----------------------------------------------------------------------------}
//Global variables
//-----------------------------------------------------------------------------{
//Pivot high
var float ph_top = na
var float ph_btm = na
var bool ph_crossed = na
var ph_x1 = 0
var box ph_bx = box.new(na,na,na,na
, bgcolor = color.new(topAreaCss, 80)
, border_color = na)
//Pivot low
var float pl_top = na
var float pl_btm = na
var bool pl_crossed = na
var pl_x1 = 0
var box pl_bx = box.new(na,na,na,na
, bgcolor = color.new(btmAreaCss, 80)
, border_color = na)
//-----------------------------------------------------------------------------}
//Display pivot high levels/blocks
//-----------------------------------------------------------------------------{
ph = ta.pivothigh(length, length)
//Get ph counts
= get_counts(ph, ph_top, ph_btm)
//Set ph area and level
if ph and showTop
ph_top := high
ph_btm := switch area
'Wick Extremity' => math.max(close , open )
'Full Range' => low
ph_x1 := n - length
ph_crossed := false
box.set_lefttop(ph_bx, ph_x1, ph_top)
box.set_rightbottom(ph_bx, ph_x1, ph_btm)
else
ph_crossed := close > ph_top ? true : ph_crossed
if ph_crossed
box.set_right(ph_bx, ph_x1)
else
box.set_right(ph_bx, n+3)
if showTop
//Set ph zone
set_zone(ph, ph_x1, ph_top, ph_btm, ph_count, ph_vol, topAreaCss)
//Set ph level
set_level(ph, ph_crossed, ph_top, ph_count, ph_vol, topCss)
//Set ph label
set_label(ph_count, ph_vol, ph_x1, ph_top, topCss, label.style_label_down)
//-----------------------------------------------------------------------------}
//Display pivot low levels/blocks
//-----------------------------------------------------------------------------{
pl = ta.pivotlow(length, length)
//Get pl counts
= get_counts(pl, pl_top, pl_btm)
//Set pl area and level
if pl and showBtm
pl_top := switch area
'Wick Extremity' => math.min(close , open )
'Full Range' => high
pl_btm := low
pl_x1 := n - length
pl_crossed := false
box.set_lefttop(pl_bx, pl_x1, pl_top)
box.set_rightbottom(pl_bx, pl_x1, pl_btm)
else
pl_crossed := close < pl_btm ? true : pl_crossed
if pl_crossed
box.set_right(pl_bx, pl_x1)
else
box.set_right(pl_bx, n+3)
if showBtm
//Set pl zone
set_zone(pl, pl_x1, pl_top, pl_btm, pl_count, pl_vol, btmAreaCss)
//Set pl level
set_level(pl, pl_crossed, pl_btm, pl_count, pl_vol, btmCss)
//Set pl labels
set_label(pl_count, pl_vol, pl_x1, pl_btm, btmCss, label.style_label_up)
//-----------------------------------------------------------------------------}

Smart Money Concepts [XoRonX]# Smart Money Concepts (SMC) - Advanced Trading Indicator
## 📊 Deskripsi
**Smart Money Concepts ** adalah indicator trading komprehensif yang menggabungkan konsep Smart Money Trading dengan berbagai alat teknikal analisis modern. Indicator ini dirancang untuk membantu trader mengidentifikasi pergerakan institusional (smart money), struktur pasar, zona supply/demand, dan berbagai sinyal trading penting.
Indicator ini mengintegrasikan multiple timeframe analysis, order blocks detection, fair value gaps, fibonacci retracement, volume profile, RSI multi-timeframe, dan moving averages dalam satu platform yang powerful dan mudah digunakan.
---
## 🎯 Fitur Utama
### 1. **Smart Money Structure**
- **Internal Structure** - Struktur pasar jangka pendek untuk entry presisi
- **Swing Structure** - Struktur pasar jangka panjang untuk trend analysis
- **BOS (Break of Structure)** - Konfirmasi kelanjutan trend
- **CHoCH (Change of Character)** - Deteksi potensi reversal
### 2. **Order Blocks**
- **Internal Order Blocks** - Zona demand/supply jangka pendek
- **Swing Order Blocks** - Zona demand/supply jangka panjang
- Filter otomatis berdasarkan volatilitas (ATR/Range)
- Mitigation tracking (High/Low atau Close)
- Customizable display (jumlah order blocks yang ditampilkan)
### 3. **Equal Highs & Equal Lows (EQH/EQL)**
- Deteksi otomatis equal highs/lows
- Indikasi liquidity zones
- Threshold adjustment untuk sensitivitas
- Visual lines dan labels
### 4. **Fair Value Gaps (FVG)**
- Multi-timeframe FVG detection
- Auto threshold filtering
- Bullish & Bearish FVG boxes
- Extension control
- Color customization
### 5. **Premium & Discount Zones**
- Premium Zone (75-100% dari range)
- Equilibrium Zone (47.5-52.5% dari range)
- Discount Zone (0-25% dari range)
- Auto-update berdasarkan swing high/low
### 6. **Fibonacci Retracement**
- **Equilibrium to Discount** - Fib dari EQ ke discount zone
- **Equilibrium to Premium** - Fib dari EQ ke premium zone
- **Discount to Premium** - Fib full range
- Reverse option
- Show/hide lines
- Custom colors
### 7. **Volume Profile (VRVP)**
- Visible Range Volume Profile
- Point of Control (POC)
- Value Area (70% volume)
- Auto-adjust rows
- Placement options (Left/Right)
- Width customization
### 8. **RSI Multi-Timeframe**
- Monitor 3 timeframes sekaligus
- Overbought/Oversold signals
- Visual table display
- Color-coded signals (Red OB, Green OS)
- Customizable position & size
### 9. **Moving Averages**
- 3 Moving Average lines
- Pilihan tipe: EMA, SMA, WMA
- Automatic/Manual period mode
- Individual color & width settings
- Cross alerts (MA vs MA, Price vs MA)
### 10. **Multi-Timeframe Levels**
- Support up to 5 different timeframes
- Previous high/low levels
- Custom line styles
- Color customization
### 11. **Candle Color**
- Color candles berdasarkan trend
- Bullish = Green, Bearish = Red
- Optional toggle
---
## 🛠️ Cara Penggunaan
### **A. Setup Awal**
1. **Tambahkan Indicator ke Chart**
- Buka TradingView
- Klik "Indicators" → "My Scripts" atau paste code
- Pilih "Smart Money Concepts "
2. **Pilih Mode Display**
- **Historical**: Tampilkan semua struktur (untuk backtesting)
- **Present**: Hanya tampilkan struktur terbaru (clean chart)
3. **Pilih Style**
- **Colored**: Warna berbeda untuk bullish/bearish
- **Monochrome**: Tema warna abu-abu
---
### **B. Penggunaan Fitur**
#### **1. Smart Money Structure**
**Internal Structure (Real-time):**
- ✅ Aktifkan "Show Internal Structure"
- Pilih tampilan: All, BOS only, atau CHoCH only
- Gunakan untuk entry timing presisi
- Filter confluence untuk mengurangi noise
**Swing Structure:**
- ✅ Aktifkan "Show Swing Structure"
- Pilih tampilan struktur bullish/bearish
- Adjust "Swings Length" (default: 50)
- Gunakan untuk konfirmasi trend utama
**Tips:**
- BOS = Konfirmasi trend continuation
- CHoCH = Warning untuk possible reversal
- Tunggu price retest ke order block setelah BOS
---
#### **2. Order Blocks**
**Setup:**
- ✅ Aktifkan Internal/Swing Order Blocks
- Set jumlah blocks yang ditampil (1-20)
- Pilih filter: ATR atau Cumulative Mean Range
- Pilih mitigation: Close atau High/Low
**Cara Trading:**
1. Tunggu BOS/CHoCH terbentuk
2. Identifikasi order block terdekat
3. Wait for price pullback ke order block
4. Entry saat price respek order block (rejection)
5. Stop loss di bawah/atas order block
6. Target: swing high/low berikutnya
**Color Code:**
- 🔵 Light Blue = Internal Bullish OB
- 🔴 Light Red = Internal Bearish OB
- 🔵 Dark Blue = Swing Bullish OB
- 🔴 Dark Red = Swing Bearish OB
---
#### **3. Equal Highs/Lows (EQH/EQL)**
**Setup:**
- ✅ Aktifkan "Equal High/Low"
- Set "Bars Confirmation" (default: 3)
- Adjust threshold (0-0.5, default: 0.1)
**Interpretasi:**
- EQH = Liquidity di atas, kemungkinan sweep lalu dump
- EQL = Liquidity di bawah, kemungkinan sweep lalu pump
- Biasanya smart money akan grab liquidity sebelum move besar
**Trading Strategy:**
- Wait for EQH/EQL formation
- Anticipate liquidity grab
- Entry setelah sweep dengan konfirmasi (order block, FVG, CHoCH)
---
#### **4. Fair Value Gaps (FVG)**
**Setup:**
- ✅ Aktifkan "Fair Value Gaps"
- Pilih timeframe (default: chart timeframe)
- Enable/disable auto threshold
- Set extension bars
**Cara Trading:**
1. Bullish FVG = Support zone untuk buy
2. Bearish FVG = Resistance zone untuk sell
3. Price tends to fill FVG (retest)
4. Entry saat price kembali ke FVG
5. Partial fill = valid, full fill = invalidated
**Tips:**
- FVG + Order Block = High probability setup
- Multi-timeframe FVG lebih kuat
- Unfilled FVG = strong momentum
---
#### **5. Premium & Discount Zones**
**Setup:**
- ✅ Aktifkan "Premium/Discount Zones"
- Zones akan auto-update berdasarkan swing high/low
**Interpretasi:**
- 🟢 **Discount Zone** = Area BUY (price murah)
- ⚪ **Equilibrium** = Neutral (50%)
- 🔴 **Premium Zone** = Area SELL (price mahal)
**Trading Strategy:**
- BUY dari discount zone
- SELL dari premium zone
- Avoid trading di equilibrium
- Combine dengan structure confirmation
---
#### **6. Fibonacci Retracement**
**Setup:**
- Pilih Fib yang ingin ditampilkan:
- Equilibrium to Discount
- Equilibrium to Premium
- Discount to Premium
- Toggle show lines
- Enable reverse jika perlu
- Custom colors
**Key Levels:**
- 0.236 = Shallow retracement
- 0.382 = Common retracement
- 0.5 = 50% golden level
- 0.618 = Golden ratio (penting!)
- 0.786 = Deep retracement
**Cara Pakai:**
- 0.618-0.786 = Ideal entry zone dalam trend
- Combine dengan order blocks
- Wait for confirmation candle
---
#### **7. Volume Profile (VRVP)**
**Setup:**
- ✅ Aktifkan "Show Volume Profile"
- Set jumlah rows (10-100)
- Adjust width (5-50%)
- Pilih placement (Left/Right)
- Enable POC dan Value Area
**Interpretasi:**
- **POC (Point of Control)** = Harga dengan volume tertinggi = magnet
- **Value Area** = 70% volume = fair price range
- **Low Volume Nodes** = Weak support/resistance
- **High Volume Nodes** = Strong support/resistance
**Trading:**
- POC acts as support/resistance
- Price tends to return to POC
- Breakout dari Value Area = momentum
---
#### **8. RSI Multi-Timeframe**
**Setup:**
- ✅ Aktifkan "Show RSI Table"
- Set 3 timeframes (default: chart, 5m, 15m)
- Set RSI period (default: 14)
- Set Overbought level (default: 70)
- Set Oversold level (default: 30)
- Pilih posisi & ukuran table
**Interpretasi:**
- 🟢 **OS (Oversold)** = RSI ≤ 30 = Kondisi jenuh jual
- 🔴 **OB (Overbought)** = RSI ≥ 70 = Kondisi jenuh beli
- **-** = Neutral zone
**Trading Strategy:**
1. Multi-timeframe alignment = strong signal
2. OS + Bullish structure = BUY signal
3. OB + Bearish structure = SELL signal
4. Divergence RSI vs Price = reversal warning
**Contoh:**
- TF1: OS, TF2: OS, TF3: OS + Price di discount zone = STRONG BUY
---
#### **9. Moving Averages**
**Setup:**
- Pilih MA Type: EMA, SMA, atau WMA (berlaku untuk ketiga MA)
- Pilih Period Mode: Automatic atau Manual
- Set period untuk MA 1, 2, 3 (default: 20, 50, 100)
- Custom color & width per MA
- ✅ Enable Cross Alerts
**Interpretasi:**
- **Golden Cross** = MA fast cross above MA slow = Bullish
- **Death Cross** = MA fast cross below MA slow = Bearish
- Price above all MAs = Strong uptrend
- Price below all MAs = Strong downtrend
**Trading Strategy:**
1. MA1 (20) = Short-term trend
2. MA2 (50) = Medium-term trend
3. MA3 (100) = Long-term trend
**Entry Signals:**
- Price bounce dari MA dalam trend = continuation
- MA cross dengan konfirmasi structure = entry
- Multiple MA confluence = strong support/resistance
**Alerts Available:**
- MA1 cross MA2/MA3
- MA2 cross MA3
- Price cross any MA
---
#### **10. Multi-Timeframe Levels**
**Setup:**
- Enable HTF Level 1-5
- Set timeframes (contoh: 5m, 1H, 4H, D, W)
- Pilih line style (solid/dashed/dotted)
- Custom colors
**Cara Pakai:**
- Previous high/low dari HTF = strong S/R
- Breakout HTF level = significant move
- Multiple HTF levels confluence = major zone
---
### **C. Trading Setup Combination**
#### **Setup 1: High Probability Buy (Bullish)**
1. ✅ Swing structure: Bullish BOS
2. ✅ Price di Discount Zone
3. ✅ Pullback ke Bullish Order Block
4. ✅ Bullish FVG di bawah
5. ✅ RSI Multi-TF: Oversold
6. ✅ Price bounce dari MA
7. ✅ POC/Value Area support
8. ✅ Fibonacci 0.618-0.786 retracement
**Entry:** Saat price reject dari order block dengan confirmation candle
**Stop Loss:** Below order block
**Target:** Swing high atau premium zone
---
#### **Setup 2: High Probability Sell (Bearish)**
1. ✅ Swing structure: Bearish BOS
2. ✅ Price di Premium Zone
3. ✅ Pullback ke Bearish Order Block
4. ✅ Bearish FVG di atas
5. ✅ RSI Multi-TF: Overbought
6. ✅ Price reject dari MA
7. ✅ POC/Value Area resistance
8. ✅ Fibonacci 0.618-0.786 retracement
**Entry:** Saat price reject dari order block dengan confirmation candle
**Stop Loss:** Above order block
**Target:** Swing low atau discount zone
---
#### **Setup 3: Liquidity Grab (EQH/EQL)**
1. ✅ Identifikasi EQH atau EQL
2. ✅ Wait for liquidity sweep
3. ✅ Konfirmasi dengan CHoCH
4. ✅ Order block terbentuk setelah sweep
5. ✅ Entry saat retest order block
---
### **D. Tips & Best Practices**
**Risk Management:**
- Selalu gunakan stop loss
- Risk 1-2% per trade
- Risk:Reward minimum 1:2
- Jangan over-leverage
**Confluence adalah Kunci:**
- Minimal 3-4 konfirmasi sebelum entry
- Lebih banyak konfirmasi = higher probability
- Quality over quantity
**Timeframe Analysis:**
- HTF (Higher Timeframe) = Trend direction
- LTF (Lower Timeframe) = Entry timing
- Align dengan HTF trend
**Backtesting:**
- Gunakan mode "Historical"
- Test strategy di berbagai market condition
- Record dan analyze hasil
**Market Condition:**
- Trending market = Follow BOS, use order blocks
- Ranging market = Use premium/discount zones, EQH/EQL
- High volatility = Wider stops, wait for clear structure
**Avoid:**
- Trading di equilibrium zone
- Entry tanpa konfirmasi
- Fighting the trend
- Overleveraging
- Emotional trading
---
## 📈 Recommended Settings
### **For Scalping (1m - 5m):**
- Internal Structure: ON
- Swing Structure: OFF
- Order Blocks: Internal only
- RSI Timeframes: 1m, 5m, 15m
- MA Periods: 9, 21, 50
### **For Day Trading (15m - 1H):**
- Internal Structure: ON
- Swing Structure: ON
- Order Blocks: Both
- RSI Timeframes: 15m, 1H, 4H
- MA Periods: 20, 50, 100
### **For Swing Trading (4H - D):**
- Internal Structure: OFF
- Swing Structure: ON
- Order Blocks: Swing only
- RSI Timeframes: 4H, D, W
- MA Periods: 20, 50, 200
---
## ⚠️ Disclaimer
Indicator ini adalah alat bantu analisis teknikal. Tidak ada indicator yang 100% akurat. Selalu:
- Lakukan analisa fundamental
- Gunakan proper risk management
- Praktik di demo account terlebih dahulu
- Trading memiliki resiko, trade at your own risk
---
## 📝 Version Info
**Version:** 5.0
**Platform:** TradingView Pine Script v5
**Author:** XoRonX
**Max Labels:** 500
**Max Lines:** 500
**Max Boxes:** 500
---
## 🔄 Updates & Support
Untuk update, bug reports, atau pertanyaan:
- Check documentation regularly
- Test new features in replay mode
- Backup your settings before updates
---
## 🎓 Learning Resources
**Recommended Study:**
1. Smart Money Concepts (SMC) basics
2. Order blocks theory
3. Liquidity concepts
4. ICT (Inner Circle Trader) concepts
5. Volume profile analysis
6. Multi-timeframe analysis
**Practice:**
- Start with higher timeframes
- Master one concept at a time
- Keep a trading journal
- Review your trades weekly
---
**Happy Trading! 🚀📊**
_Remember: The best indicator is your own analysis and discipline._

Macketings 1min ScalpingThis is a hyper-reactive scalping strategy designed for the 1-minute chart. It utilizes a strict four-EMA hierarchy (80/90/340/500) to ensure trades are only taken in the strongest aligned market trend. The strategy is built to be extremely tight on risk and focuses on capturing the immediate, high-momentum swing that follows a confirmed EMA retest or breakout.
Key Mechanics (How it Works):
Strict Trend Alignment: Entry is only permitted when the faster EMA band (80/90) and the price action are correctly aligned with the slow trend (340/500).
Long: EMA 80/90 must be above EMA 340/500, AND EMA 340 must be above EMA 500. (And vice-versa for Short.)
Expanded Retest Entry: The strategy waits for the price to retest or briefly enter the 80/90 band, then immediately enters upon the confirmed momentum breakout from that band.
Dynamic Risk Management (Tight Ride): The strategy is engineered to ride the wave aggressively while protecting capital immediately:
Extremely Tight Initial Stop Loss (0.2% default): Limits initial risk instantly.
Break-Even Security: Once profit hits 0.3%, the Stop Loss is automatically trailed to secure 0.2% profit (a risk-free trade).
Aggressive Exit Logic: Positions are closed not only upon hitting the Take Profit target (2.5%) but also immediately if the 80/90 EMA band crosses the 340 EMA, signaling a critical loss of momentum.
Disclaimer:
This strategy requires high-liquidity instruments and is best used on low timeframes (1-minute) due to its dependency on fast momentum shifts and tight stops. Backtesting and forward testing are crucial before deployment.

Macro Range HighlighterThis Pine Script indicator creates visual boxes that highlight specific time-based price ranges throughout the trading day, operating in New York Eastern Time. It offers two distinct modes: a standard hourly range mode and a classic ICT (Inner Circle Trader) Macro mode.
Two Operating Modes
Mode 1: Standard Hourly 50-09 Ranges (Default)
This mode identifies and highlights the price range during the final 10 minutes of each hour (xx:50) through the first 9 minutes of the next hour (xx:09).
Examples of captured ranges:
08:50 - 09:09
09:50 - 10:09
10:50 - 11:09
11:50 - 12:09
12:50 - 13:09
13:50 - 14:09
14:50 - 15:09
And continues for each hour...
Excluded Time Periods:
The indicator excludes certain periods that cross into or occur during market close and the daily reset:
02:50 - 03:09 (excluded to avoid interference with overnight session)
15:50 - 18:09 (excluded to avoid end-of-regular-hours and the 18:00 ET trading day reset)
This means you will NOT see boxes during the 16:00 or 17:00 hours, as these fall within the excluded window.
Mode 2: Classic ICT Macro Times
When enabled, this mode shows ONLY four specific time windows that are significant in ICT methodology:
02:33 - 02:59 (London Midnight Macro)
04:03 - 04:29 (London Open Macro)
13:10 - 13:39 (New York Lunch Macro)
15:15 - 15:44 (New York Close Macro)
When this mode is active, all standard hourly ranges are disabled, including the 02:50-03:09 range.
Green Line - Open Price
Represents the open price of the first candle when the range begins
This line is static once set - it shows where price opened when entering the time window
Extends horizontally across the entire duration of the box
Example: If the range starts at 08:50 and that candle opens at 18,500, the green line will be drawn at 18,500
Blue Line - Evolving Midpoint
Represents the dynamic midpoint between the range high and range low
This line continuously recalculates as new highs or lows are made within the time window
Calculation: Midpoint = (Range High + Range Low) / 2
Evolution example:
At 08:50, range is 18,480 (low) to 18,520 (high), midpoint = 18,500
At 08:55, price makes new high of 18,540, midpoint updates to 18,510
At 09:02, price makes new low of 18,470, midpoint updates to 18,505
The line visually adjusts up and down as the range expands
Extension: The line extends horizontally from the start of the range to the current bar (or end of range)
This gives traders a visual reference for the "fair value" or equilibrium point of the range
Red Line - Close Price
Represents the close price of the most recent candle within the time window
This line updates continuously with each new bar's close price
Extends horizontally across the range
When the range completes (exits the time window), it shows the final close price of the last bar in the range
Example: As price moves from 08:50 to 09:09, the red line will track the close of each candle: 18,505 → 18,510 → 18,508 → 18,515, etc.
This indicator provides a sophisticated visual framework for analyzing specific time-based price behavior. The evolving midpoint (blue line and optional yellow plot) is particularly powerful because it gives you real-time feedback on where the "fair value" of the range is as it develops, allowing you to make informed decisions about whether price is extended or returning to equilibrium. The three-line system (open/mid/close) creates a complete picture of price action within each critical time window, whether you're using standard hourly analysis or focusing on ICT's specific macro times.

TraderDemircan Auto Fibonacci RetracementDescription:
What This Indicator Does:This indicator automatically identifies significant swing high and swing low points within a customizable lookback period and draws comprehensive Fibonacci retracement and extension levels between them. Unlike the manual Fibonacci tool that requires you to constantly redraw levels as price action evolves, this automated version continuously updates the Fibonacci grid based on the most recent major swing points, ensuring you always have current and relevant support/resistance zones displayed on your chart.Key Features:
Automatic Swing Detection: Continuously scans the specified lookback period to find the most significant high and low points, eliminating manual drawing errors
Comprehensive Level Coverage: Plots 16 Fibonacci levels including 7 retracement levels (0.0 to 1.0) and 9 extension levels (1.115 to 3.618)
Top-Down Methodology: Draws from swing high to swing low (right-to-left), following the traditional Fibonacci retracement convention where 100% is at the top
Dual Labeling System: Shows both exact price values and Fibonacci percentages for easy reference
Complete Customization: Individual toggle controls and color selection for each of the 16 levels
Flexible Display Options: Adjust line thickness (1-5), style (solid/dashed/dotted), and extension direction (left/right/both)
Visual Swing Markers: Red diamond at the swing high (starting point) and green diamond at the swing low (ending point)
Optional Trend Line: Connects the two swing points to visualize the overall price movement direction
How It Works:The indicator employs a sophisticated swing point detection algorithm that operates in two stages:Stage 1 - Find the Swing Low (Support Base):
Scans the entire lookback period to identify the lowest low, which becomes the anchor point (0.0 level in traditional retracement terms, though displayed at the bottom of the grid).Stage 2 - Find the Swing High (Resistance Peak):
After identifying the swing low, searches for the highest high that occurred after that low point, establishing the swing range. This creates a valid price movement range for Fibonacci analysis.Fibonacci Calculation Method:
The indicator uses the top-down approach where:
1.0 Level = Swing High (100% retracement, the top)
0.0 Level = Swing Low (0% retracement, the bottom)
Retracement Levels (0.236 to 0.786) = Potential support zones during pullbacks from the high
Extension Levels (1.115 to 3.618) = Potential target zones below the swing low
Formula: Price = SwingHigh - (SwingHigh - SwingLow) × FibonacciLevelThis ensures that 0.0 is at the bottom and extensions (>1.0) plot below the swing low, following standard Fibonacci retracement convention.Fibonacci Levels Explained:Retracement Levels (0.0 - 1.0):
0.0 (Gray): Swing low - the base support level
0.236 (Red): Shallow retracement, first minor support
0.382 (Orange): Moderate retracement, commonly watched support
0.5 (Purple): Psychological midpoint, significant support/resistance
0.618 (Blue - Golden Ratio): The most important retracement level, high-probability reversal zone
0.786 (Cyan): Deep retracement, last defense before full reversal
1.0 (Gray): Swing high - the initial resistance level
Extension Levels (1.115 - 3.618):
1.115 (Green): First extension, minimal downside target
1.272 (Light Green): Minor extension, common profit target
1.414 (Yellow-Green): Square root of 2, mathematical significance
1.618 (Gold - Golden Extension): Primary downside target, most watched extension level
2.0 (Orange-Red): 200% extension, psychological round number
2.382 (Pink): Secondary extension target
2.618 (Purple): Deep extension, major target zone
3.272 (Deep Purple): Extreme extension level
3.618 (Blue): Maximum extension, rare but powerful target
How to Use:For Retracement Trading (Buying Pullbacks in Uptrends):
Wait for price to make a significant move up from swing low to swing high
When price starts pulling back, watch for reactions at key Fibonacci levels
Most common entry zones: 0.382, 0.5, and especially 0.618 (golden ratio)
Enter long positions when price shows reversal signals (candlestick patterns, volume increase) at these levels
Place stop loss below the next Fibonacci level
Target: Return to swing high or higher extension levels
For Extension Trading (Profit Targets):
After price breaks below the swing low (0.0 level), use extensions as profit targets
First target: 1.272 (conservative)
Primary target: 1.618 (golden extension - most commonly reached)
Extended target: 2.618 (for strong trends)
Extreme target: 3.618 (only in powerful trending moves)
For Counter-Trend Trading (Fading Extremes):
When price reaches deep retracements (0.786 or below), look for exhaustion signals
Watch for divergences between price and momentum indicators at these levels
Enter reversal trades with tight stops below the swing low
Target: 0.5 or 0.382 levels on the bounce
For Trend Continuation:
In strong uptrends, shallow retracements (0.236 to 0.382) often hold
Use these as low-risk entry points to join the existing trend
Failure to hold 0.5 suggests weakening momentum
Breaking below 0.618 often indicates trend reversal, not just retracement
Multi-Timeframe Strategy:
Use daily timeframe Fibonacci for major support/resistance zones
Use 4H or 1H Fibonacci for precise entry timing within those zones
Confluence between multiple timeframe Fibonacci levels creates high-probability zones
Example: Daily 0.618 level aligning with 4H 0.5 level = strong support
Settings Guide:Lookback Period (10-500):
Short (20-50): Captures recent swings, more frequent updates, suited for day trading
Medium (50-150): Balanced approach, good for swing trading (default: 100)
Long (150-500): Identifies major market structure, suited for position trading
Higher values = more stable levels but slower to adapt to new trends
Pivot Sensitivity (1-20):
Controls how many candles are required to confirm a swing point
Low (1-5): More sensitive, identifies minor swings (default: 5)
High (10-20): Less sensitive, only major swings qualify
Use higher sensitivity on lower timeframes to filter noise
Individual Level Toggles:
Enable only the levels you actively trade to reduce chart clutter
Common minimalist setup: Show only 0.382, 0.5, 0.618, 1.0, 1.618, 2.618
Comprehensive setup: Enable all levels for maximum information
Visual Customization:
Line Thickness: Thicker lines (3-5) for presentation, thinner (1-2) for trading
Line Style: Solid for primary levels (0.5, 0.618, 1.618), dashed/dotted for secondary
Price Labels: Essential for knowing exact entry/exit prices
Percent Labels: Helpful for quickly identifying which Fibonacci level you're looking at
Extension Direction: Extend right for forward-looking analysis, left for historical context
What Makes This Original:While Fibonacci indicators are common on TradingView, this script's originality comes from:
Intelligent Two-Stage Detection: Unlike simple high/low finders, this uses a sequential approach (find low first, then find the high that occurred after it), ensuring logical price flow representation
Comprehensive Level Set: Includes 16 levels spanning from retracement to extreme extensions, more than most Fibonacci tools
Top-Down Methodology: Properly implements the traditional Fibonacci retracement convention (high to low) rather than the reverse
Automatic Range Validation: Only draws Fibonacci when both swing points are valid and in the correct temporal order
Dual Extension Options: Separate controls for extending lines left (historical context) and right (forward projection)
Smart Label Positioning: Places percentage labels on the left and price labels on the right for clarity
Visual Swing Confirmation: Diamond markers at swing points help users understand why levels are positioned where they are
Important Considerations:
Historical Nature: Fibonacci retracements are based on past price swings; they don't predict future moves, only suggest potential support/resistance
Self-Fulfilling Prophecy: Fibonacci levels work partly because many traders watch them, creating actual support/resistance at those levels
Not All Levels Hold: In strong trends, price may slice through multiple Fibonacci levels without pausing
Context Matters: Fibonacci works best when aligned with other support/resistance (previous highs/lows, moving averages, trendlines)
Volume Confirmation: The most reliable Fibonacci reversals occur with volume spikes at key levels
Dynamic Updates: The levels will redraw as new swing highs/lows form, so don't rely solely on static screenshots
Best Practices:
Don't Trade Blindly: Fibonacci levels are zones, not exact prices. Look for confirmation (candlestick patterns, indicators, volume)
Combine with Price Action: Watch for pin bars, engulfing candles, or doji at key Fibonacci levels
Use Stop Losses: Place stops beyond the next Fibonacci level to give trades room but limit risk
Scale In/Out: Consider entering partial positions at 0.5 and adding more at 0.618 rather than all-in at one level
Check Multiple Timeframes: Daily Fibonacci + 4H Fibonacci convergence = high-probability zone
Respect the 0.618: This golden ratio level is historically the most reliable for reversals
Extensions Need Strong Trends: Don't expect extensions to be hit unless there's clear momentum beyond the swing low
Optimal Timeframes:
Scalping (1-5 minutes): Lookback 20-30, watch 0.382, 0.5, 0.618 only
Day Trading (15m-1H): Lookback 50-100, all retracement levels important
Swing Trading (4H-Daily): Lookback 100-200, focus on 0.5, 0.618, 0.786, and extensions
Position Trading (Daily-Weekly): Lookback 200-500, all levels relevant for long-term planning
Common Fibonacci Trading Mistakes to Avoid:
Wrong Swing Selection: Choosing insignificant swings produces meaningless levels
Premature Entry: Entering as soon as price touches a Fibonacci level without confirmation
Ignoring Trend: Fighting the main trend by buying deep retracements in downtrends
Over-Reliance: Using Fibonacci in isolation without confirming with other technical factors
Static Analysis: Not updating your Fibonacci as market structure evolves
Arbitrary Lookback: Using the same lookback period for all assets and timeframes
Integration with Other Tools:Fibonacci + Moving Averages:
When 0.618 level aligns with 50 or 200 EMA, confluence creates stronger support
Price bouncing from both Fibonacci and MA simultaneously = high-probability trade
Fibonacci + RSI/Stochastic:
Oversold indicators at 0.618 or deeper retracements = strong buy signal
Overbought indicators at swing high (1.0) = potential reversal warning
Fibonacci + Volume Profile:
High-volume nodes aligning with Fibonacci levels create robust support/resistance
Low-volume areas near Fibonacci levels may see rapid price movement through them
Fibonacci + Trendlines:
Fibonacci retracement level + ascending trendline = double support
Breaking both simultaneously confirms trend change
Technical Notes:
Uses ta.lowest() and ta.highest() for efficient swing detection across the lookback period
Implements dynamic line and label arrays for clean redraws without memory leaks
All calculations update in real-time as new bars form
Extension options allow customization without modifying core code
Format.mintick ensures price labels match the symbol's minimum price increment
Tooltip on swing markers shows exact price values for precision

High Volume Zones with Signals – HVZ█ OVERVIEW
"High Volume Zones with Signals – HVZ" is a technical analysis indicator that identifies High Volume Zones (HVZ) on the chart and draws them as fully customizable boxes. Perfect for traders using price action, ICT, and Smart Money Concepts. The indicator highlights key volume-based support/resistance levels, detects potential consolidation zones (very large candles), and generates precise breakout and exit signals. Flexible volume filters, ATR filter, and visual styling options ensure a clean and highly effective chart.
█ CONCEPTS
The indicator detects candles with volume significantly above the average (default ≥ 2× SMA of volume over 20 periods). Such candles often signal institutional activity and create strong supply/demand zones.
The ATR filter additionally identifies very large candles – frequently a sign of market capitulation (panic buying/selling). Within the range of such a candle, prolonged consolidation often occurs, especially on higher timeframes (e.g., 4H and above).
Why are HVZ important? High-volume zones are areas where the market has left a large number of orders – institutions return there to “refresh” liquidity before the next move. A breakout against the zone’s character triggers a Break signal:
- Bullish HVZ broken downward (close below the lower boundary) → Break Down (sell),
- Bearish HVZ broken upward (close above the upper boundary) → Break Up (buy).
Note: The indicator requires real exchange volume – it will not work correctly on instruments without reported volume (e.g., certain CFDs or forex).
█ FEATURES
- HVZ Detection: Automatic identification of high-volume zones with Volume SMA Length and Volume Multiplier filters; historical initialization up to 500 candles back.
- ATR Filter: Optional detection of very large candles (potential consolidation/capitulation) using - ATR Length and ATR Multiplier; three action modes:
Skip Zone – large candle creates no zone,
Separate Color – zone is drawn in a distinct style (gray by default),
Normal Zone – treated like a regular HVZ.
- Gray zones (large candles, Separate Color): generate exactly the same Break signals as regular zones – based solely on the original candle direction (bullish → Break Down on lower break, bearish → Break Up on upper break). Gray color is only a visual marker for potential consolidation/capitulation zones.
- Customizable Boxes: Separate styles for bullish and bearish zones (border color, background gradient, line thickness and style); adjustable background and 50 % midline transparency.
- Break & Exit Signals:
Break Up/Down – green/red triangle after a candle closes outside the zone (zone disappears, triangle remains as a trace).
Exit Up/Down – green/red circle when price leaves the zone without a full breakout.
Signal Type option: Break, Exit, or Both.
- Midline: Automatic dashed line at the 50 % zone level with independent transparency control.
- Chart Cleanup: Automatic removal of inactive zones older than 500 candles (max_boxes_count=500).
- Alerts: Built-in alerts for Break Up and Break Down with clear messages.
█ HOW TO USE
Add to Chart: Paste the script in Pine Editor or find it in TradingView’s indicator library.
Configure Settings:
- Volume Filter: Volume SMA Length (default 20) and Volume Multiplier (default 2.0) – higher multiplier = fewer but stronger zones.
- ATR Filter: Enable/disable, set ATR Length (14) and ATR Multiplier (3.5); choose action for very large candles (Skip Zone / Separate Color / Normal Zone).
- Box Style: Background transparency (90) and midline transparency (70).
- Bull/Bear Box Style: Border and gradient colors, line thickness (1-5).
- ATR Style: Separate colors for large-candle zones (gray by default).
- Signal Settings: Choose Signal Type (Break/Exit/Both) and signal colors.
Signal Interpretation:
- Break Up (green triangle below bar): Bearish HVZ broken upward → buy signal, continuation of uptrend.
- Break Down (red triangle above bar): Bullish HVZ broken downward → sell signal, continuation of downtrend.
- Exit Up/Down (circles): Price leaves zone without breakout – may signal end of correction or reversal setup.
- HVZ Zones: Price often returns to high-volume zones to clear orders. An unfilled zone remains a price magnet.
- 50 % Level (midline): Ideal target for partial take-profit or reaction point inside the zone.
Combine signals with other tools (e.g., RSI, MACD, higher timeframes) for higher confidence.
█ APPLICATIONS
- Price Action & ICT: HVZ act as dynamic S/R; in an uptrend look for buys after breaking a bearish HVZ, in a downtrend look for sells after breaking a bullish HVZ. If you trade retests instead of breakouts, increase Volume Multiplier to 2.5-3.0 – fewer zones but much stronger. Note that after breaking a very strong zone, price often pulls back deeply before continuing.
- Breakout Strategies: For maximum Break signals, lower Volume Multiplier to 1.5-1.8 – gives many high-quality entries in trending markets. Always trade in the direction of the prevailing trend (e.g., only longs in uptrends). Enter after a Break signal with confirmation from volume or momentum (MACD above zero, RSI >50 for longs, <50 for shorts).
█ NOTES
- The indicator requires real exchange volume – it will not function properly on instruments without reported volume (e.g., certain CFDs, forex).
- Always confirm signals with additional context (market structure, higher timeframe).

Higher Timeframe Candle LevelsThis is an indicator that shows higher time frame candle levels from various preset timeframes. These higher time frame candles act as support and resistance levels, so look for reversals and continuations off of these levels. When price exceeds the high or low of these levels, you should look for breakouts in the same direction and trade with the trend.
It includes candle levels for the following timeframes: 1 hour, 4 hour, 1 day, 1 week, 1 month, 1 quarter and 1 year. The indicator also includes a trend candle coloring feature, trend strength scoring table, stop loss feature, line identification labels, alerts for trend changes, alerts for level touches and full customization of all options.
How To Trade With This Indicator
These higher timeframe candle levels will act as support and resistance levels, so look for price to react at any of the levels you have turned on and then look for potential bounce or reversal signs at those levels so you can trade those direction changes. Price outside of the higher timeframe candle highs and low typically signals a breakout as well, so look for price to continue after passing the highs or lows.
You can use the direction of the higher timeframe candles as your trend as well. Try to only trade in the direction of the trend of the higher timeframes to increase the likelihood of your trade going in your favor.
The highs and lows of daily and up levels are excellent levels to find quick reversal off of. Watch for price action to struggle to break through these levels and then trade the reversal. If price breaks through these levels easily, watch for price to retest the level and then continue beyond that level. Trade the retest in the direction of the trend.
The open, close and midline levels are excellent for trading bounces. Watch for price to form wicks beyond these levels and close on the other side and use that as a sign that price may bounce there. Use that with price action to confirm your trade and then take trades off of those level bounces.
Use the alerts for daily and up timeframe level touches across all of your favorite markets so that way you are always notified in real time when price is at a level that could provide a potential trading opportunity.
Higher Time Frame Candle Levels
The indicator shows the current candle open, previous open, previous high, previous low, previous close and previous candle body midline levels of each candle for each time frame. This helps you easily see what is going on with the higher time frame candles and read the price action from your lower time frame charts.
Each candle level will paint red if it was a down candle or green if it was an up candle, except the midlines and current candle open lines, those are a different color for easy differentiation. The line colors can be customized to your preferences in the settings and you can also toggle the candle body coloring on or off, as well as change the color of the candle body background.
Each timeframe can be adjusted to your preferences, allowing you to turn all of the levels on or off. You can also adjust how many previous candles show up on your chart so you can backtest it and see for yourself how accurate these levels are.
When adjusting the number of candles, you will get a notification if you have more than 500 lines turned on, so just turn down the number of levels for whatever timeframe you can’t see on your chart to lower that number below 500. The notification will go away once you are under 500 lines again. Each candle has 6 lines if all levels are turned on for that timeframe: open, current candle open, close, high, low and midline. The default settings keep you under 500 lines total, so just be aware of that limitation when adjusting those numbers and adjust the number of levels down on the timeframes that are not useful on the current chart bar.
You can also extend the levels right on any time frame from the daily levels and above. This is useful when price is breaking above or below all levels and you need to know if there are any other previous candle levels in the way as price moves away from the most recent higher time frame candles.
To understand the intraday trend of each higher time frame, look to see where price is at according to each higher time frame candle. If the price is above the midline of the candle, it is bullish. If the price is above the candle body it is more bullish. If the price is above the high, it is very bullish. If the price is below the midline of the candle, it is bearish. If the price is below the candle body it is more bearish. If the price is below the low, it is very bearish. Make sure you backtest this yourself and go through lots of historical data to get a feel for how price reacts to these levels and establishes the trend. Then use that trend information to your advantage and trade in the direction of the trend.
Since users are limited to a certain amount of historical bars based on which Tradingview plan you have, some longer timeframe levels won’t show up because the start of that candle is too far back in history. You will get a notification at the top of that chart if that happens. It will tell you to lower the display timeframe for that timeframe until that notification goes away, which means it was able to plot the most recent candle for that timeframe on your chart.
Trend Candle Coloring
The indicator includes a feature that paints the candles based on whether the current time frame candles are above or below the most recent midline, candle body or high & low of a higher time frame candle of your choice. This helps you see the overall trend of the higher timeframe so you can trade with the trend.
The candle coloring will have an up color, down color and neutral color which can all be customized to suit your preferences. If the current time frame candle close is above the setting you choose, it will show the up color. If the current time frame candle close is below the setting you choose, it will show the down color. If the current time frame candle close is equal to or in the middle of the setting you chose, it will show the neutral color.
So, for example if you set it to candle body, then it will show the up color if the current candle is above the top of the candle body, down color if it is below the bottom of the candle body and neutral color if it is inside the candle body. This helps you wait for price action to move beyond the inside of the previous higher time frame candle before taking a position when price is breaking out of that previous candle so you can trade the momentum of that move. The candle coloring is fully customizable, but make sure to turn off your candle coloring on other indicators and your chart settings for it to show up properly.
Trend Strength Scoring Table
The trend strength scoring table displays a table at the bottom of the screen(table position is customizable), showing a score for the trend strength of each higher time frame. If the current candle close is above the midline, its strength is 1. If the current candle close is above the midline, but below the top of the candle body, its strength is 2. If the current candle close is above the high, its strength is 3. The same goes for below the midline, bottom of the candle body and below the low, but the scores would be negative 1, 2 or 3 instead.
This trend strength table allows you to quickly identify the trend on each higher time frame so you can wait until the trend is the same across all time frames before placing a trade in the direction of the trend. It also shows a total score on the far right side that adds all of the current trend scores together to give you a total strength score. Try to only trade when that number is very high compared to how many time frames you have turned on. Each time frame can have up to a maximum score of 3 if bullish and -3 if bearish. Each time frame in the table can be turned on or off to suit your preferences.
Stop Loss Feature
There is also a stop loss feature that you can set to whatever time frame you choose and whatever direction you chose, such as long or short. It will follow the most recent higher time frame candle’s trend using one of the following settings: candle body, high & low or midline. Once a new higher time frame candle is created, the stop loss will update to the most recent candle’s levels so you can use these levels as a trailing stop loss to maximize your wins.
If you have it set to use the candle body and it is set to long mode, then the stop loss will use the previous higher time frame candle’s lowest candle body level. So if it was an up candle previously, it will use the open. If it was a down candle previously, it will use the close. The opposite is true for short positions.
The stop loss will start working once you turn it on in the settings and will update automatically as new higher time frame candles are formed. It also shows a line of where the stop loss was previously since it was turned on.
I recommend using the high & low setting, especially when the market starts trending.
Candle Level Identification Labels
There are labels for each level starting with the 4 hour time frame and above so you can easily tell what level of each candle you are looking at, even if the rest of the candle is not showing within the chart pane. You can customize the label coloring for up candles and down candles and midlines as well as adjust the number of bars that the labels are offset from the current bar so they are visible on your chart without overlapping the current price action or other indicator labels. Labels for each time frame can be turned on or off as needed. The 1 hour labels were not included because it clogs up the chart, but it has labels for all time frames from the 4 hour candles and up.
Alerts
The indicator includes alerts for when the trend has changed to the opposite direction. The trend change alert is based on your settings for the Trend Candle Coloring. Whatever settings you have the trend candle coloring set to, will be used to set up your alerts. The Trend Candle Coloring setting must be turned on as well when creating your alerts for it to work properly. Make sure to backtest your settings and then create your alerts.
It also has alerts for when price is touching an open or close, high or low, midline or any of those levels for each timeframe. This allows you to be notified when price touches one of these levels so you can check the chart and look for potential trade opportunities if price wants to bounce off of that level. To make it easy for you to get alerts on many different tickers, just use the alert for any level touch on whatever timeframes you want.
Other Indicators To Pair This With
Use this in combination with our Trend Strength Indicator so you can visually see the historic and current trend for all of these levels. You should also use our Breakout Scanner to find other markets with strong trends so you always know which market is trending the strongest and can trade those. Trend Strength Indicator, Higher Timeframe Candle Levels and the Breakout Scanner all use the same levels and calculate the trend scores the same way so they are designed to work together to help you quickly be able to read a chart and find what direction to trade in.

lower_tfLibrary "lower_tf"
█ OVERVIEW
This library is an enhanced (opinionated) version of the library originally developed by PineCoders contained in lower_tf .
It is a Pine Script® programming tool for advanced lower-timeframe selection and intra-bar analysis.
█ CONCEPTS
Lower Timeframe Analysis
Lower timeframe analysis refers to the analysis of price action and market microstructure using data from timeframes shorter than the current chart period. This technique allows traders and analysts to gain deeper insights into market dynamics, volume distribution, and the price movements occurring within each bar on the chart. In Pine Script®, the request.security_lower_tf() function allows this analysis by accessing intrabar data.
The library provides a comprehensive set of functions for accurate mapping of lower timeframes, dynamic precision control, and optimized historical coverage using request.security_lower_tf().
█ IMPROVEMENTS
The original library implemented ten precision levels. This enhanced version extends that to twelve levels, adding two ultra-high-precision options:
Coverage-Based Precision (Original 5 levels):
1. "Covering most chart bars (least precise)"
2. "Covering some chart bars (less precise)"
3. "Covering fewer chart bars (more precise)"
4. "Covering few chart bars (very precise)"
5. "Covering the least chart bars (most precise)"
Intrabar-Count-Based Precision (Expanded from 5 to 7 levels):
6. "~12 intrabars per chart bar"
7. "~24 intrabars per chart bar"
8. "~50 intrabars per chart bar"
9. "~100 intrabars per chart bar"
10. "~250 intrabars per chart bar"
11. "~500 intrabars per chart bar" ← NEW
12. "~1000 intrabars per chart bar" ← NEW
The key enhancements in this version include:
1. Extended Precision Range: Adds two ultra-high-precision levels (~500 and ~1000 intrabars) for advanced microstructure analysis requiring maximum granularity.
2. Market-Agnostic Implementation: Eliminates the distinction between crypto/forex and traditional markets, removing the mktFactor variable in favor of a unified, predictable approach across all asset classes.
3. Explicit Precision Mapping: Completely refactors the timeframe selection logic using native Pine Script® timeframe properties ( timeframe.isseconds , timeframe.isminutes , timeframe.isdaily , timeframe.isweekly , timeframe.ismonthly ) and explicit multiplier-based lookup tables. The original library used minute-based calculations with market-dependent conditionals that produced inconsistent results. This version provides deterministic, predictable mappings for every chart timeframe, ensuring consistent precision behavior regardless of asset type or market hours.
An example of the differences can be seen side-by-side in the chart below, where the original library is on the left and the enhanced version is on the right:
█ USAGE EXAMPLE
// This Pine Script® code is subject to the terms of the Mozilla Public License 2.0 at mozilla.org
// © andre_007
//@version=6
indicator("lower_tf Example")
import andre_007/lower_tf/1 as LTF
import PineCoders/Time/5 as PCtime
//#region ———————————————————— Example code
// ————— Constants
color WHITE = color.white
color GRAY = color.gray
string LTF1 = "Covering most chart bars (least precise)"
string LTF2 = "Covering some chart bars (less precise)"
string LTF3 = "Covering less chart bars (more precise)"
string LTF4 = "Covering few chart bars (very precise)"
string LTF5 = "Covering the least chart bars (most precise)"
string LTF6 = "~12 intrabars per chart bar"
string LTF7 = "~24 intrabars per chart bar"
string LTF8 = "~50 intrabars per chart bar"
string LTF9 = "~100 intrabars per chart bar"
string LTF10 = "~250 intrabars per chart bar"
string LTF11 = "~500 intrabars per chart bar"
string LTF12 = "~1000 intrabars per chart bar"
string TT_LTF = "This selection determines the approximate number of intrabars analyzed per chart bar. Higher numbers of
intrabars produce more granular data at the cost of less historical bar coverage, because the maximum number of
available intrabars is 200K.
\n\nThe first five options set the lower timeframe based on a specified relative level of chart bar coverage.
The last five options set the lower timeframe based on an approximate number of intrabars per chart bar."
string TAB_TXT = "Uses intrabars at the {0} timeframe.\nAvg intrabars per chart bar:
{1,number,#.#}\nChart bars covered: {2} of {3} ({4,number,#.##}%)"
string ERR_TXT = "No intrabar information exists at the {1}{0}{1} timeframe."
// ————— Inputs
string ltfModeInput = input.string(LTF3, "Intrabar precision", options = , tooltip = TT_LTF)
bool showInfoBoxInput = input.bool(true, "Show information box ")
string infoBoxSizeInput = input.string("normal", "Size ", inline = "01", options = )
string infoBoxYPosInput = input.string("bottom", "↕", inline = "01", options = )
string infoBoxXPosInput = input.string("right", "↔", inline = "01", options = )
color infoBoxColorInput = input.color(GRAY, "", inline = "01")
color infoBoxTxtColorInput = input.color(WHITE, "T", inline = "01")
// ————— Calculations
// @variable A "string" representing the lower timeframe for the data request.
// NOTE:
// This line is a good example where using `var` in the declaration can improve a script's performance.
// By using `var` here, the script calls `ltf()` only once, on the dataset's first bar, instead of redundantly
// evaluating unchanging strings on every bar. We only need one evaluation of this function because the selected
// timeframe does not change across bars in this script.
var string ltfString = LTF.ltf(ltfModeInput, LTF1, LTF2, LTF3, LTF4, LTF5, LTF6, LTF7, LTF8, LTF9, LTF10, LTF11, LTF12)
// @variable An array containing all intrabar `close` prices from the `ltfString` timeframe for the current chart bar.
array intrabarCloses = request.security_lower_tf(syminfo.tickerid, ltfString, close)
// Calculate the intrabar stats.
= LTF.ltfStats(intrabarCloses)
int chartBars = bar_index + 1
// ————— Visuals
// Plot the `avgIntrabars` and `intrabars` series in all display locations.
plot(avgIntrabars, "Average intrabars", color.silver, 6)
plot(intrabars, "Intrabars", color.blue, 2)
// Plot the `chartBarsCovered` and `chartBars` values in the Data Window and the script's status line.
plot(chartBarsCovered, "Chart bars covered", display = display.data_window + display.status_line)
plot(chartBars, "Chart bars total", display = display.data_window + display.status_line)
// Information box logic.
if showInfoBoxInput
// @variable A single-cell table that displays intrabar information.
var table infoBox = table.new(infoBoxYPosInput + "_" + infoBoxXPosInput, 1, 1)
// @variable The span of the `ltfString` timeframe formatted as a number of automatically selected time units.
string formattedLtf = PCtime.formattedNoOfPeriods(timeframe.in_seconds(ltfString) * 1000)
// @variable A "string" containing the formatted text to display in the `infoBox`.
string txt = str.format(
TAB_TXT, formattedLtf, avgIntrabars, chartBarsCovered, chartBars, chartBarsCovered / chartBars * 100, "'"
)
// Initialize the `infoBox` cell on the first bar.
if barstate.isfirst
table.cell(
infoBox, 0, 0, txt, text_color = infoBoxTxtColorInput, text_size = infoBoxSizeInput,
bgcolor = infoBoxColorInput
)
// Update the cell's text on the latest bar.
else if barstate.islast
table.cell_set_text(infoBox, 0, 0, txt)
// Raise a runtime error if no intrabar data is available.
if ta.cum(intrabars) == 0 and barstate.islast
runtime.error(str.format(ERR_TXT, ltfString, "'"))
//#endregion
█ EXPORTED FUNCTIONS
ltf(userSelection, choice1, choice2, ...)
Returns the optimal lower timeframe string based on user selection and current chart timeframe. Dynamically calculates precision to balance granularity with historical coverage within the 200K intrabar limit.
ltfStats(intrabarValues)
Analyzes an intrabar array returned by request.security_lower_tf() and returns statistics: number of intrabars in current bar, total chart bars covered, and average intrabars per bar.
█ CREDITS AND LICENSING
Original Concept : PineCoders Team
Original Lower TF Library :
License : Mozilla Public License 2.0

Advanced Psychological Levels with Dynamic Spacing═══════════════════════════════════════
ADVANCED PSYCHOLOGICAL LEVELS WITH DYNAMIC SPACING
═══════════════════════════════════════
A comprehensive psychological price level indicator that automatically identifies and displays round number levels across multiple timeframes. Features dynamic ATR-based spacing, smart crypto detection, distance tracking, and customizable alert system.
───────────────────────────────────────
WHAT THIS INDICATOR DOES
───────────────────────────────────────
This indicator automatically draws psychological price levels (round numbers) that often act as support and resistance:
- Dynamic ATR-Based Spacing - Adapts level spacing to market volatility
- Multiple Level Types - Major (250 pip), Standard (100 pip), Mid, and Intraday levels
- Smart Asset Detection - Automatically adjusts for Forex, Crypto, Indices, and CFDs
- Crypto Price Adaptation - Intelligent level spacing based on cryptocurrency price magnitude
- Distance Information Table - Real-time percentage distance to nearest levels
- Combined Level Labels - Clear identification when multiple level types coincide
- Performance Optimized - Configurable visible range and label limits
- Comprehensive Alerts - Notifications when price crosses any level type
───────────────────────────────────────
HOW IT WORKS
───────────────────────────────────────
PSYCHOLOGICAL LEVELS CONCEPT:
Psychological levels are round numbers where traders tend to place orders, creating natural support and resistance zones. These include:
- Forex: 1.0000, 1.0100, 1.0050 (pips)
- Crypto: $100, $1,000, $10,000 (whole numbers)
- Indices: 10,000, 10,500, 11,000 (points)
Why They Matter:
- Traders naturally gravitate to round numbers
- Stop losses cluster at these levels
- Take profit orders concentrate here
- Institutional algorithmic trading often targets these levels
DYNAMIC ATR-BASED SPACING:
Traditional Method:
- Fixed spacing regardless of volatility
- May be too tight in volatile markets
- May be too wide in quiet markets
Dynamic Method (Recommended):
- Uses ATR (Average True Range) to measure volatility
- Automatically adjusts level spacing
- Tighter levels in low volatility
- Wider levels in high volatility
Calculation:
1. Calculate ATR over specified period (default: 14)
2. Multiply by ATR multiplier (default: 2.0)
3. Round to nearest psychological level
4. Generate levels at dynamic intervals
Benefits:
- Adapts to market conditions
- More relevant levels in all volatility regimes
- Reduces clutter in trending markets
- Provides more detail in ranging markets
LEVEL TYPES:
Major Levels (250 pip/point):
- Highest significance
- Primary support/resistance zones
- Color: Red (default)
- Style: Solid lines
- Spacing: 2.5x standard step
Standard Levels (100 pip/point):
- Secondary importance
- Common psychological barriers
- Color: Blue (default)
- Style: Dashed lines
- Spacing: Standard step
Mid Levels (50% between major):
- Optional intermediate levels
- Halfway between major levels
- Color: Gray (default)
- Style: Dotted lines
- Usage: Additional confluence points
Intraday Levels (sub-100 pip):
- For intraday traders
- Fine-grained precision
- Color: Yellow (default)
- Style: Dotted lines
- Only shown on intraday timeframes
SMART ASSET DETECTION:
Forex Pairs:
- Detects major currency pairs automatically
- Uses pip-based calculations
- Standard: 100 pips (0.0100)
- Major: 250 pips (0.0250)
- Intraday: 20, 50, 80 pip subdivisions
Cryptocurrencies:
- Automatic price magnitude detection
- Adaptive spacing based on price:
* Under $0.10: Levels at $0.01, $0.05
* $0.10-$1: Levels at $0.10, $0.50
* $1-$10: Levels at $1, $5
* $10-$100: Levels at $10, $50
* $100-$1,000: Levels at $100, $500
* $1,000-$10,000: Levels at $1,000, $5,000
* Over $10,000: Levels at $5,000, $10,000
Indices & CFDs:
- Fixed point-based system
- Major: 500 point intervals (with 250 sub-levels)
- Standard: 100 point intervals
- Suitable for stock indices like SPX, NASDAQ
COMBINED LEVEL LABELS:
When multiple level types coincide at the same price:
- Single line drawn (highest priority color)
- Combined label shows all types
- Priority: Major > Standard > Mid > Intraday
Example Label Formats:
- "1.1000 Major" - Major level only
- "1.1000 Std + Major" - Both standard and major
- "50000 Intra + Mid + Std" - Three levels coincide
Benefits:
- Cleaner chart appearance
- Clear identification of confluence
- Reduced visual clutter
- Easy to spot high-importance levels
DISTANCE INFORMATION TABLE:
Real-time tracking of nearest levels:
Table Contents:
- Nearest major level above (price and % distance)
- Nearest standard level above (price and % distance)
- Nearest standard level below (price and % distance)
Display:
- Top right corner (configurable)
- Color-coded by level type
- Real-time percentage calculations
- Helpful for position management
Usage:
- Identify proximity to key levels
- Set realistic profit targets
- Gauge potential move magnitude
- Monitor approaching resistance/support
ALERT SYSTEM:
Comprehensive crossing alerts:
Alert Types:
- Major Level Crosses
- Standard Level Crosses
- Intraday Level Crosses
Alert Modes:
- First Cross Only: Alert once when level is crossed
- All Crosses: Alert every time level is crossed
Alert Information:
- Level type crossed
- Specific price level
- Direction (above/below)
- One alert per bar to prevent spam
Configuration:
- Enable/disable by level type
- Choose alert frequency
- Customize for your trading style
───────────────────────────────────────
HOW TO USE
───────────────────────────────────────
INITIAL SETUP:
General Settings:
1. Enable "Use Dynamic ATR-Based Spacing" (recommended)
2. Set ATR Period (14 is standard)
3. Adjust ATR Multiplier (2.0 is balanced)
Visibility Settings:
1. Set Visible Range % (10% recommended for clarity)
2. Adjust Label Offset for readability
3. Configure performance limits if needed
Level Selection:
1. Enable/disable level types based on trading style
2. Adjust line counts for each type
3. Choose line styles and colors for visibility
TRADING STRATEGIES:
Breakout Trading:
1. Wait for price to approach major or standard level
2. Monitor for consolidation near level
3. Enter on confirmed break above/beyond level
4. Stop loss just beyond the broken level
5. Target: Next major or standard level
Rejection Trading:
1. Identify major psychological level
2. Wait for price to test the level
3. Look for rejection signals (wicks, bearish/bullish candles)
4. Enter in direction of rejection
5. Stop beyond the level
6. Target: Previous level or mid-level
Range Trading:
1. Identify range between two major levels
2. Buy at lower psychological level
3. Sell at upper psychological level
4. Use standard and mid-levels for position management
5. Exit if major level breaks with volume
Confluence Trading:
1. Look for combined levels (Std + Major)
2. These represent high-probability zones
3. Use as primary support/resistance
4. Increase position size at confluence
5. Expect stronger reactions at these levels
Session-Based Trading:
1. Note opening level at session start (Asian/London/NY)
2. Trade breakouts of major levels during high-volume sessions
3. London/NY sessions: More likely to break levels
4. Asian session: More likely to respect levels (range trading)
RISK MANAGEMENT WITH PSYCHOLOGICAL LEVELS:
Stop Loss Placement:
- Place stops just beyond psychological levels
- Add buffer (5-10 pips for forex)
- Avoid exact round numbers (stop hunting risk)
- Use previous major level as maximum stop
Take Profit Strategy:
- First target: Next standard level (partial profit)
- Second target: Next major level (remaining position)
- Trail stops to breakeven at first target
- Use distance table to calculate risk/reward
Position Sizing:
- Larger positions at major levels (higher probability)
- Smaller positions at intraday levels (lower probability)
- Scale in at standard levels between major levels
- Reduce size when multiple levels are close together
TIMEFRAME CONSIDERATIONS:
Higher Timeframes (4H, Daily, Weekly):
- Focus on Major and Standard levels only
- Disable Intraday and Mid levels
- Wider level spacing expected
- Use for swing trading and position trading
Lower Timeframes (5m, 15m, 1H):
- Enable all level types
- Use Intraday levels for precision
- Tighter level spacing acceptable
- Good for day trading and scalping
Multi-Timeframe Approach:
- Identify major levels on Daily/4H charts
- Refine entries using 15m/1H intraday levels
- Trade in direction of higher timeframe bias
- Use lower timeframe levels for position management
───────────────────────────────────────
CONFIGURATION GUIDE
───────────────────────────────────────
GENERAL SETTINGS:
Dynamic ATR-Based Spacing:
- Enabled: Recommended for most markets
- Disabled: Fixed psychological levels
- ATR Period: 14 (standard), 10 (responsive), 20 (smooth)
- ATR Multiplier: 1.0-5.0 (2.0 is balanced)
VISIBILITY SETTINGS:
Visible Range %:
- 5%: Very tight range, minimal clutter
- 10%: Balanced view (recommended)
- 20%: Wide range, more context
- 50%: Maximum range, all levels visible
Label Offset:
- 10-20 bars: Close to current price
- 30-50 bars: Moderate distance
- 50-100 bars: Far from price action
Performance Limits:
- Max Historical Bars: Reduce if indicator loads slowly
- Max Labels: Reduce for cleaner chart (20-30 recommended)
LEVEL CUSTOMIZATION:
Line Count:
- Lower (1-3): Cleaner chart, fewer levels
- Medium (4-6): Balanced view
- Higher (7-10): More context, busier chart
Line Styles:
- Solid: High importance, easy to see
- Dashed: Medium importance, clear but subtle
- Dotted: Low importance, minimal visual weight
Colors:
- Use contrasting colors for different level types
- Red/Blue/Yellow default works well
- Adjust based on chart background and personal preference
DISTANCE TABLE:
Position:
- Top Right: Doesn't interfere with price action
- Top Left: Good for right-side price scale
- Bottom positions: Less common but available
Colors:
- Default (white text, dark background) works for most charts
- Match your chart theme for consistency
- Ensure text is readable against background
ALERT CONFIGURATION:
Alert by Level Type:
- Major: Most important, fewer false signals
- Standard: Balance of frequency and importance
- Intraday: Many signals, best for active traders
Alert Frequency:
- First Cross Only: Cleaner, less noise (recommended for swing trading)
- All Crosses: Every touch, good for scalping
Alert Setup in TradingView:
1. Configure desired alert types in indicator settings
2. Right-click chart → Add Alert
3. Select this indicator
4. Choose "Any alert() function call"
5. Set delivery method (mobile, email, webhook)
───────────────────────────────────────
ASSET-SPECIFIC TIPS
───────────────────────────────────────
FOREX (EUR/USD, GBP/USD, etc.):
- Major levels at x.x000, x.x500
- Standard levels at x.xx00
- Intraday levels at 20/50/80 pips
- Most effective during London/NY sessions
- Watch for "figure" levels (1.0000, 1.1000)
CRYPTOCURRENCIES (BTC, ETH, etc.):
- Enable dynamic spacing for volatile markets
- Levels adjust automatically based on price
- Watch major $1,000 increments for BTC
- $100 levels important for ETH
- Smaller caps: Use standard levels
- High volatility: Increase ATR multiplier to 3.0
STOCK INDICES (SPX, NASDAQ, etc.):
- 100-point levels most important
- 500-point levels for major S/R
- 50-point mid-levels for refinement
- Watch end-of-day for level reactions
- Futures often lead spot on level breaks
GOLD/COMMODITIES:
- Major levels at $50 increments ($1,900, $1,950)
- Standard levels at $10 increments
- Very reactive to psychological levels
- Watch for false breaks during low volume
- Best reactions during active trading hours
───────────────────────────────────────
BEST PRACTICES
───────────────────────────────────────
Chart Setup:
- Use clean price action charts
- Avoid too many indicators
- Ensure psychological levels are clearly visible
- Match colors to your chart theme
Level Selection:
- Start with Major and Standard levels only
- Add Mid and Intraday as needed
- Less is more - avoid chart clutter
- Adjust based on timeframe
Combining with Other Tools:
- Volume profile for confluence
- Trendlines intersecting psychological levels
- Moving averages near round numbers
- Fibonacci levels coinciding with psychological levels
Common Mistakes to Avoid:
- Trading every level touch (be selective)
- Ignoring volume confirmation
- Setting stops exactly at levels (stop hunting)
- Forgetting to adjust for different assets
- Over-relying on levels without price action confirmation
Performance Optimization:
- Reduce visible range for faster loading
- Lower max historical bars on lower timeframes
- Limit labels to 30-50 for clarity
- Disable unused level types
───────────────────────────────────────
EDUCATIONAL DISCLAIMER
───────────────────────────────────────
This indicator identifies psychological price levels based on round numbers that tend to act as support and resistance. The methodology includes:
- Round number detection algorithms
- ATR-based dynamic spacing calculations
- Asset-specific level determination
- Distance percentage calculations
Psychological levels are a recognized concept in technical analysis, studied by traders and institutions. However, they do not guarantee price reactions and should be used as part of a comprehensive trading strategy including proper risk management, volume analysis, and price action confirmation.
───────────────────────────────────────
USAGE DISCLAIMER
───────────────────────────────────────
This tool is for educational and analytical purposes. Psychological levels can act as support or resistance but price reactions are not guaranteed. Dynamic spacing may generate different levels in different market conditions. Always conduct independent analysis, use proper risk management, and never risk capital you cannot afford to lose. Past performance does not indicate future results.
───────────────────────────────────────
CREDITS & ATTRIBUTION
───────────────────────────────────────
Original Concept: Sonar Lab
