TrendMaster V2TrendMaster V2 is a comprehensive Pine Script indicator designed for TradingView. It combines multiple technical indicators and an advanced scoring logic to provide actionable trading signals. The script is highly customizable, allowing users to adjust trading modes, color themes, and signal filters according to their preferences and risk tolerance.
Key Features
Composite Scoring System:
The script calculates a composite score based on trend, momentum, pattern recognition, volume, volatility, divergence, Pearson correlation, and the CCI index. This score helps identify the best buy or sell opportunities.
Customizable Parameters:
Users can choose between “Aggressive,” “Balanced,” or “Conservative” trading modes, adjust indicator periods, and customize the color scheme of all visual elements.
Confluence Analysis:
The script evaluates the number of matching bullish or bearish signals, providing a confluence summary for higher-confidence trades.
Visual Signals:
Clear visual cues (triangles, circles, crosses) are displayed on the chart for strong buy/sell signals, confluences, and divergences.
Information Panels:
Two panels display real-time data such as score, RSI, volume, volatility, Pearson, CCI, trend, signal, and mode, along with the confluence status for quick reference.
Alert Conditions:
The script supports alerts for strong buy/sell signals, confluences, and divergences.
How It Works
Main Configuration:
Users select a trading mode (Aggressive, Balanced, or Conservative) and a color theme (Dark or Light).
Custom colors can also be set for bullish, bearish, strong, neutral, and signal elements.
Technical Indicators
Moving Averages (SMA/EMA) for trend analysis.
RSI to assess momentum and overbought/oversold conditions.
MACD for trend confirmation.
Volume and Volatility (ATR) for market activity evaluation.
Advanced Indicators
Pearson Correlation to measure trend strength.
CCI for cyclic momentum analysis.
Pattern Recognition
The script identifies common bullish and bearish reversal patterns (e.g., engulfing, hammer, morning/evening star) and continuation patterns (e.g., three white soldiers/black crows).
Composite Score
Each indicator contributes to a composite score, weighted according to the selected trading mode.
The score determines the strength of buy/sell signals.
Confluence Analysis
The script counts the number of matching bullish or bearish signals, providing a confluence summary for higher-confidence trades.
Visual Signals and Alerts
Strong buy/sell signals: triangles
Confluence signals: circles
Divergences: crosses
Alerts are triggered for strong buy/sell signals, confluences, and divergences.
Usage Instructions
Add the script to your TradingView chart.
Adjust the settings in the configuration panel to match your trading style.
Monitor the information panels and visual signals to spot trading opportunities.
Set up alerts for your preferred signal types.
Pesquisar nos scripts por "纳斯达克期货cfd"

FVG Session Break Strategy with ATR RR🧠 FVG Session Break Strategy with ATR RR — Timezone-Aware, Session-Savvy, and Risk-Calibrated
This strategy captures high-probability reversals and continuations by combining Fair Value Gap (FVG) imbalances with session-based breakout logic and ATR-calibrated risk management. It’s designed for traders who want to exploit structural inefficiencies during key market sessions — with precision and portability across global exchanges.
🔍 Core Logic:
Fair Value Gap Detection: Identifies bullish and bearish FVGs using a 3-bar displacement pattern.
Session Breakout Engine: Tracks session highs and lows (Asian, London, NY) and triggers trades only when price breaks these levels — ensuring trades occur at meaningful inflection points.
ATR-Based RR Control: Dynamically sizes stop-loss and take-profit levels using ATR × multiplier, maintaining consistent risk across volatility regimes.
🌐 Timezone-Aware Session Logic:
Session boundaries are defined in UTC-5 (e.g., NY: 0930–1600) but automatically converted to the exchange’s local timezone using timestamp("Etc/GMT+5", ...). This ensures:
Accurate session detection across all markets and assets
No manual timezone adjustments needed
Robust performance on crypto, forex, and global equities
📈 Visuals:
Session highs and lows plotted in orange
Bullish and bearish FVGs marked with green and red triangles
Strategy entries and exits shown on chart with full RR logic
This strategy is ideal for traders who want to combine structural edge with session context and disciplined risk.

Smart VWAP FVG SystemSmart VWAP FVG System - Professional Multi-Filter Trading Indicator
📊 OVERVIEW
The Smart VWAP FVG System is an advanced multi-layered trading indicator that combines institutional volume analysis, multi-timeframe VWAP trend confirmation, and Fair Value Gap detection to identify high-probability trade entries. This indicator uses a sophisticated filtering mechanism where signals appear only when multiple independent confirmation criteria align simultaneously.
Recommended Timeframe: 5-minute (M5) or higher. The indicator works best on M5, M15, and M30 charts for intraday trading.
🎯 ORIGINALITY & PURPOSE
This indicator is original because it combines three distinct analytical methods into a unified decision-making system:
Market Profile Volume Analysis - Identifies institutional accumulation/distribution zones
Dual VWAP Filtering - Confirms trend direction using two independent VWAP calculations
Fair Value Gap Detection - Validates institutional interest through price inefficiency zones
The key innovation is the directional filter system: the primary Market Profile generates BUY-ONLY or SELL-ONLY states based on higher timeframe value area reversals, which then controls which signals from the main system are displayed. This creates a multi-timeframe confluence that significantly reduces false signals.
Unlike simple indicator mashups, each component serves a specific purpose:
Market Profile → Direction bias (trend filter)
Primary VWAP (Session) → Short-term trend confirmation
Secondary VWAP (Week) → Medium-term trend confirmation
FVG Detection → Institutional activity validation
🔧 HOW IT WORKS
1. Primary Market Profile Filter (Higher Timeframe)
The indicator calculates Market Profile on a higher timeframe (default: 1 hour) to determine the overall market structure:
Value Area High (VAH): Top 70% of volume distribution
Value Area Low (VAL): Bottom 70% of volume distribution
Point of Control (POC): Price level with highest volume
When price reaches VAH and reverses down → SELL-ONLY mode activated
When price reaches VAL and reverses up → BUY-ONLY mode activated
This higher timeframe filter ensures you're trading in the direction of institutional flow.
2. Dual VWAP System
Two independent VWAP calculations provide multi-timeframe trend confirmation:
Primary VWAP (Session-based): Resets daily, tracks intraday momentum
Secondary VWAP (Week-based): Resets weekly, confirms longer-term trend
Filter Logic:
BUY signals require: Price > Primary VWAP AND Price > Secondary VWAP
SELL signals require: Price < Primary VWAP AND Price < Secondary VWAP
This dual confirmation prevents counter-trend trades during ranging conditions.
3. Fair Value Gap (FVG) Detection
FVG zones identify price inefficiencies where institutional orders were executed rapidly:
Bullish FVG: Gap between candle .high and candle .low (upward imbalance)
Bearish FVG: Gap between candle .high and candle .low (downward imbalance)
The indicator monitors recent FVG formation (lookback: 50 bars) and requires:
Bullish FVG present for BUY signals
Bearish FVG present for SELL signals
FVG zones are displayed as colored boxes and automatically marked as "mitigated" when price fills the gap.
4. Main Trading Signal Logic
The secondary Market Profile (default: 1 hour) generates the actual trading signals:
BUY Signal Conditions:
Price reaches Value Area Low
Reversal pattern confirmed (minimum 1 bar)
Price > Primary VWAP
Price > Secondary VWAP (if filter enabled)
Recent Bullish FVG detected (if filter enabled)
Primary MP Filter = BUY-ONLY or NEUTRAL
SELL Signal Conditions:
Price reaches Value Area High
Reversal pattern confirmed (minimum 1 bar)
Price < Primary VWAP
Price < Secondary VWAP (if filter enabled)
Recent Bearish FVG detected (if filter enabled)
Primary MP Filter = SELL-ONLY or NEUTRAL
All conditions must be TRUE simultaneously for a signal to appear.
📈 VISUAL ELEMENTS
On Chart:
🟢 Green Triangle (▲) = BUY Signal
🔴 Red Triangle (▼) = SELL Signal
🟦 Blue horizontal lines = Value Area zones
🟡 Yellow line = Point of Control (POC)
🟩 Green boxes = Bullish FVG zones
🟥 Red boxes = Bearish FVG zones
🔵 Blue line = Primary VWAP (Session)
⚪ White line = Secondary VWAP (Week)
Info Panel (Top Right):
Real-time status display showing:
Filter Direction (BUY ONLY / SELL ONLY / NEUTRAL)
Active timeframes for both MP filters
FVG filter status and count
VWAP positions (ABOVE/BELOW)
Signal enablement status
Alert status
⚙️ KEY SETTINGS
MP/TPO Filter Settings (Primary Indicator)
MP Filter Time Frame: 60 minutes (controls directional bias)
Filter Value Area %: 70% (standard Market Profile calculation)
Filter Alert Distance: 1 bar
Filter Min Bars for Reversal: 1 bar
Filter Alert Zone Margin: 0.01 (1%)
FVG Filter Settings
Use FVG Filter: Enabled (toggle on/off)
FVG Timeframe: 60 minutes (1 hour)
FVG Filter Mode: Both (require bullish FVG for BUY, bearish for SELL)
FVG Lookback Period: 50 bars (how far back to search)
Show FVG Formation Signals: Optional visual markers
Max FVG on Chart: 50 zones
Show Mitigated FVG: Display filled gaps
Market Profile Settings
Higher Time Frame: 60 minutes (for main signals)
Percent for Value Area: 70%
Show POC Line: Enabled
Keep Old MPs: Enabled (maintain historical profiles)
Primary VWAP Filter
Use Primary VWAP Filter: Enabled
Primary VWAP Anchor Period: Session (resets daily)
Primary VWAP Source: HLC3 (typical price)
Secondary VWAP Filter
Use Secondary VWAP Filter: Enabled
Secondary VWAP Anchor Period: Week (resets weekly)
Secondary VWAP Filter Mode: Both
Secondary VWAP Line Color: White
Trading Signals
Show Trading Signals on Chart: Enabled
Show SELL Signals: Enabled
Show BUY Signals: Enabled
Alert Distance: 1 bar
Min Bars for Reversal: 1 bar
Alert Zone Margin: 0.01 (1%)
Retest Search Period: 20 bars
Min Bars Between Retests: 5 bars
Show Only Retests: Disabled
Alert Settings
Enable Trading Notifications: Enabled
VAH Reversal Alert: Enabled (SELL signals)
VAL Reversal Alert: Enabled (BUY signals)
Time Filter Settings
Filter Alerts By Time: Optional (exclude specific hours)
⚠️ IMPORTANT WARNINGS & LIMITATIONS
1. Repainting Behavior
CRITICAL: This indicator uses lookahead=barmerge.lookahead_on to access higher timeframe data immediately for FVG detection. This is necessary to provide real-time FVG zone visualization but has the following implications:
FVG zones may shift slightly until the higher timeframe candle closes
FVG detection signals are preliminary until HTF bar confirmation
The main trading signals (triangles) appear on confirmed bars and do not repaint
Best Practice: Always wait for the current timeframe bar to close before acting on signals. The filter status and FVG zones are informational but may adjust as new data arrives.
2. Minimum Timeframe
Do NOT use on timeframes below 5 minutes (M5)
Recommended: M5, M15, M30 for intraday trading
Higher timeframes (H1, H4) can also be used but will generate fewer signals
3. Multiple Filters Can Block Signals
By design, this indicator is conservative. When all filters are enabled:
Signals appear ONLY when all conditions align
You may see extended periods with no signals
This is intentional to reduce false positives
If you see no signals:
Check the Info Panel to see which filters are failing
Consider adjusting FVG lookback period
Temporarily disable FVG filter to test
Verify VWAP filters match current market trend
4. Market Profile Limitations
Market Profile requires sufficient volume data
Low-volume instruments may produce unreliable profiles
Value Areas update only on higher timeframe bar close
Works best on liquid markets (major forex pairs, indices, crypto)
📖 HOW TO USE
Step 1: Add to Chart
Apply indicator to M5 or higher timeframe chart
Ensure chart shows volume data
Use standard candles (NOT Heikin Ashi, Renko, etc.)
Step 2: Configure Settings
Primary MP Filter TF: Set to 60 (1 hour) minimum, or 240 (4 hour) for swing trading
Main MP TF: Set to 60 (1 hour) for intraday signals
FVG Timeframe: Match or exceed main MP timeframe
Leave other settings at default initially
Step 3: Understand the Info Panel
Monitor the top-right panel:
FILTER STATUS: Shows current directional bias
NEUTRAL = Both signals allowed
BUY ONLY = Only green triangles will appear
SELL ONLY = Only red triangles will appear
FVG Filter: Shows if bullish/bearish gaps detected recently
VWAP positions: Confirms trend alignment
Step 4: Take Signals
For BUY Signal (Green Triangle ▲):
Wait for green triangle to appear
Check Info Panel shows ✓ for BUY signals
Confirm current bar has closed
Enter long position
Stop loss: Below recent VAL or swing low
Target: Previous Value Area High or 1.5-2× risk
For SELL Signal (Red Triangle ▼):
Wait for red triangle to appear
Check Info Panel shows ✓ for SELL signals
Confirm current bar has closed
Enter short position
Stop loss: Above recent VAH or swing high
Target: Previous Value Area Low or 1.5-2× risk
Step 5: Risk Management
Risk per trade: Maximum 1-2% of account equity
Position sizing: Adjust based on stop loss distance
Avoid trading: During major news events or time filter periods
Multiple confirmations: Look for confluence with price action (support/resistance, trendlines)
🎓 UNDERLYING CONCEPTS
Market Profile Theory
Developed by J. Peter Steidlmayer in the 1980s, Market Profile organizes price and volume data to identify:
Value Areas: Where 70% of trading activity occurred
POC: Price level with highest acceptance (most volume)
Imbalances: When price moves away from value quickly
This indicator uses TPO (Time Price Opportunity) calculation method to build the volume profile distribution.
VWAP (Volume Weighted Average Price)
VWAP represents the average price weighted by volume, showing where institutional traders are positioned:
Price above VWAP = Bullish (institutions accumulated lower)
Price below VWAP = Bearish (institutions distributed higher)
Using dual VWAP (Session + Week) creates multi-timeframe trend alignment.
Fair Value Gaps (FVG)
Also known as "imbalance" or "inefficiency," FVG occurs when:
Price moves so rapidly that a gap forms in the candlestick structure
Indicates institutional order flow (large market orders)
Price often returns to "fill" these gaps (rebalance)
The 3-candle FVG pattern (gap between candle and candle ) is widely used in ICT (Inner Circle Trader) methodology and Smart Money Concepts.
🔍 CREDITS & CODE ATTRIBUTION
This indicator builds upon established technical analysis concepts and combines multiple methodologies:
1. Market Profile / TPO Calculation
Concept Origin: J. Peter Steidlmayer (Chicago Board of Trade, 1980s)
Code Inspiration: TradingView's public domain Market Profile examples
Modifications: Custom filtering logic for directional bias, dual timeframe implementation
2. VWAP Calculation
Concept Origin: Standard financial instrument (widely used since 1980s)
Code Base: TradingView built-in ta.vwap() function (public domain)
Modifications: Dual VWAP system with independent anchor periods, custom filtering modes
3. Fair Value Gap Detection
Concept Origin: Inner Circle Trader (ICT) / Smart Money Concepts methodology
Code Implementation: Original implementation based on 3-candle gap pattern
Features: Multi-timeframe detection, automatic mitigation tracking, visual zone display
4. Pine Script Framework
Language: Pine Script v6 (TradingView)
Built-in Functions Used:
ta.vwap() - Volume weighted average price
request.security() - Higher timeframe data access
ta.change() - Period detection
ta.cum() - Cumulative volume
time() - Timestamp functions
Note: All code is original implementation. While concepts are based on established trading methodologies, the combination, filtering logic, and execution are unique to this indicator.
📊 RECOMMENDED INSTRUMENTS
Best Performance:
Major Forex Pairs (EURUSD, GBPUSD, USDJPY)
Stock Indices (ES, NQ, SPX, DAX)
Major Cryptocurrencies (BTCUSD, ETHUSD)
Liquid Stocks (high daily volume)
Avoid:
Low-volume altcoins
Illiquid stocks
Exotic forex pairs with wide spreads
⚡ PERFORMANCE TIPS
Start Conservative: Enable all filters initially
Reduce Filters Gradually: If too few signals, disable Secondary VWAP filter first
Match Timeframes: Keep MP Filter TF and FVG TF at same value
Backtest First: Review historical performance on your preferred instrument/timeframe
Combine with Price Action: Look for support/resistance confluence
Use Time Filter: Avoid low-liquidity hours (optional setting)
🚫 WHAT THIS INDICATOR DOES NOT DO
Does not guarantee profits - No trading system is 100% accurate
Does not predict the future - Based on historical patterns
Does not replace risk management - Always use stop losses
Does not work on all instruments - Requires volume data and liquidity
Does not provide exact entry/exit prices - Signals are zones, not precise levels
Does not account for fundamentals - Purely technical analysis
📜 DISCLAIMER
This indicator is provided for educational and informational purposes only. It is not financial advice, and past performance does not guarantee future results.
Trading Risk Warning:
All trading involves risk of loss
You can lose more than your initial investment (leverage products)
Only trade with capital you can afford to lose
Always use appropriate position sizing and risk management
Consider seeking advice from a licensed financial advisor
Technical Limitations:
Indicator may repaint FVG zones until HTF bar closes
Signals are based on historical patterns that may not repeat
Market conditions change and no system works in all environments
Volume data quality varies by exchange/broker
By using this indicator, you acknowledge these risks and agree that the author bears no responsibility for trading losses.
📞 SUPPORT & UPDATES
Questions? Comment on this publication
Issues? Describe the problem with chart screenshot
Feature Requests? Suggest improvements in comments
Updates: Will be published as new versions using TradingView's update feature
📝 VERSION HISTORY
Version 1.0 (Current)
Initial public release
Multi-filter system: MP + Dual VWAP + FVG
Directional bias filter
Real-time info panel
Comprehensive alert system
Time-based filtering
Thank you for using Smart VWAP FVG System!
Happy Trading! 📈

RSI MTF Table - 12 Pairs (1,5,15)
The relative strength index measures the speed and magnitude of an asset's recent price changes. Therefore, it is considered a momentum indicator in technical analysis. Essentially, the RSI is the ratio of the days an asset's value increases to decreases over a given period.
Generally speaking, if the RSI is around 50, we do not expect strong movements. RSI above 65 or below 35 are areas we expect. In this context, this chart and the general momentum in 1-5-15 minutes allow us to quickly determine the parity we will trade. It is useful for intraday trading and scalping.

Order Block Zones (Multi, Retest Highlight & Invalidation)A easy OB identificator with the conditon that it should be followed with at-least three strong/weak candles. Highlighted when re-tested (search for entry) and unvalidated once the "opposite" candle closes above/under the zone. Zones valid for 5 days then deleted.
V0.1

Hedge Simulation Martingale v1
1. Overview & Strategy Logic
This script implements an automated, multi-position trading strategy that uses a Martingale-inspired approach to manage a series of entries. The core logic is as follows:
Initial Entry: The script enters a trade based on the direction of the previous bar's close. A green bar triggers a Long position; a red bar triggers a Short position.
Profit-Taking: A single, fixed-percentage profit target (Profit Percentage) is set for the entire trade. If reached, all positions are closed for a net profit.
Loss Management (Martingale Logic): If the price moves against the initial position and hits the fixed-percentage stop-loss (Loss Percentage), the script does not exit. Instead, it averages down by adding a new, larger position in the same direction. The size of the new position is determined by multiplying the previous position size by the First Multiplier.
Net Position Management: The script continuously calculates the net average entry price, a new combined profit target, and a new combined stop-loss based on all open positions. The goal is for a single favorable price move to recover all previous losses and hit the profit target.
2. Key Features
Visual Indicators:
Plots the Net Average Entry Price on the chart.
Plots dynamic Profit Target (TP) and Stop-Loss (SL) levels that update as new positions are added.
Displays entry signals (triangles) for the initial Long or Short trade.
Comprehensive Dashboard: A detailed table in the top-right corner shows real-time metrics, including:
Total historical Long/Short volume and PnL.
Current trade's investment, unrealized PnL, and position sizes.
Current position count, direction, and size.
Configurable Parameters:
Profit Percentage: The target profit percentage for the net position.
Loss Percentage: The stop-loss percentage that triggers a new entry.
Initial Position Size: The size of the first position in the series.
First Multiplier: The multiplier applied to the previous position size when averaging down.
Maximum Multiplier: A safety cap (commented out in the code but present) to prevent infinite scaling.
3. Intended Use & Purpose
This script is designed as a position management and tracking tool for traders who are experimenting with or actively using Martingale-style strategies. It is best used to:
Automate the complex calculations of average entry, combined TP/SL, and PnL for multiple entries.
Visually track the status of an ongoing series of positions.
Backtest the viability and risks of such a strategy on historical data.
4. ⚠️ Critical Risk Warning & Disclaimer
THIS STRATEGY CARRIES EXTREME FINANCIAL RISK. USE AT YOUR OWN RISK.
Unlimited Loss Potential: The Martingale strategy is infamous for its potential to generate unlimited losses. By continuously doubling down (or multiplying) on losing positions, a small adverse price move can lead to catastrophic losses that can exceed your account balance.
Margin Calls: The rapidly increasing position size can quickly deplete your margin, leading to a margin call and forced liquidation of all positions at a significant loss.
No Guarantee of Recovery: The assumption that the price will eventually reverse is flawed. A strong, sustained trend can wipe out the entire trading capital.
For Educational/Advanced Use Only: This script is intended for sophisticated traders who fully understand the immense risks involved. It is not a "sure profit" system.
The publisher of this script is not responsible for any financial losses incurred through its use. You are solely responsible for your trading decisions and risk management.
5. How to Use
Apply the Script: Add the script to your chart.
Configure Parameters: Adjust the input parameters according to your risk tolerance and strategy rules. Be extremely cautious with the multiplier and position size.
Monitor the Dashboard: The table will provide all necessary information about the current and historical state of the strategy.
Observe the Levels: Watch the plotted Entry, TP, and SL levels to understand the current market position.
Backtest First: Always test the strategy extensively on historical data before considering it with real capital.
6. Notes
The Maximum Multiplier safety feature is present in the code but is currently commented out. Users are strongly advised to uncomment and set this parameter to act as a final, hard liquidation point.
The script logs key events (trade start, target hit) and export data for further analysis.
This is a complex script and should be thoroughly understood before use.

SuperTrend Dual RMAOverview
The SuperTrend Dual RMA is a hybrid volatility-based trend-following system that merges two Relative Moving Averages (RMAs) with an Average True Range (ATR)–anchored SuperTrend framework. The primary purpose of this indicator is to offer a smoother and more reliable depiction of directional bias while maintaining sensitivity to price volatility and market volume.
Traditional SuperTrend implementations typically rely on a single moving average and a fixed volatility envelope. This dual RMA structure introduces an adaptive central tendency line that reacts proportionally to both price and volume, allowing for more nuanced identification of trend reversals and continuation patterns.
**Core Concept**
The indicator is built around two key principles — smoothing and volatility adaptation.
1. **Smoothing:** The use of two separate RMAs with configurable lengths creates a dynamic equilibrium between short-term responsiveness and long-term stability. The first RMA captures near-term directional shifts, while the second provides broader market context. The average of both becomes the foundation of the SuperTrend bands.
2. **Volatility Adaptation:** The ATR multiplier and period define the distance between upper and lower bands relative to recent volatility. This ensures that the SuperTrend line remains flexible across varying market conditions — expanding during high volatility and contracting during calm phases.
**Calculation Steps**
* The indicator first computes two volume-weighted RMAs based on the typical price (`hlc3`) multiplied by trading volume.
* Each RMA is normalized by the smoothed volume to maintain proportional weighting.
* These two RMAs are averaged to produce a “basis line” that reflects the current market consensus price.
* The ATR is calculated over a user-defined period, then multiplied by a volatility factor (ATR multiplier).
* The resulting ATR value defines dynamic upper and lower thresholds around the basis line.
* Trend direction is determined by price closing behavior relative to these thresholds:
* When the closing price exceeds the upper band, the trend is considered bullish.
* When it drops below the lower band, the trend turns bearish.
* If price remains within the bands, the prior trend direction is maintained for consistency.
**Visual Structure**
The SuperTrend Dual RMA provides multiple layers of visual feedback for enhanced interpretation:
* Two distinct RMA lines (short and long) are plotted with complementary colors for contrast and clarity.
* A soft fill between the RMA lines highlights the interaction between short- and medium-term momentum.
* The ATR-based SuperTrend bands are drawn above and below the basis, with adaptive coloring that corresponds to the prevailing trend direction.
* Bar colors automatically adjust to reflect bullish or bearish bias, making it easy to identify trend shifts without relying solely on crossovers.
* Optional triangle markers appear below or above bars to signal potential buy or sell opportunities based on crossover logic.
**Signals and Alerts**
The indicator provides real-time crossover detection:
* **Buy Signal:** Triggered when the closing price moves above the SuperTrend line, confirming potential bullish continuation or reversal.
* **Sell Signal:** Triggered when the closing price drops below the SuperTrend line, indicating possible bearish momentum or reversal.
Both conditions have built-in `alertcondition()` functions, allowing users to set automated alerts for trading or monitoring purposes. This enables integration with TradingView’s alert system for push notifications, emails, or webhook connections.
**Usage Guidelines**
* **Trend Identification:** Use the color-coded trend line and bar color as a visual guide to the current directional bias.
* **Entry and Exit Timing:** Consider entering trades when a new crossover alert appears, preferably in the direction of the overall higher-timeframe trend.
* **Parameter Tuning:** Adjust the RMA lengths and ATR parameters based on asset volatility. Shorter RMA and ATR settings provide faster reactions, suitable for intraday or high-frequency trading, while longer configurations better fit swing or position strategies.
* **Risk Management:** Because the SuperTrend inherently acts as a dynamic stop level, traders can use the opposite band or SuperTrend line as a trailing stop or exit signal.
**Practical Applications**
* Trend confirmation in multi-timeframe strategies.
* Adaptive trailing stop placement using the lower or upper band.
* Visual comparison of volume-weighted price movement against volatility envelopes.
* Integration into algorithmic trading systems as a signal filter or trend bias component.
* Identification of overextended conditions when price significantly diverges from the SuperTrend basis.
**Originality and Advantages**
The SuperTrend Dual RMA differentiates itself from conventional SuperTrend scripts through three innovative design choices:
1. **Dual Volume-Weighted RMAs:** By incorporating two RMAs weighted by trading volume, the indicator accounts for liquidity dynamics, producing smoother and more reliable averages compared to price-only calculations.
2. **Anchored SuperTrend Framework:** The SuperTrend bands are not derived from a fixed source (such as a single close or median price) but from a blended RMA basis, making them more adaptable to varying market behaviors.
3. **Integrated Multi-Layer Visualization:** The inclusion of filled regions between RMAs, dynamic band coloring, and bar tinting enhances readability and analytical depth without overwhelming the chart.
These improvements collectively create a more balanced and data-rich representation of market structure, offering a higher degree of analytical precision. It’s suitable for traders seeking both discretionary and systematic use, as the indicator’s logic is transparent and compatible with alert-based or automated workflows.
**Summary**
The SuperTrend Dual RMA is a refined evolution of the classic SuperTrend, optimized for traders who value smoother directional tracking and more intelligent volatility adaptation. It blends two time-sensitive, volume-aware moving averages with an ATR-derived volatility system to deliver reliable, actionable trend information. Its visual design, adaptive responsiveness, and integrated alert functionality make it a complete solution for identifying and managing trends across multiple asset classes and timeframes.

VWAP Trend
**Overview**
The VWAP Trend indicator is a volume-weighted price analysis tool that visualizes the relationship between price and the anchored Volume Weighted Average Price (VWAP) over different timeframes. This script is designed to reveal when the market is trending above or below its volume-weighted equilibrium point, providing a clear framework for identifying directional bias, trend strength, and potential reversals.
By combining an anchored VWAP with exponential smoothing and a secondary trend EMA, the indicator helps traders distinguish between short-term price fluctuations and genuine volume-supported directional moves.
**Core Concept**
VWAP (Volume Weighted Average Price) represents the average price of an asset weighted by traded volume. It reflects where the majority of trading activity has taken place within a chosen period, serving as a critical reference level for institutions and professional traders.
This indicator extends the traditional VWAP concept by:
1. Allowing users to **anchor VWAP to different timeframes** (Daily, Weekly, or Monthly).
2. Applying **smoothing** to create a stable reference curve less prone to noise.
3. Overlaying a **trend EMA** to identify whether current price momentum aligns with or diverges from VWAP equilibrium.
The combination of these elements produces a visual representation of price’s relationship to its fair value across time, helping to identify accumulation and distribution phases.
**Calculation Methodology**
1. **Anchored VWAP Calculation:**
The script resets cumulative volume and cumulative volume–price data at the start of each new VWAP session (based on the selected anchor timeframe). It continuously accumulates the product of price and volume, dividing this by total volume to compute the current VWAP value.
2. **Smoothing Process:**
The raw VWAP line is smoothed using an Exponential Moving Average (EMA) of user-defined length, producing a cleaner, more stable trend curve that minimizes intraperiod noise.
3. **Trend Determination:**
An additional EMA is calculated on the closing price. By comparing the position of this EMA to the smoothed VWAP, the indicator determines the prevailing market bias:
* When the trend EMA is above the smoothed VWAP, the market is considered to be in an **uptrend**.
* When the trend EMA is below the smoothed VWAP, the market is classified as a **downtrend**.
**Visual Structure**
The indicator uses color dynamics and chart overlays to make interpretation intuitive:
* **Smoothed VWAP Line:** The main trend reference, colored blue during bullish conditions and orange during bearish conditions.
* **Price Fill Region:** The area between the smoothed VWAP and price is filled with a translucent color matching the current trend, visually representing whether price is trading above or below equilibrium.
* **Trend EMA (implicit):** Although not separately plotted, it drives the color state of the VWAP, ensuring seamless visual transitions between bullish and bearish conditions.
**Inputs and Parameters**
* **VWAP Timeframe:** Choose between Daily, Weekly, or Monthly anchoring. This determines the reset frequency for cumulative volume and price data.
* **VWAP Smoothing Length:** Defines how many periods are used to smooth the VWAP line. Shorter values produce a more reactive line; longer values create smoother, steadier signals.
* **Trend EMA Length:** Sets the period for the trend detection EMA applied to price. Adjust this to calibrate how quickly the indicator reacts to directional changes.
**Interpretation and Use Cases**
* **Trend Confirmation:** When price and the trend EMA both remain above the smoothed VWAP, the market is showing strong bullish control. Conversely, consistent price action below the VWAP suggests sustained bearish sentiment.
* **Fair Value Assessment:** VWAP serves as a dynamic equilibrium level. Price repeatedly reverting to this line indicates consolidation or fair value zones, while strong directional moves away from VWAP highlight momentum phases.
* **Institutional Benchmarking:** Because large market participants often benchmark entries and exits relative to VWAP, this indicator helps align retail analysis with institutional logic.
* **Reversal Detection:** Sudden crossovers of the trend EMA relative to the VWAP can signal potential reversals or shifts in momentum strength.
**Trading Applications**
* **Trend Following:** Use VWAP’s direction and color state to determine trade bias. Long entries are favored when the VWAP turns blue, while short entries align with orange phases.
* **Mean Reversion:** In ranging conditions, traders may look for price deviations far above or below VWAP as potential reversion opportunities.
* **Multi-Timeframe Confluence:** Combine the Daily VWAP Trend with higher anchor periods (e.g., Weekly or Monthly) to confirm larger trend structure.
* **Support and Resistance Mapping:** VWAP often acts as a strong intraday or session-level support/resistance zone. The smoothed version refines this behavior into a cleaner, more reliable reference.
**Originality and Innovation**
The VWAP Trend indicator stands apart from conventional VWAP scripts through several original features:
1. **Anchor Flexibility:** Most VWAP indicators fix the anchor to a specific session (like daily). This version allows switching between Daily, Weekly, and Monthly anchors dynamically, adapting to various trading styles and time horizons.
2. **Volume-Weighted Smoothing:** The use of an EMA smoothing layer over the raw VWAP provides enhanced stability without compromising responsiveness, delivering a more analytically consistent signal.
3. **EMA-Based Trend Comparison:** By introducing a second trend EMA, the indicator creates a comparative framework that merges volume-weighted price analysis with classical momentum tracking — a rare and powerful combination.
4. **Adaptive Visual System:** The color-shifting and shaded fill between VWAP and price are integrated into a single, lightweight structure, giving traders immediate insight into market bias without the clutter of multiple overlapping indicators.
**Advantages**
* Adaptable to any market, timeframe, or trading style.
* Provides both equilibrium (VWAP) and momentum (EMA) perspectives.
* Smooths out noise while retaining the integrity of volume-based price dynamics.
* Enhances situational awareness through intuitive color-coded visualization.
* Ideal for professional, swing, and intraday traders seeking context-driven market direction.
**Summary**
The VWAP Trend indicator is a modern enhancement of the classical VWAP methodology. By merging anchored volume-weighted analysis with smoothed trend detection and visual state feedback, it provides a comprehensive perspective on market equilibrium and directional strength. It is built for traders who seek more than static price references — offering an adaptive, volume-aware framework for identifying market trends, reversals, and fair-value zones with precision and clarity.

Time Range HighlighterThis indicator highlights up to two custom time ranges on your chart with fully adjustable settings:
🔧 Features:
Define two separate time sessions
Set custom start and end times (in any time zone)
Choose unique highlight colors and opacity for each session
Toggle each range on or off independently
Timezone input allows syncing sessions to any global market hours (e.g., UTC, Asia/Tehran, New York)
🕒 Example Use Cases:
Highlight market opening hours (e.g. NYSE: 0930–1600)
Track your personal trading hours or peak volatility sessions
Visualize specific algorithm time filters
📌 Usage:
Enter your desired timezone string (e.g., "Asia/Tehran" or "Etc/UTC")
Customize session times like "0930-1200" and "1500-1700"
Adjust colors and visibility to fit your strategy
Ideal for traders who rely on time-based setups or session overlays.

Current State: Overbought/Oversold + Trend KAPIL GOYALThis Pine Script calculates the RSI (Relative Strength Index) and compares it against preset thresholds to classify the market as Deep/Moderate/Mild Oversold or Deep/Moderate/Mild Overbought. It also checks whether the current price is above or below the 50-day moving average to define the trend as Uptrend or Downtrend. The script then combines both signals into one clean, real-time text output—like “Moderate Oversold + Uptrend”—displayed in a small table at the chart corner. It’s designed to give a quick, clutter-free snapshot of the current market state without plotting multiple indicators.
How to use:
Apply this indicator to any chart (e.g., Tesla on TradingView). It will show one line of text describing the current condition based on RSI and trend. Use it for quick decision cues:
“Oversold + Uptrend” suggests potential accumulation or rebound zones.
“Overbought + Downtrend” warns of exhaustion or profit-taking zones.
Combine it with your entry/exit strategy—like your 30DMA/50DMA rule or momentum filters—to confirm timing rather than act alone.

Ichimoku_RSI_MACD_CleanIchimoku + RSI + MACD. A combination of three indicators. The important thing is that they have a BUY or SELL alert, so it makes it easy to understand the numbers.


EMA 200 - 50 - 20 | Davide BuncugaThis script displays three key Exponential Moving Averages (EMAs) on the chart: EMA 200, EMA 50, and EMA 20.
These moving averages are commonly used by traders to identify the overall market trend, medium-term structure, and short-term momentum.
EMA 200 – Represents the long-term trend and acts as a dynamic support/resistance.
EMA 50 – Used to identify the medium-term direction of the market.
EMA 20 – Highlights short-term momentum and pullback areas within the trend.
This indicator is designed to help traders quickly analyze market structure and align their trading decisions with the dominant trend.

Ichimoku_RSI_MACDIchimoku cloud + RSI + MACD. Combined indicators with signals, indicating whether it is bullish or bearish (BUY or SELL).

3D Cube Projection - √3 Diagonal3D Cube Projection - √3 Diagonal
OVERVIEW
This indicator implements Bradley F. Cowan's cube projection methodology from his "Four Dimensional Stock Market Structures & Cycles" work. It visualizes a 3D cube projected onto the 2D price-time chart, using the √3 (square root of 3) body diagonal as the primary analytical tool for identifying market structure and potential cycle termination points.
METHODOLOGY
The cube is constructed by selecting two pivot points (A and E) which form the body diagonal - the longest diagonal running through the cube's interior from one corner to the diagonally opposite corner. According to Cowan's geometric approach:
- Point A = Starting pivot (low or high)
- Point E = Ending pivot (opposite extreme)
- Body Diagonal (A→E) = √3 × cube side length
- Face Diagonal (A→C) = √2 × cube side length
The script calculates the cube dimensions by:
1. Measuring the total price range from A to E
2. Dividing by √3 to determine the cube side length in price
3. Distributing the time component across three equal segments
4. Projecting the 3D structure onto the 2D chart plane
FEATURES
✓ Interactive date selection for points A and E
✓ Automatic UPLEG/DOWNLEG detection
✓ All 8 cube vertices labeled (A-H)
✓ All 6 cube faces with independent color/opacity controls
✓ √3 body diagonal (red line by default)
✓ √2 face diagonal (orange line by default)
✓ Customizable cube lines, fills, and labels
✓ Information table showing key measurements
VISUAL CUSTOMIZATION
- Front & Back faces: Box fills for the two square faces
- Side faces: Left and right vertical faces
- Top & Bottom faces: Horizontal connecting faces
- Each group has independent color and opacity settings
- Label size and transparency fully adjustable
- Cube line styles (solid, dashed, dotted) for depth perception
IMPORTANT LIMITATIONS & DISCLOSURES
This indicator works within the inherent constraints of projecting 3D geometry onto a 2D price-time chart:
⚠️ VISUAL APPROXIMATION: This is a visual projection tool, not a mathematically perfect 3D cube. True 3D geometry cannot be accurately represented on a 2D plane without distortion.
⚠️ TIME DISTRIBUTION: The script divides the time axis into three equal segments (total bars ÷ 3) for practical visualization. This is an approximation that prioritizes visual coherence over strict geometric accuracy.
⚠️ UNIT SCALING: Price and time use different units (dollars vs. bars), making true isometric projection impossible. The cube appears proportional on screen but the dimensions are not directly comparable.
⚠️ 2D CONSTRAINT: We only have X (time) and Y (price) axes available. The Z-axis (depth) is simulated through visual projection techniques (line styles, shading).
INTENDED USE
This tool is designed for traders and analysts who study Bradley Cowan's geometric market analysis methods. It helps visualize:
- Market structure in geometric terms
- Potential support/resistance zones at cube edges
- Cycle timing relationships using √2 and √3 ratios
- Harmonic price-time relationships
The cube projection should be used as one component of a comprehensive analysis approach, combined with other technical tools and fundamental analysis.
MATHEMATICAL FOUNDATION
While the visual representation involves approximations, the core √3 relationship is mathematically sound:
- For any cube, the body diagonal = √3 × side length
- The face diagonal = √2 × side length
- These ratios are preserved in the price dimension calculations
HOW TO USE
1. Select your starting date (Point A) - typically a significant low or high
2. Select your ending date (Point E) - the opposite extreme pivot
3. The indicator automatically constructs the cube geometry
4. Analyze the cube edges, diagonals, and faces for market structure insights
5. Adjust colors and opacity to suit your chart aesthetic
TECHNICAL NOTES
- Works on all timeframes and instruments
- Best viewed on charts with sufficient historical data
- Cube updates in real-time as new bars form
- Range selection is marked with vertical lines and shading
- Calculator table shows Point A, Point E, side length, and bar measurements
ACKNOWLEDGMENT
This indicator is based on the geometric market analysis principles developed by Bradley F. Cowan. Users are encouraged to study Cowan's original works for deeper understanding of the theoretical framework.
DISCLAIMER
This indicator is for educational and analytical purposes only. It does not constitute financial advice. Past performance does not guarantee future results. Always conduct your own research and risk management before making trading decisions.

Pannello Multi-Account con Spread e Dimensione Regolabile📘 Indicator Description: Multi-Account Execution Panel with Spread-Adjusted Risk
This indicator is designed for traders who manage multiple accounts with different capital sizes and execution models—such as a personal account and a prop firm account. It provides a visual panel that calculates and displays the ideal position size for each account, factoring in stop loss, spread, and risk preferences.
🔧 Key Features:
- Manual risk input in USD for the personal account (e.g., $2, $5, $10)
- Percentage-based risk for the prop firm account (e.g., 1% of €5,000)
- Spread-adjusted stop loss for each account, ensuring accurate risk calculation
- Real-time pip value calculation based on the current symbol
- Position size output:
- In units for the personal account
- In standard lots for the prop firm account
- Adjustable table size (Compact, Standard, Extended) to fit your screen and workflow
🧠 Ideal for:
- Traders who execute sequentially across multiple accounts
- Those who want precise, spread-aware sizing without manual calculations
- Discretionary strategies that require visual clarity and execution discipline
Italian

Panel Multi-Cuenta con Spread y Tamaño Ajustable📘 Indicator Description: Multi-Account Execution Panel with Spread-Adjusted Risk
This indicator is designed for traders who manage multiple accounts with different capital sizes and execution models—such as a personal account and a prop firm account. It provides a visual panel that calculates and displays the ideal position size for each account, factoring in stop loss, spread, and risk preferences.
🔧 Key Features:
- Manual risk input in USD for the personal account (e.g., $2, $5, $10)
- Percentage-based risk for the prop firm account (e.g., 1% of €5,000)
- Spread-adjusted stop loss for each account, ensuring accurate risk calculation
- Real-time pip value calculation based on the current symbol
- Position size output:
- In units for the personal account
- In standard lots for the prop firm account
- Adjustable table size (Compact, Standard, Extended) to fit your screen and workflow
🧠 Ideal for:
- Traders who execute sequentially across multiple accounts
- Those who want precise, spread-aware sizing without manual calculations
- Discretionary strategies that require visual clarity and execution discipline
Spanish

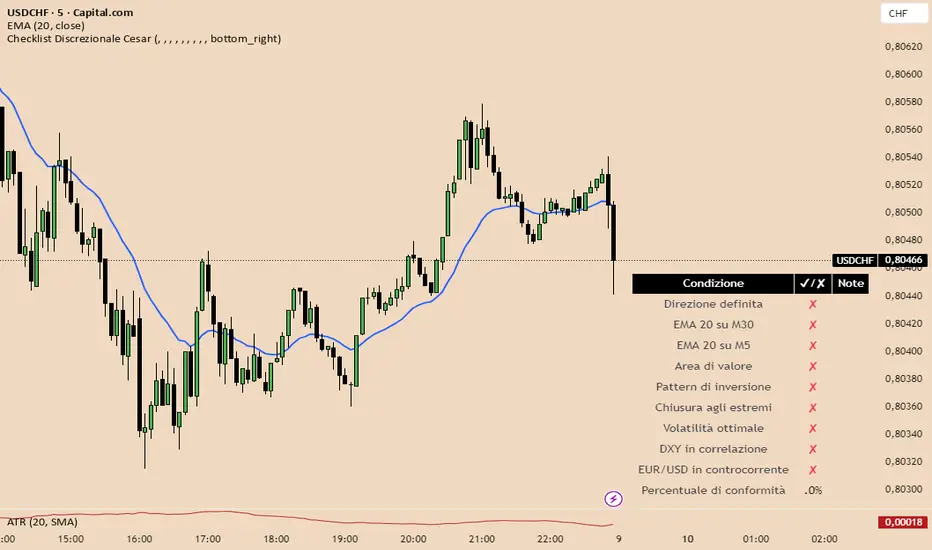
Checklist Discrezionale USdCHf 2025 Cesar Italiano📘 Indicator Description: Discretionary Checklist with Weighted Scoring and Visual Validation
This advanced Pine Script indicator is built for discretionary traders who want to structure their decision-making without sacrificing flexibility. It provides a customizable checklist that evaluates multiple technical, contextual, and macroeconomic criteria—each with its own weight in the overall score.
🔧 Key Features:
- On-screen visual checklist, with items triggered manually or by automated conditions
- Weighted scoring system, allowing you to prioritize high-impact criteria like market structure, confluence, or macro context
- Setup validation logic: displays a confidence bar or traffic light based on total score
- Optional integration with news zones, sentiment indicators, and risk management modules
- Conditional activation: can trigger alerts or unlock other tools only when the setup meets a minimum quality threshold
🧠 Ideal for:
- Traders who blend technical analysis, macro context, and discretionary judgment
- Prop firm evaluations or capital scaling workflows
- Strategies that require visual control, partial automation, and structured decision-making
Italian
Checklist Discrecional UsdChF 2025 PA📘 Indicator Description: Discretionary Checklist with Weighted Scoring and Visual Validation
This advanced Pine Script indicator is built for discretionary traders who want to structure their decision-making without sacrificing flexibility. It provides a customizable checklist that evaluates multiple technical, contextual, and macroeconomic criteria—each with its own weight in the overall score.
🔧 Key Features:
- On-screen visual checklist, with items triggered manually or by automated conditions
- Weighted scoring system, allowing you to prioritize high-impact criteria like market structure, confluence, or macro context
- Setup validation logic: displays a confidence bar or traffic light based on total score
- Optional integration with news zones, sentiment indicators, and risk management modules
- Conditional activation: can trigger alerts or unlock other tools only when the setup meets a minimum quality threshold
🧠 Ideal for:
- Traders who blend technical analysis, macro context, and discretionary judgment
- Prop firm evaluations or capital scaling workflows
- Strategies that require visual control, partial automation, and structured decision-making

Gestore Visivo del Rischio AdattabileThis Pine Script indicator is a dynamic Risk Management Visual Tool designed for discretionary traders who want precise, real-time control over position sizing and trade planning. It automatically adapts to the currency pair you're trading and calculates key risk metrics based on your inputs.
🔧 Features:
- Auto-detects the active symbol and adjusts pip value calculations accordingly (including JPY pairs and USD as base or quote).
- Calculates:
- Pip value based on current price and pair structure
- Ideal position size (lots) based on account capital, risk %, and stop loss
- Risk in USD per trade
- Expected profit in USD
- Risk-to-Reward ratio (R/R)
- Displays all metrics in a clean, real-time on-chart table
- Fully customizable inputs: capital, risk %, stop loss, take profit, and lot size base
🧠 Ideal for:
- Traders who want to enforce consistent risk management
- Those preparing for prop firm challenges or scaling strategies
- Anyone trading multiple pairs and needing automatic pip value adaptation
Italian

Gestor de Riesgo Visual Adaptable📘 Script Description: Risk Management Visual Tool (Auto-Adaptive)
This Pine Script indicator is a dynamic Risk Management Visual Tool designed for discretionary traders who want precise, real-time control over position sizing and trade planning. It automatically adapts to the currency pair you're trading and calculates key risk metrics based on your inputs.
🔧 Features:
- Auto-detects the active symbol and adjusts pip value calculations accordingly (including JPY pairs and USD as base or quote).
- Calculates:
- Pip value based on current price and pair structure
- Ideal position size (lots) based on account capital, risk %, and stop loss
- Risk in USD per trade
- Expected profit in USD
- Risk-to-Reward ratio (R/R)
- Displays all metrics in a clean, real-time on-chart table
- Fully customizable inputs: capital, risk %, stop loss, take profit, and lot size base
🧠 Ideal for:
- Traders who want to enforce consistent risk management
- Those preparing for prop firm challenges or scaling strategies
- Anyone trading multiple pairs and needing automatic pip value adaptation

BullTrader - ParabolicSARFlipSignals(NonRepainting)TP/SL🧠 Purpose & Concept
This indicator refines Wilder’s Parabolic SAR into a simple, non‑repainting alert and visualization system that marks each confirmed trend flip with a clear buy or sell signal.
It also auto‑generates dynamic, ATR‑based Take‑Profit (TP) and Stop‑Loss (SL) levels, keeps them updating with price in real time, and displays the current market bias in an on‑chart table.
The goal: clarity and automation without complexity — see exactly when a new bullish or bearish phase begins, what your current TP/SL targets are, and receive a single clean alert for every new flip.
⚙️ How It Works
1. The built‑in ta.sar() function tracks the Parabolic SAR dots.
2. When a candle closes across the SAR line, a trend‑change is confirmed:
• Price crossing above a SAR dot → Buy Flip (green triangle).
• Price crossing below a SAR dot → Sell Flip (red triangle).
3. On each flip, the indicator calculates dynamic ATR‑based TP / SL targets:
TP = entry ± (ATR × tpMult) and SL = entry ∓ (ATR × slMult)
These values move automatically as the trend develops.
4. A small floating label beside the latest bar shows live‑updated TP / SL numbers.
5. A color‑coded table in the upper‑right corner displays the current trend: Lime = Bullish, Red = Bearish, Yellow = Neutral.
6. Each new flip triggers an easy‑to‑use Buy / Sell alert after the bar closes—no repainting.
🔔 Alerts
Alert Name Triggers When Message
SAR Buy Flip Alert Green triangle (bullish reversal) “BUY Flip — Parabolic SAR on {{ticker}} ({{interval}})”
SAR Sell Flip Alert Red triangle (bearish reversal) “SELL Flip — Parabolic SAR on {{ticker}} ({{interval}})”
📈 Chart Elements
Element Meaning
🟠 Orange cross Standard Parabolic SAR trail.
🟢 / 🔴 Triangles Confirmed buy / sell flips (non‑repainting).
Bright lime/red TP‑SL box Live ATR targets that move with price.
Trend table (top‑right) Instant status of bullish/bearish bias.
✅ Features & Highlights
Non‑repainting — all signals confirm on closed bars.
Visual clarity — single pair of bright triangles for flips.
Dynamic ATR‑based TP / SL values that auto‑trail with trend.
Always‑visible trend summary table.
Two ready‑made alert types (Buy / Sell).
Lightweight and optimized for any timeframe or symbol.
💡 Best Use
Ideal for traders who prefer clean trend‑based entries and volatility‑adaptive exits without signal clutter:
Pair it with your existing strategy or use it standalone for reversal‑based swing and intraday trading.

BullTrader - ParabolicSARFlipSignals(NonRepainting)🧠 Concept & Purpose
This indicator isolates the confirmed trend‑change events produced by the Parabolic SAR and turns them into direct, non‑repainting trade signals.
Instead of plotting every SAR dot as a potential entry, it marks only the bars where price has closed across the SAR line, confirming a genuine flip from bullish → bearish or vice versa.
Each confirmed flip is displayed with a single triangle on the chart and can be connected to alerts.
The design is intentionally minimal: one simple but reliable algorithmic definition of “the trend just turned.”
⚙️ How It Works
1. The script calculates the standard Parabolic SAR value using the built‑in ta.sar() function.
2. When a candle closes above a SAR dot that was previously above price → uptrend starts (Buy Signal).
3. When a candle closes below a SAR dot that was previously below price → downtrend starts (Sell Signal).
4. Signals are confirmed only after the bar closes (barstate.isconfirmed), guaranteeing no repainting.
5. Each event can trigger an alert or simply serve as a visual reversal marker.
📈 Chart Elements
Element Description
🟠 Orange cross dots Standard Parabolic SAR trail.
🟢 Triangle below bar Confirmed SAR flip up → new bullish phase.
🔴 Triangle above bar Confirmed SAR flip down → new bearish phase.
Optional green/red background Highlights bars where a confirmed flip occurred.
🔔 Alerts
Use buySignalFinal for Buy alerts and sellSignalFinal for Sell alerts.
Set alerts to “Once per bar close” to match the non‑repainting confirmation logic.
📊 Best Use
* Identifying clear trend reversals.
* As an entry / exit overlay for manual trading.
* As a base signal for automated or alert‑driven systems.
This version keeps the indicator fast, reproducible, and completely non‑repainting — ideal for traders who prefer transparent and verifiable signals derived directly from Per J. Wilder’s original Parabolic SAR formula.
