Power candle_v4-----------------------------Power candle_v4Power candle_v4------------------------------------------------
-----------------------------Power candle_v4Power candle_v4------------------------------------------------
-----------------------------Power candle_v4Power candle_v4------------------------------------------------
-----------------------------Power candle_v4Power candle_v4------------------------------------------------
-----------------------------Power candle_v4Power candle_v4------------------------------------------------
-----------------------------Power candle_v4Power candle_v4------------------------------------------------
-----------------------------Power candle_v4Power candle_v4------------------------------------------------
-----------------------------Power candle_v4Power candle_v4------------------------------------------------
-----------------------------Power candle_v4Power candle_v4-----------------------------------------------------------------------------Power candle_v4Power candle_v4-----------------------------------------------------------------------------Power candle_v4Power candle_v4-----------------------------------------------------------------------------Power candle_v4Power candle_v4-----------------------------------------------------------------------------Power candle_v4Power candle_v4-----------------------------------------------------------------------------Power candle_v4Power candle_v4------------------------------------------------
Pesquisar nos scripts por "纳斯达克指数期货cfd"

6am Candle High/Low Indicator with Highlight6am Candle High/Low Indicator with Highlight
6am Candle High/Low Indicator with Highlight
6am Candle High/Low Indicator with Highlight
6am Candle High/Low Indicator with Highlight 6am Candle High/Low Indicator with Highlight

Advanced HMM - 3 States CompleteHidden Markov Model
Aconsistent challenge for quantitative traders is the frequent behaviour modification of financial
markets, often abruptly, due to changing periods of government policy, regulatory environment
and other macroeconomic effects. Such periods are known as market regimes. Detecting such
changes is a common, albeit difficult, process undertaken by quantitative market participants.
These various regimes lead to adjustments of asset returns via shifts in their means, variances,
autocorrelation and covariances. This impacts the effectiveness of time series methods that rely
on stationarity. In particular it can lead to dynamically-varying correlation, excess kurtosis ("fat
tails"), heteroskedasticity (volatility clustering) and skewed returns.
There is a clear need to effectively detect these regimes. This aids optimal deployment of
quantitative trading strategies and tuning the parameters within them. The modeling task then
becomes an attempt to identify when a new regime has occurred adjusting strategy deployment,
risk management and position sizing criteria accordingly.
A principal method for carrying out regime detection is to use a statistical time series tech
nique known as a Hidden Markov Model . These models are well-suited to the task since they
involve inference on "hidden" generative processes via "noisy" indirect observations correlated
to these processes. In this instance the hidden, or latent, process is the underlying regime state,
while the asset returns are the indirect noisy observations that are influenced by these states.
MAIN FEATURES OF THE INDICATOR
The "Advanced HMM - 3 States Complete" indicator is an advanced technical analysis tool that uses Hidden Markov Model (HMM) to identify three main market regimes: BULL, BEAR, and SIDEWAYS.
🎯 KEY FEATURES:
1. HMM-based Trend Detection
3 market states: Bull (0), Bear (1), Sideways (2)
Dynamic probabilities: Calculates probability for each state based on price data
Transition matrix: Models state transitions between regimes
2. Analytical Features
Price volatility: Log returns and standard deviation
Momentum: Rate of Change (ROC)
Volume: Volume ratio vs moving average
Data normalization: Standardizes features to common scale
3. Visual Trading Signals
text
📍 BUY Signals:
- Green upward triangle below bars
- "LONG" label in green
📍 SELL Signals:
- Red downward triangle above bars
- "SHORT" label in red
📍 EXIT Signals:
- Orange X marks when transitioning to sideways
4. Information Display
Probability table (top-right): Shows percentage for each state
State label: Current regime with probability percentages
Chart background color: Reflects dominant market state
5. Automated Alerts
Alerts when new Bull/Bear market detected
Alerts when market transitions to sideways
Configurable TradingView notifications
6. Customizable Parameters
pinescript
length: 100 // Lookback period
smoothing_period: 20 // Probability smoothing
volatility_threshold: 0.5 // Volatility threshold
💡 PRACTICAL APPLICATIONS:
Identify primary trends with quantified probabilities
Entry/exit signals based on state transitions
Risk management during sideways markets
Trend confirmation when combined with other indicators
This indicator is particularly useful for market regime analysis and identifying trend transition points using advanced statistical probability methods.
🔧 TECHNICAL IMPLEMENTATION:
Composite observation: Weighted combination of returns (40%), momentum (30%), and volatility (30%)
Gaussian emission probabilities: Different distributions for each state
Manual HMM updates: Avoids matrix computation limitations in Pine Script
Real-time smoothing: EMA applied to state probabilities
The indicator provides institutional-grade regime detection in a visually intuitive package suitable for both discretionary and systematic traders.

Aurum DCX AVE Gold and Silver StrategySummary in one paragraph
Aurum DCX AVE is a volatility break strategy for gold and silver on intraday and swing timeframes. It aligns a new Directional Convexity Index with an Adaptive Volatility Envelope and an optional USD/DXY bias so trades appear only when direction quality and expansion agree. It is original because it fuses three pieces rarely combined in one model for metals: a convexity aware trend strength score, a percentile based envelope that widens with regime heat, and an intermarket DXY filter.
Scope and intent
• Markets. Gold and silver futures or spot, other liquid commodities, major indices
• Timeframes. Five minutes to one day. Defaults to 30min for swing pace
• Default demo used in this publication. TVC:GOLD on 30m
• Purpose. Enter confirmed volatility breaks while muting chop using regime heat and USD bias
• Limits. This is a strategy. Orders are simulated on standard candles only
Originality and usefulness
• Unique fusion. DCX combines DI strength with path efficiency and curvature. AVE blends ATR with a high TR percentile and widens with DCX heat. DXY adds an intermarket bias
• Failure mode addressed. False starts inside compression and unconfirmed breakouts during USD swings
• Testability. Each component has a named input. Entry names L and S are visible in the list of trades
• Portable yardstick. Weekly ATR for stops and R multiples for targets
• Open source. Method and implementation are disclosed for community review
Method overview in plain language
You score direction quality with DCX, size an adaptive envelope with a blend of ATR and a high TR percentile, and only allow breaks that clear the band while DCX is above a heat threshold in the same direction. An optional DXY filter favors long when USD weakens and short when USD strengthens. Orders are bracketed with a Weekly ATR stop and an R multiple target, with optional trailing to the envelope.
Base measures
• Range basis. True Range and ATR over user windows. A high TR percentile captures expansion tails used by AVE
• Return basis. Not required
Components
• Directional Convexity Index DCX. Measures directional strength with DX, multiplies by path efficiency, blends a curvature term from acceleration, scales to 0 to 100, and uses a rise window
• Adaptive Volatility Envelope AVE. Midline ALMA or HMA or EMA plus bands sized by a blend of ATR and a high TR percentile. The blend weight follows volatility of volatility. Band width widens with DCX heat
• DXY Bias optional. Daily EMA trend of DXY. Long bias when USD weakens. Short bias when USD strengthens
• Risk block. Initial stop equals Weekly ATR times a multiplier. Target equals an R multiple of the initial risk. Optional trailing to AVE band
Fusion rule
• All gates must pass. DCX above threshold and rising. Directional lead agrees. Price breaks the AVE band in the same direction. DXY bias agrees when enabled
Signal rule
• Long. Close above AVE upper and DCX above threshold and DCX rising and plus DI leads and DXY bias is bearish
• Short. Close below AVE lower and DCX above threshold and DCX falling and minus DI leads and DXY bias is bullish
• Exit and flip. Bracket exit at stop or target. Optional trailing to AVE band
Inputs with guidance
Setup
• Symbol. Default TVC:GOLD (Correlation Asset for internal logic)
• Signal timeframe. Blank follows the chart
• Confirm timeframe. Default 1 day used by the bias block
Directional Convexity Index
• DCX window. Typical 10 to 21. Higher filters more. Lower reacts earlier
• DCX rise bars. Typical 3 to 6. Higher demands continuation
• DCX entry threshold. Typical 15 to 35. Higher avoids soft moves
• Efficiency floor. Typical 0.02 to 0.06. Stability in quiet tape
• Convexity weight 0..1. Typical 0.25 to 0.50. Higher gives curvature more influence
Adaptive Volatility Envelope
• AVE window. Typical 24 to 48. Higher smooths more
• Midline type. ALMA or HMA or EMA per preference
• TR percentile 0..100. Typical 75 to 90. Higher favors only strong expansions
• Vol of vol reference. Typical 0.05 to 0.30. Controls how much the percentile term weighs against ATR
• Base envelope mult. Typical 1.4 to 2.2. Width of bands
• Regime adapt 0..1. Typical 0.6 to 0.95. How much DCX heat widens or narrows the bands
Intermarket Bias
• Use DXY bias. Default ON
• DXY timeframe. Default 1 day
• DXY trend window. Typical 10 to 50
Risk
• Risk percent per trade. Reporting field. Keep live risk near one to two percent
• Weekly ATR. Default 14. Basis for stops
• Stop ATR weekly mult. Typical 1.5 to 3.0
• Take profit R multiple. Typical 1.5 to 3.0
• Trail with AVE band. Optional. OFF by default
Properties visible in this publication
• Initial capital. 20000
• Base currency. USD
• request.security lookahead off everywhere
• Commission. 0.03 percent
• Slippage. 5 ticks
• Default order size method percent of equity with value 3% of the total capital available
• Pyramiding 0
• Process orders on close ON
• Bar magnifier ON
• Recalculate after order is filled OFF
• Calc on every tick OFF
Realism and responsible publication
• No performance claims. Past results never guarantee future outcomes
• Shapes can move while a bar forms and settle on close
• Strategies use standard candles for signals and orders only
Honest limitations and failure modes
• Economic releases and thin liquidity can break assumptions behind the expansion logic
• Gap heavy symbols may prefer a longer ATR window
• Very quiet regimes can reduce signal contrast. Consider higher DCX thresholds or wider bands
• Session time follows the exchange of the chart and can change symbol to symbol
• Symbol sensitivity is expected. Use the gates and length inputs to find stable settings
Open source reuse and credits
• None
Mode
Public open source. Source is visible and free to reuse within TradingView House Rules
Legal
Education and research only. Not investment advice. You are responsible for your decisions. Test on historical data and in simulation before any live use. Use realistic costs.

Match on Selectable Percentage Change + RangeIndicator Overview:
Match on Selectable Percentage Change + Range is a powerful analytical tool designed for traders and analysts who want to identify historical price bars that match a specific percentage variation, and then evaluate how price evolved in the following days. It combines precision filtering with visual tabular feedback, making it ideal for pattern recognition, backtesting, and scenario analysis.
What It Does
This indicator scans historical bars to find instances where the percentage change between two consecutive closes matches a user-defined target (± a customizable tolerance). Once matches are found, it displays:
The date of each match (most recent first)
The actual variation searched
The percentage change after 2, 10, 20, and 30 bars
The min-max range (in %) over those same periods
All results are shown in a dynamic table directly on the chart.
Inputs & Controls
Input Description
Which variation do you want to analyze? (%)
Set the target percentage change to look for (e.g. 2.5%)
% deviation from the variation to be considered (%) Define the tolerance range around the target (e.g. ±0.5%)
Bars to analyze (max 9999) Set how many past bars to scan
Show match table Toggle to enable/disable the entire table
Show percentage variations (2d, 10d, 20d, 30d) Toggle to show/hide post-match percentage changes
Show min-max ranges (2d, 10d, 20d, 30d) Toggle to show/hide post-match high/low ranges
Table Structure
Each row in the table represents a historical match. Columns include:
Date: When the match occurred
Variation in: The actual % change that triggered the match
2d / 10d / 20d / 30d: % change after those days
Min-Max 2d / 10d / 20d / 30d: Range of price movement after those days
Color coding helps quickly identify bullish (green) vs bearish (red) outcomes.
Use Cases
Backtesting: See how similar past moves evolved over time
Scenario modeling: Estimate potential outcomes after a known variation
Pattern recognition: Spot recurring setups or volatility clusters
Risk analysis: Understand post-variation drawdowns and upside potential
Tips for Use
Use tighter deviation (e.g. 0.3%) for precision, or wider (e.g. 1%) for broader pattern capture.
Combine with other indicators to validate setups (e.g. volume, RSI, trend filters).
Toggle off variation or range columns to focus only on the metrics you need.

NWOG/NDOG + EHPDA🌐 ENGLISH DESCRIPTION
Hybrid NWOG/NDOG + EHPDA – Advanced Gaps & Event Horizon Indicator
(Enhanced with Real-Time Alerts and Info Table)
📊 Overview
This advanced indicator combines automatic detection of weekly gaps (NWOG) and daily gaps (NDOG) with the Event Horizon (EHPDA) concept, now featuring customizable alerts and a real-time info table for a more efficient trading experience. Designed for traders who operate based on institutional price structures, liquidity zones, and SMC/ICT confluences.
✨ Key Features
1. Gap Detection & Visualization
NWOG (New Week Opening Gap): Identifies and visualizes the gap between Friday’s close and Monday’s open.
NDOG (New Day Opening Gap): Detects daily gaps on intraday timeframes.
Enhanced visualization: Semi-transparent boxes, price levels (top, middle, bottom), and lines extended to the current bar.
Customizable labels: Display gap formation date and price levels (optional).
2. Event Horizon (EHPDA)
Automatically calculates the Event Horizon level between two non-overlapping gaps.
Dashed line marking the equilibrium zone between bullish and bearish gaps.
3. Advanced 5pm-6pm Mode
Special option to detect the Sunday-Monday gap using 4H bars.
4. Real-Time Alerts
New gaps (NWOG/NDOG): Immediate notification when a new gap forms.
Gap fill: Alert when price completely fills a gap.
Event Horizon active: Notification when the Event Horizon level is triggered.
5. Info Table
Real-time display: number of active gaps, Event Horizon status, time remaining until weekly/daily close.
Customizable: position, size, and style.
🎨 Customization
Configurable colors for bullish gaps, bearish gaps, and Event Horizon line.
Customizable price labels and date format.
📈 Use Cases
Reversal trading, price targets, liquidity zones, SMC/ICT confluences.
⚙️ Recommended Settings
Timeframes: Daily and intraday (15m, 1H, 4H, etc.).
NWOG: Enable on all timeframes.
NDOG: Enable only on intraday.
Max Gaps: 3-5 for clean charts, 10-15 for historical analysis.
📝 Important Notes
Works best on 24/5 markets (Forex, Crypto).
Gaps automatically close when filled.
Event Horizon only appears with at least 2 non-overlapping gaps.


PDB 4 MA + Candle Strength/Weakness Detector
4MA Strength & Reversal Detector
Unlock the power of momentum with this advanced 4 Moving Average system (20, 50, 100, 200) designed to pinpoint market strength and early reversal zones with precision.
How It Works:
- Bearish Reversal: Triggered when all moving averages align (20 < 50 < 100 < 200) and bearish reversal candles appear — highlighting potential tops.
- Bullish Reversal: Triggered when all moving averages align (200 < 100 < 50 < 20) and bullish reversal candles form — marking potential bottoms
:Best For:
⚡ Scalpers and day traders using 1–5 minute timeframes
📈 Identifying momentum shifts and trend exhaustion early
Tip: Combine this with volume or RSI for stronger confirmation and fewer false signals.

SuperTrend MAAfter building SuperBands, I kept thinking about what happens at the midpoint between those two volatility-adaptive envelopes. The upper and lower bands are both trailing price based on ATR and EMA smoothing, but they're operating independently in opposite directions. Taking their average seemed like it might produce an interesting centerline that adapts to volatility in a way that regular moving averages don't. Turns out it does, and that's what this indicator is.
The core concept is straightforward. Instead of plotting the upper and lower SuperBands separately, this calculates both of them internally, averages their values, and then applies an additional smoothing pass with EMA to create a single centerline. That centerline sits roughly in the middle of where the bands would be, but because it's derived from ATR-offset trailing stops rather than direct price smoothing, it behaves differently than a standard moving average of the same length. During trending periods, the centerline tracks closer to price because one of the underlying bands is actively trailing while the other is dormant. During consolidation, both bands compress toward price and the centerline tends to oscillate more with shorter-term movements.
What's interesting is that this acts like a supertrend all by itself with directional behavior baked in. When one of the underlying supertrend waves dominates, meaning price is strongly trending in one direction and only one band is active, you get what feels like a "true" supertrend, whatever that means exactly. The centerline locks into trend-following mode and the color gradient reflects that commitment. You get bright bullish colors during sustained uptrends when the upper band is doing all the work, and strong bearish colors during downtrends when the lower band dominates. But when both bands are active and fighting for control, which happens during consolidation or choppy conditions, the centerline settles into more neutral tones that clearly signal you're in a ranging environment. The colors really do emphasize this behavior and make it visually obvious which regime you're in.
The smoothing parameter controls how aggressively the underlying SuperBand trails adapt to price, which indirectly affects how responsive the centerline is. Lower values make the bands tighter and more reactive, so the centerline follows price action more closely. Higher values create wider bands that only respond to sustained moves, which produces a smoother centerline that filters out more noise. The center smoothing parameter applies a second EMA pass specifically to the averaged midpoint, giving you independent control over how much additional lag you want on the final output versus the raw band average.
What makes this different from just slapping an EMA on price is that the underlying bands are already volatility-aware through their ATR calculations. When volatility spikes, the bands widen and the centerline adjusts its position relative to price based on where those bands settle. A traditional moving average would just smooth over the volatility spike without adjusting its distance from price. This approach incorporates volatility information into the centerline's positioning, which can help it stay relevant during regime changes where fixed-period moving averages tend to lag badly or whipsaw.
The color gradient adds a momentum overlay using the same angle-based calculation from SuperBands. The centerline's rate of change gets normalized by an RMS estimate of its historical movement range, converted to an angle through arctangent scaling, and then mapped to a color gradient. When the centerline is rising, it gradients from neutral toward your chosen bullish color, with brightness increasing as the rate of ascent steepens. When falling, it shifts toward the bearish color with intensity tied to the descent rate. This gives you an immediate visual sense of whether the centerline is accelerating, decelerating, or moving at a stable pace.
Configuration is simpler than SuperBands since you're only dealing with a single output line instead of separate bull and bear envelopes. The length parameter controls the underlying band behavior. ATR period and multiplier determine how much space the bands allocate around price before they trail. Center smoothing adds the extra EMA pass on the averaged midpoint. You can tune these independently to get different characteristics. A tight ATR multiplier with heavy center smoothing creates a smooth line that stays close to price. A wide multiplier with light center smoothing produces a line that swings more freely and adapts faster to directional changes.
From a practical standpoint, this works well as a trend filter or dynamic support and resistance reference. Price above the centerline with bullish coloring suggests a favorable environment for long positions. Price below with bearish coloring indicates the opposite. Crossovers can signal trend changes, though like any moving average system, you'll get whipsaws in choppy conditions. The advantage over traditional MAs is that the volatility adaptation tends to reduce false signals during transitional periods where volatility is expanding but direction hasn't fully committed.
The implementation reuses the entire SuperBands logic, which means all the smoothing and state management for the trailing stops is identical. The only addition is averaging the two band outputs and applying the final EMA pass. The color calculation follows the same RMS-normalized angle approach but applies it to the centerline's delta rather than the individual band deltas. This keeps the coloring consistent with how SuperBands handles momentum visualization while adapting it to a single line instead of dual envelopes.
What this really highlights is that you can derive moving averages from mechanisms other than direct price smoothing. By building the centerline from volatility-adjusted trailing stops, you get adaptive behavior that responds to both price movement and volatility regime without needing separate inputs or complex multi-stage calculations. Whether that adaptation provides a meaningful edge depends on your strategy and market, but it's a fundamentally different approach than the typical fixed-period or adaptive MAs that adjust length based on volatility or momentum indicators.

orb ramgethis indicator is very fake please dont fololow it this indicator is very fake please dont fololow it this indicator is very fake please dont fololow it
Trí Nguyễn TrendM30 → M15 Reversal (Engulfing/Doji/Hammer)Trend follow M30
Entry M15 (Engulfing/Doji/Hammer)

Divergences: Price × RSI × OBV The Triple Confirmation Divergence indicator is a sophisticated momentum and volume-based tool designed to identify high-probability trend exhaustion points and potential reversals. It moves beyond traditional single-indicator divergence analysis by synthesizing signals from three core pillars of technical analysis: Price Action, Momentum, and Volume Flow.
This indicator works better on the time frames: 1H, 4H, 1D, 1W and 1M.

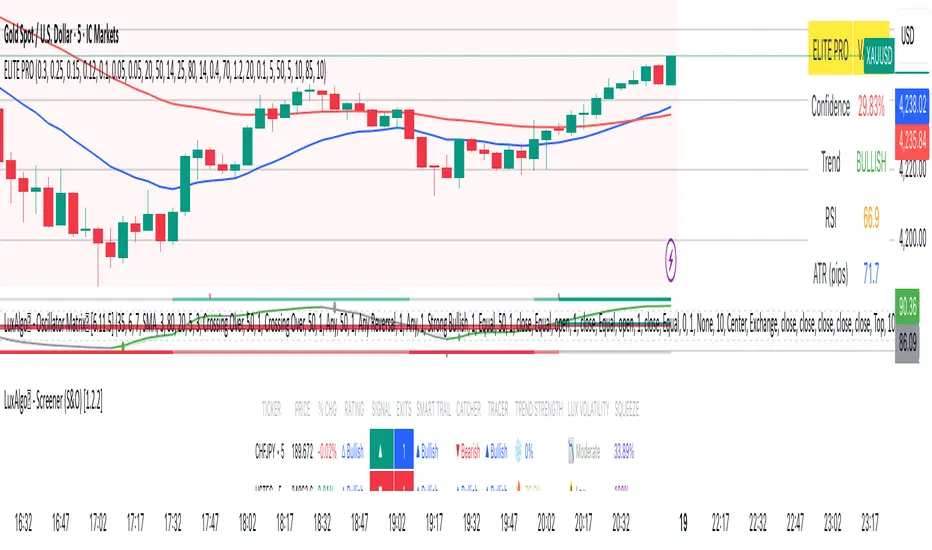
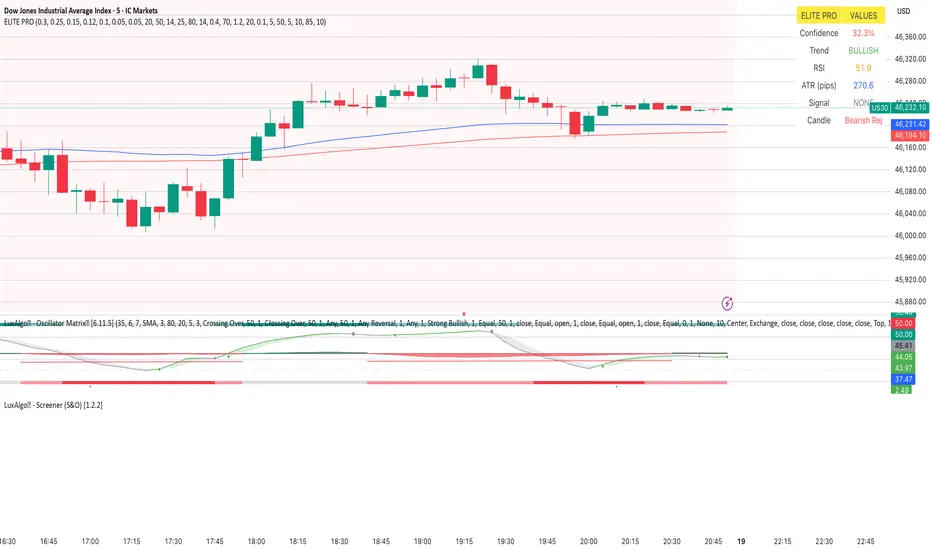
Elite_Pro_SignalsA sophisticated trading indicator that combines 8 powerful technical factors into a single confidence score to identify high-probability reversal signals.
8-Factor Confidence Scoring - Weighted analysis of multiple technical aspects
Smart Trend Alignment - Multi-timeframe EMA convergence
Advanced Pattern Recognition - Pin Bars, Engulfing, Inside Bars, Hammer/Shooting Star
Supply/Demand Zones - Automatic key level detection
Support/Resistance Confluence - Price action at significant levels
⚡ Smart Filters
Market Regime Detection - Avoid choppy/low-volatility conditions
Volume Confirmation - Ensure institutional participation
Liquidity Sweep Validation - Smart money movement detection
Candle Quality Filter - Eliminate false signals from tiny candles
🔧 How It Works
Confidence Scoring System (0-100%)
text
Wick Strength (30%) + Trend Alignment (25%) + Pattern Recognition (15%) +
Supply/Demand Zones (12%) + Support/Resistance (10%) + RSI Momentum (5%) +
Volume & Liquidity (5%)
Signal Generation
🟢 BUY Signals - Bullish rejection + Uptrend + High confidence
🔴 SELL Signals - Bearish rejection + Downtrend + High confidence
🎨 Visual Features
Clear Buy/Sell Arrows - Easy-to-spot signals
Confidence Background - Color-coded confidence levels
Info Table - Real-time metrics and analysis
Multi-Timeframe EMAs - Trend direction visualization
Professional Alerts - Real-time notifications
⚙️ Customization
Confidence Weights
Adjust the importance of each factor to match your trading style
Strategy Parameters
EMA periods (Fast: 20, Slow: 50)
RSI levels (Oversold: 25, Overbought: 80)
Minimum confidence threshold (70% recommended)
Advanced Filters
Volume multiplier settings
Liquidity sweep sensitivity
Market regime filters
Zone detection parameters
📈 Recommended Usage
Timeframes
Primary: 5-minute to 1-hour charts
Best Results: 15-minute with 1-hour trend alignment
Markets
Forex Pairs (EURUSD, GBPUSD, XAUUSD)
Indices (US30, NAS100, DE40)
Commodities (Gold, Oil)
Trading Sessions
London & New York overlap (Highest volatility)
Avoid Asian session (Low signal quality)
🔍 Signal Interpretation
High-Confidence Signals (80%+)
Strong trend alignment
Clear rejection patterns
Volume confirmation
Multiple confluence factors
Medium-Confidence Signals (60-80%)
Good setup but missing 1-2 factors
Requires additional confirmation
Low-Confidence Signals (<60%)
Avoid trading
Wait for better setups
Elite_Pro SignalsTrial version to get the signals. used various indicators including candle pattern. Works on 5 min candle but checks multi time frames to see if it is inline with 15 min and 1 hr. Best works on Gold and Indices.
Triple EMA strategy by kingtraderthis strategy is purely based on moving everages, ema5, ema50 and ema200, avoid ranging market. in 1 mint your tp should 15-20pips, in 3mint tp should be 25pips, in 5mint tp should not above 50pips, in 15mints make tp 60 to 80 pips, in 30 mints tp 150 and 1h and h4 ur tp above 200pips, when target achieves have partial closing and keep ur trade breakeven. this indicator is for educational purpose only any loss by using this indicator, the author will not be responsible.
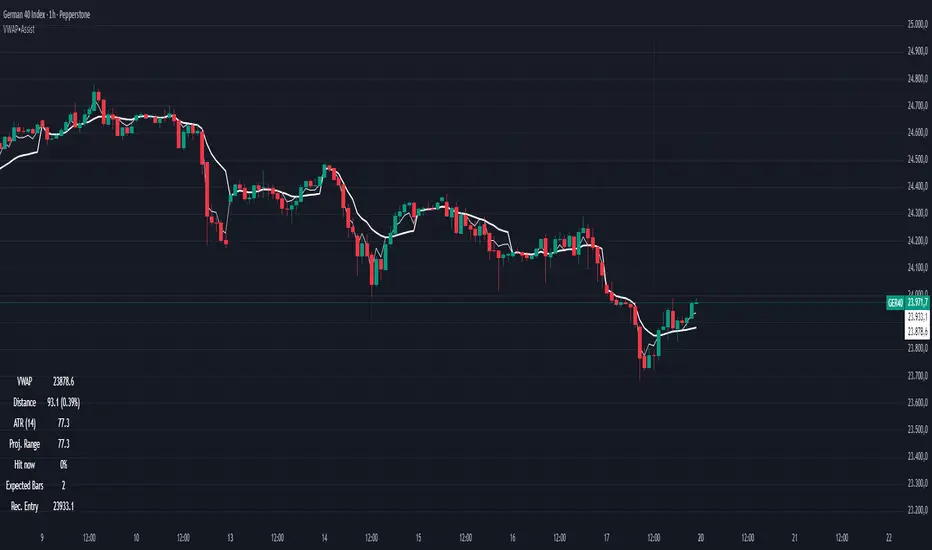
VWAP Entry Assistant (v1.0)Description:
Anchored VWAP with a lightweight assistant for VWAP reversion trades.
It shows the distance to VWAP, an estimated hit probability for the current bar, the expected number of bars to reach VWAP, and a recommended entry price.
If the chance of touching VWAP is low, the script suggests an adjusted limit using a fraction of ATR.
The VWAP line is white by default, and a compact summary table appears at the bottom-left.
Educational tool. Not financial advice. Not affiliated with TradingView or any exchange. Always backtest before use.
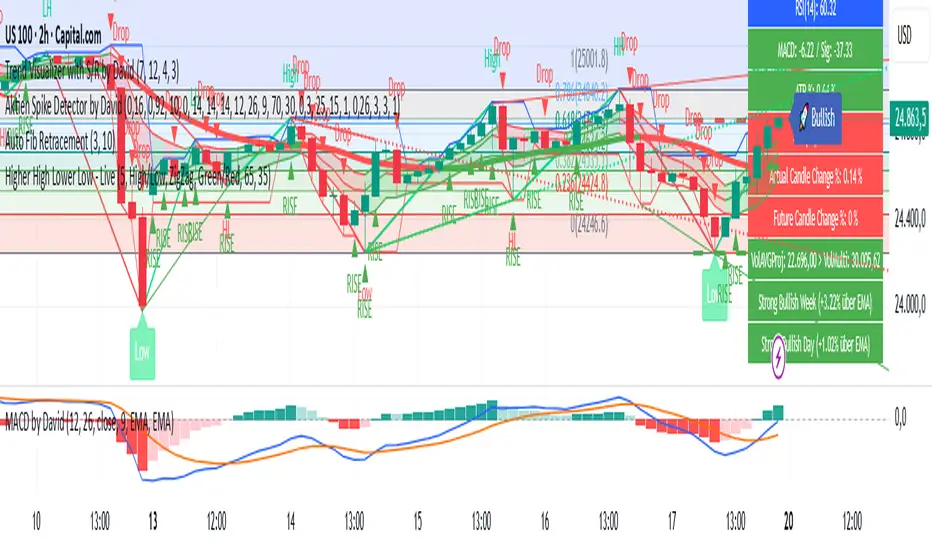
Aktien Spike Detector by DavidDescription:
This indicator marks the daily high and low on the chart and provides a visual and audible alert whenever the current price touches either of these levels. Additionally, the indicator highlights the candlestick that reaches the daily high or low to quickly identify significant market movements or potential reversal points.
Features:
📈 Daily high and low are automatically calculated and displayed as lines on the chart.
🔔 Alert notification when the price touches the daily high or low.
🕯️ Highlighting of the touch candlestick (e.g., color-coded) for better visual orientation.
💡 Ideal for traders trading breakouts, rejections, or intraday reversals.
Areas of application:
Perfect for day traders, scalpers, and intraday analysts who want to see precisely when the market reaches key daily levels.
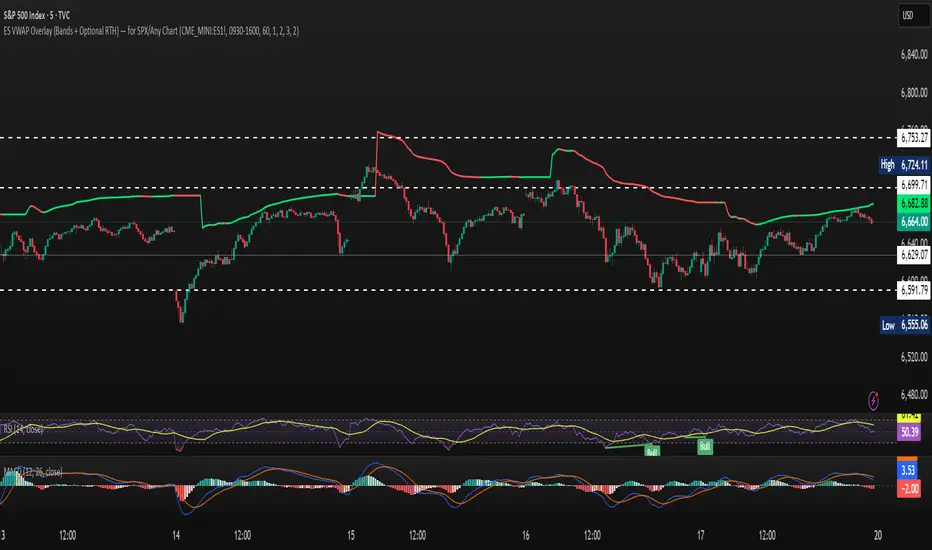
ES VWAP Overlay for SPX VWAP indicator for SPX. Since SPX does not have volume (index) it's using /es to mimic SPX volume. I find it good for day trading
Master Trend Strategy - by jake_thebossMaster Trend Strategy
This strategy combines multiple technical indicators to identify high-probability trend entries across all asset classes.
Core Signal Logic:
Entry triggered when EMA 4 crosses above/below EMA 5
Confirmation required from RSI (>50 for long, <50 for short)
Price must be above/below key moving averages: EMA 21, SMA 50, EMA 55, EMA 89, and EMA 750
Additional confirmation from Stochastic (>52 bullish, <48 bearish) or EMA 89 breakout or VWAP cross
Key Features:
VWAP filter: Only takes bullish signals above VWAP and bearish signals below VWAP
Optional pyramiding: Allows multiple entries in the same direction (up to 200 orders)
Individual stop loss and take profit management for each pyramid level
Time filter: Customizable trading hours with timezone offset
Risk management: Adjustable stop loss (default 0.3%) and take profit (default 0.6%)
Visualization:
Entry, stop loss, and take profit levels drawn as horizontal lines
Customizable signal markers (triangles) for bull/bear entries
Optional EMA overlay display
The strategy is designed for trend-following on lower timeframes, with strict multi-indicator confirmation to filter out false signals.

MACD + Supertrend + DEMA StrategySTRATEGY 📊 STRATEGY LOGIC:
Long Entry: When ALL of these occur simultaneously:
MACD histogram crosses above 0
Supertrend is bullish (green)
Short DEMA > Long DEMA
Short Entry: When ALL of these occur simultaneously:
MACD histogram crosses below 0
Supertrend is bearish (red)
Short DEMA < Long DEMA
Exits: Based on your TP/SL percentages from entry price
This follows the same clean structure as your MACD strategy but adds the alignment concept and proper risk management!

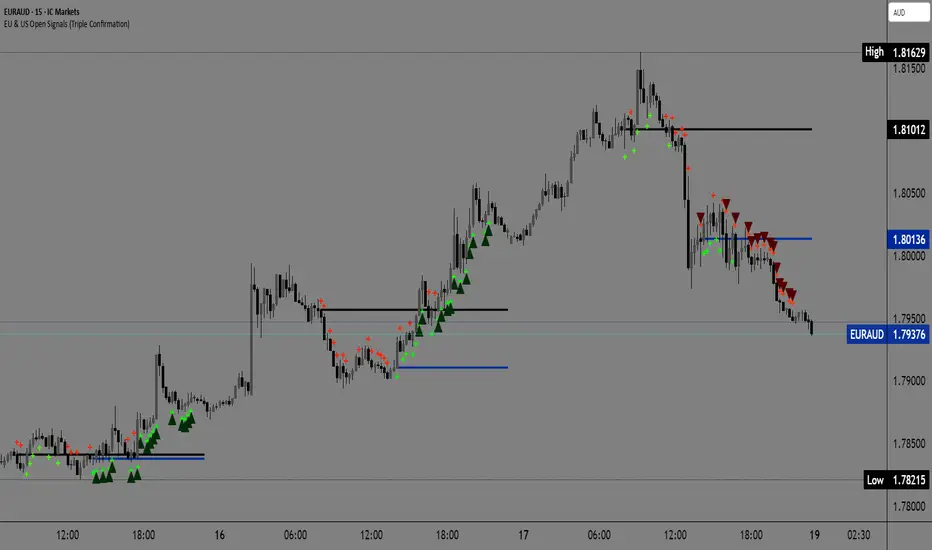
EU & US Open Signals (Triple Confirmation)🚀 EU & US Open Signals: Triple Confirmation Breakouts
💡 What This Indicator Does
This indicator plots the opening prices of the European (EU) and American (US) trading sessions as key daily support/resistance levels. Its main function is to generate three distinct levels of signals based on the breakout of these levels, strictly filtered by candlestick type.
The goal is to easily spot market momentum following the opening of the major trading sessions.
🔑 Key Features
1. Daily Session Levels
The indicator plots two crucial horizontal lines that reset daily:
EU Open (Black Line): The European session opening price (Default: 06:00 UTC).
US Open (Dark Blue Line): The American session opening price (Default: 12:00 UTC).
2. Triple Signaling Logic
All signals are only generated if the breakout candle is bullish (for Buy) or bearish (for Sell), and only within your set trading hours.
Logic I. EU Single Break
Condition: Close breaks above/below the EU Open Level + Bullish/Bearish candle.
Visual Plot: Small Cross (Green for Buy / Red for Sell).
Meaning: Early signal focused on EU session momentum.
Logic II. US Single Break
Condition: Close breaks above/below the US Open Level + Bullish/Bearish candle.
Visual Plot: Small Cross (Green for Buy / Red for Sell).
Meaning: Signal focused on US session momentum.
Logic III. Double Break (HIGH CONFIRMATION)
Condition: Close breaks above Both Levels (EU and US) for Buy, or below Both Levels for Sell + Bullish/Bearish candle.
Visual Plot: Large Triangle (Dark Green/Red).
⚠️ Crucial: This is the strongest signal, indicating strong momentum as both key daily levels have been broken.
⚙️ Simple Settings
Easily customize the indicator to fit your strategy:
EU/US Session Open Hour (UTC): Set the exact session open times.
Time Zone: Select your time zone for accurate level calculation.
Start/End Trading Hour: Define the daily window for when signals will be active.
🎯 Recommended Use
High Confidence: Focus on the Double Break (Logic III) - Large Triangle for your most confirmed entries.
Context: Use the Single Break signals (I and II) to confirm early market bias.
Risk: The Open Levels can serve as natural points for setting Stop-Loss orders.
Disclaimer: Trading carries risk. This tool is for analysis purposes only. Use it at your own discretion.
Khusan Pullback & Mean-Reversion (Manual ADX, Clean)Description
The indicator combines two logics in one tool:
Trend Pullback: Entries in the direction of the dominant trend after a short-term pullback to the EMA.
Return to the mean (Mean-Reversal): countertrend trades from external Bollinger bands with an RSI filter.
Key Features
Manual ADX (Wilder calculation): more precisely, it controls the strength of the trend without hidden smoothing.
There is a clear separation of market modes: the background of the chart highlights the condition: trend up/down or sideways (range).
Signal tags: Long TPB / Short TPB for pullbacks in the trend, Long MR / Short MR for a return to the average.
A minimum of “noise": neat colors, clear captions, without unnecessary graphics.
How to read signals
Trend Pullback
Long TPB — ADX ≥ threshold, price returns above fast EMA, RSI > 45.
Short TPB — ADX ≥ threshold, price goes below fast EMA, RSI < 55.
Mean-Reversion
Long MR — sideways (ADX < threshold), price below lower BB, RSI < 30, confirmation of reversal.
Short MR — sideways (ADX < threshold), price above upper BB, RSI > 70, reversal confirmation.
Parameters (Inputs)
EMA fast / EMA slow — fast and slow EMA (default 20/50).
ADX length / threshold — period and trend strength threshold.
BB length / mult — period and Bollinger Bands multiplier.
RSI length — RSI period.
Show labels/background — enable mode signatures and highlighting.
Recommendations for use
Timeframes: from M15 to H4. On lower TF, add a filter by the higher trend (e.g. H1/H4 EMA).
Instruments: XAUUSD, FX majors, indices, liquid futures and crypto pairs.
Risk management: for TPB, use SL behind the local swing extremum/below the EMA zone; for MR, use SL behind the external BB.
Filters: avoid entering against strong news; prioritize MR when volatility is low, and TPB when volatility is high.
Alerts
Create standard alerts based on the appearance of Long/Short TPB and Long/Short MR labels — the indicator provides clear conditions for auto-entry/notifications.
Important
The indicator is not
