AymaN Entry Signal – With HTF + Pin Bar + Multi TP + BE + V1Ayman Entry Signal – Indicator Description
Overview
Ayman Entry Signal – With HTF + Pin Bar + Multi TP + BE + Stats Panel (V1)
This is a professional-grade Pine Script indicator designed for scalping and intraday trading, with full trade management, multi-confirmation logic, and advanced visualization. The tool is ideal for traders focused on XAUUSD (Gold), Forex, and other volatile instruments who seek both precision entries and structured exits with dynamic risk control.
Main Features
Advanced Entry Logic:
- EMA fast/slow crossovers (configurable)
- Optional conditions: Break of Structure (BoS), Order Block (OB), Fair Value Gap (FVG), Liquidity sweeps, Pin Bars
- HTF confirmation using EMA or BoS
- Real-time entry condition display
Trade Management:
- Dynamic calculation of Entry, SL (with ATR buffer), TP1, TP2
- Supports Partial Close and Break Even logic after TP1
- Visual PnL label (dynamic and color-coded)
Statistics Panel:
- Shows total trades, win/loss/breakeven count, cumulative PnL
- Filter by custom date or session
- Fully customizable panel appearance
Trade Visualization:
- Trade box includes all trade levels (Entry, SL, TP1, TP2)
- Visual display of trade conditions and PnL result
- Option to keep previous trades on chart
Alert System:
- Alerts for Buy and Sell entries
- Compatible with webhook automation systems like MT5/MT4
Customization & Inputs
- Capital & risk per trade
- Value per pip/point
- SL buffer (ATR-based)
- Manual EMA override
- Enable/disable: EMA, BoS, OB, FVG, Liquidity, Pin Bars
- HTF: timeframe + confirmation logic
- Trade box/labels visibility
- Full color customization
- PnL label position: top, center, or bottom
Recommended Use
- Ideal for Gold scalping (XAUUSD), also effective for Forex
- Best on 1m–15m charts; use HTF confirmation from 15m–4H
- Pairs well with semi-automated systems using alerts and webhooks
Disclaimer
Note: This is a non-executing indicator. It does not place trades but provides visual and statistical guidance for professional manual or semi-automated trading.
Pesquisar nos scripts por "纳斯达克指数期货cfd"

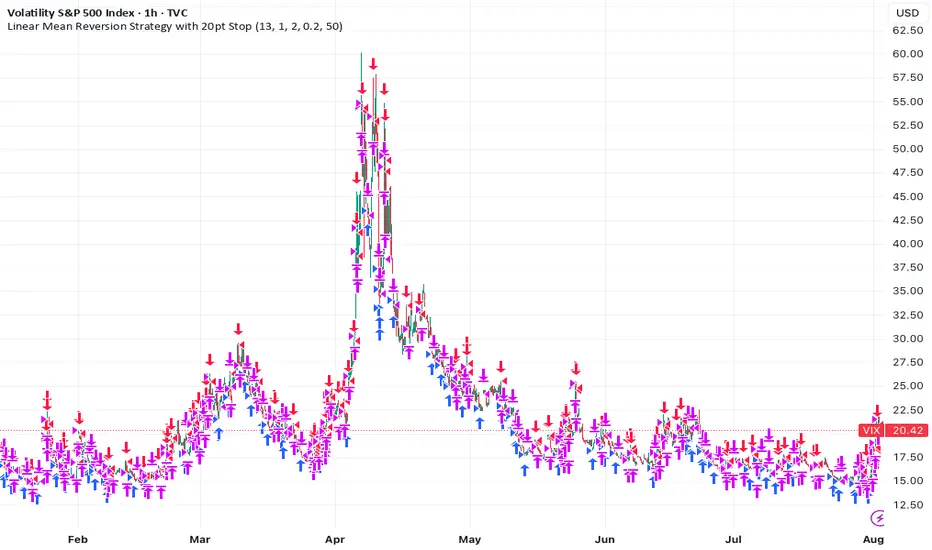
Linear Mean Reversion Strategy📘 Strategy Introduction: Linear Mean Reversion with Fixed Stop
This strategy implements a simple yet powerful mean reversion model that assumes price tends to oscillate around a dynamic average over time. It identifies statistically significant deviations from the moving average using a z-score, and enters trades expecting a return to the mean.
🧠 Core Logic:
A z-score is calculated by comparing the current price to its moving average, normalized by standard deviation, over a user-defined half-life window.
Trades are entered when the z-score crosses a threshold (e.g., ±1), signaling overbought or oversold conditions.
The strategy exits positions either when price reverts back near the mean (z-score close to 0), or if a fixed stop loss of 100 points is hit, whichever comes first.
⚙️ Key Features:
Dynamic mean and volatility estimation using moving average and standard deviation
Configurable z-score thresholds for entry and exit
Position size scaling based on z-score magnitude
Fixed stop loss to control risk and avoid prolonged drawdowns
🧪 Use Case:
Ideal for range-bound markets or assets that exhibit stationary behavior around a mean, this strategy is especially useful on assets with mean-reverting characteristics like currency pairs, ETFs, or large-cap stocks. It is best suited for traders looking for short-term reversions rather than long-term trends.
Entry HelperEntry Helper is a precision tool designed to enhance clarity and support decision-making in fast-paced trading environments.
It adapts intelligently to different timeframes, offering visual guidance based on your chosen context — without the need to manually adjust settings.
Specially optimized for scalping assets like XAUUSD, NASDAQ, and SP500, it delivers exactly what you need, when you need it.
⚡ Just switch the chart… and it adjusts itself.
Developed by WAKEUP | Maggifx

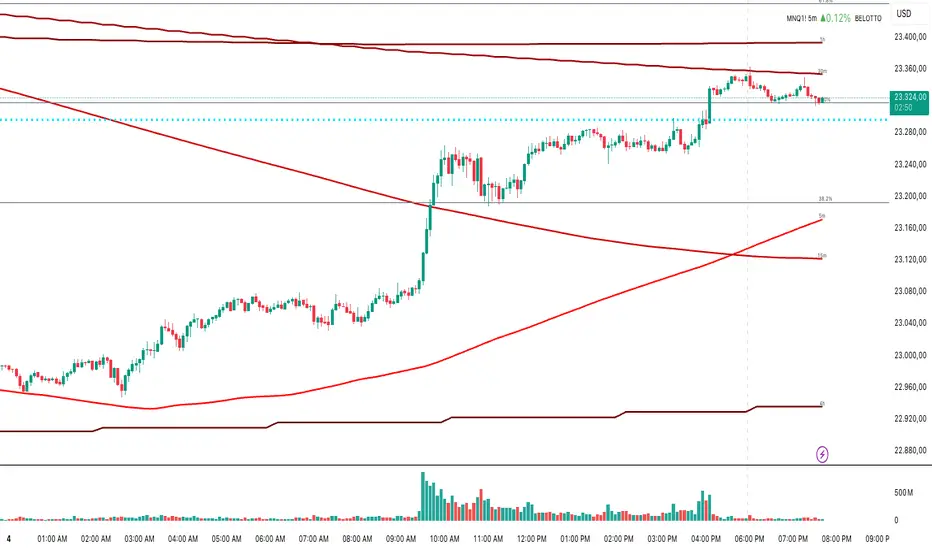
Multi-Timeframe MA 200Multi-Timeframe MA 200
This powerful tool plots the 200-period Moving Average across multiple timeframes (5m, 15m, 30m, 1h, 4h, Daily) directly on your active chart. You can switch between SMA (Simple Moving Average) and EMA (Exponential Moving Average) for all timeframes at once.
Key features:
✅ 100% accurate calculation using the original timeframe
✅ Option to choose SMA or EMA
✅ Visual smoothing for cleaner display
✅ Floating labels showing the origin timeframe
✅ Clean interface – no clutter or legends
✅ Ideal for scalping, intraday, and swing traders
Developed by BELOTTO TRADER, founder of the CLUBE DO GAIN – one of the most engaged trading communities in the Portuguese-speaking world.
Time-Price Velocity [QuantAlgo]🟢 Overview
The Time-Price Velocity indicator uses advanced velocity-based analysis to measure the rate of price change normalized against typical market movement, creating a dynamic momentum oscillator that identifies market acceleration patterns and momentum shifts. Unlike traditional momentum indicators that focus solely on price change magnitude, this indicator incorporates time-weighted displacement calculations and ATR normalization to create a sophisticated velocity measurement system that adapts to varying market volatility conditions.
This indicator displays a velocity signal line that oscillates around zero, with positive values indicating upward price velocity and negative values indicating downward price velocity. The signal incorporates acceleration background columns and statistical normalization to help traders identify momentum shifts and potential reversal or continuation opportunities across different timeframes and asset classes.
🟢 How It Works
The indicator's key insight lies in its time-price velocity calculation system, where velocity is measured using the fundamental physics formula:
velocity = priceChange / timeWeight
The system normalizes this raw velocity against typical price movement using Average True Range (ATR) to create market-adjusted readings:
normalizedVelocity = typicalMove > 0 ? velocity / typicalMove : 0
where "typicalMove = ta.atr(lookback)" provides the baseline for normal price movement over the specified lookback period.
The Time-Price Velocity indicator calculation combines multiple sophisticated components. First, it calculates acceleration as the change in velocity over time:
acceleration = normalizedVelocity - normalizedVelocity
Then, the signal generation applies EMA smoothing to reduce noise while preserving responsiveness:
signal = ta.ema(normalizedVelocity, smooth)
This creates a velocity-based momentum indicator that combines price displacement analysis with statistical normalization, providing traders with both directional signals and acceleration insights for enhanced market timing.
🟢 How to Use
1. Signal Interpretation and Threshold Zones
Positive Values (Above Zero): Time-price velocity indicating bullish momentum with upward price displacement relative to normalized baseline
Negative Values (Below Zero): Time-price velocity indicating bearish momentum with downward price displacement relative to normalized baseline
Zero Line Crosses: Velocity transitions between bullish and bearish regimes, indicating potential trend changes or momentum shifts
Upper Threshold Zone: Area above positive threshold (default 1.0) indicating strong bullish velocity and potential reversal point
Lower Threshold Zone: Area below negative threshold (default -1.0) indicating strong bearish velocity and potential reversal point
2. Acceleration Analysis and Visual Features
Acceleration Columns: Background histogram showing velocity acceleration (the rate of change of velocity), with green columns indicating accelerating velocity and red columns indicating decelerating velocity. The interpretation depends on trend context: red columns in downtrends indicate strengthening bearish momentum, while red columns in uptrends indicate weakening bullish momentum
Acceleration Column Height: The height of each column represents the magnitude of acceleration, with taller columns indicating stronger acceleration or deceleration forces
Bar Coloring: Optional price bar coloring matches velocity direction for immediate visual trend confirmation
Info Table: Real-time display of current velocity and acceleration values with trend arrows and change indicators
3. Additional Features:
Confirmed vs Live Data: Toggle between confirmed (closed) bar analysis for stable signals or current bar inclusion for real-time updates
Multi-timeframe Adaptability: Velocity normalization ensures consistent readings across different chart timeframes and asset volatilities
Alert System: Built-in alerts for threshold crossovers and direction changes
🟢 Examples with Preconfigured Settings
Default : Balanced configuration suitable for most timeframes and general trading applications, providing optimal balance between sensitivity and noise filtering for medium-term analysis.
Scalping : High sensitivity setup with shorter lookback period and reduced smoothing for ultra-short-term trades on 1-15 minute charts, optimized for capturing rapid momentum shifts and frequent trading opportunities.
Swing Trading : Extended lookback period with enhanced smoothing and higher threshold for multi-day positions, designed to filter market noise while capturing significant momentum moves on 1-4 hour and daily timeframes.

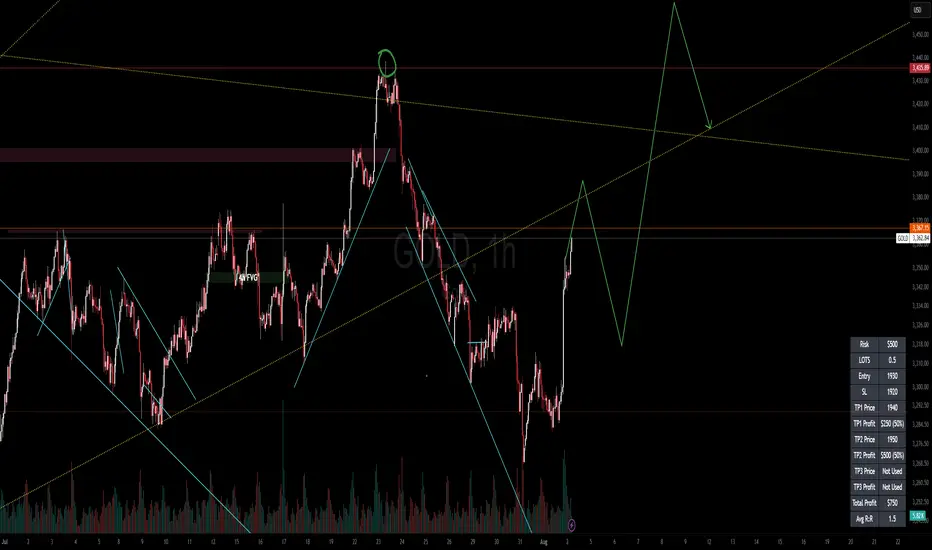
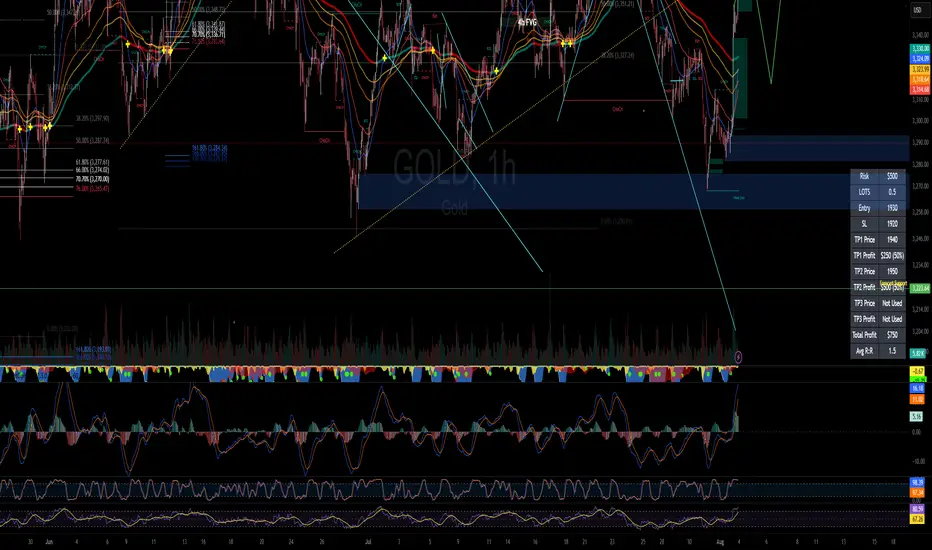
RISK MANAGEMENT CALCULATOR V3📊 RISK MANAGEMENT CALCULATOR – Lot Size, Profit & R:R Tool
This script is designed to help traders instantly calculate lot size, expected profit, and risk/reward ratio based on their trade plan.
✅ Features:
Input your Risk Amount ($), Entry, Stop Loss, and up to 3 Take Profits
Calculates:
✅ Lot Size based on risk
✅ Split profits per TP level (equally weighted)
✅ Total Profit & Risk/Reward (R:R)
Displays everything in a clean bottom-right table
Optimized for both:
🖥️ Desktop mode (larger layout)
📱 Mobile mode (toggle compact view)
💡 How to Use:
Enter your planned Entry, Stop Loss, and Risk Amount
Set any TP1, TP2, or TP3 prices (set TP to 0 if not used)
The system will auto-compute your ideal lot size and show estimated profits
🔧 Parameters:
Risk Amount ($) – how much you’re willing to lose
Entry Price – your trade entry
Stop Loss Price – your SL level
Take Profit 1/2/3 – optional TP targets
Pip Value – profit/loss per point for 1 standard lot
📱 Mobile Mode – compact the table for small screens
🔐 Notes:
No trades are executed – this is a risk planning tool only
Designed for all markets (forex, gold, indices, crypto)
TP profits are equally split (e.g. 2 TP = 50% / 50%)
RISK MANAGEMENT CALCULATOR📊 RISK MANAGEMENT CALCULATOR – Lot Size, Profit & R:R Tool
This script is designed to help traders instantly calculate lot size, expected profit, and risk/reward ratio based on their trade plan.
✅ Features:
Input your Risk Amount ($), Entry, Stop Loss, and up to 3 Take Profits
Calculates:
✅ Lot Size based on risk
✅ Split profits per TP level (equally weighted)
✅ Total Profit & Risk/Reward (R:R)
Displays everything in a clean bottom-right table
Optimized for both:
🖥️ Desktop mode (larger layout)
📱 Mobile mode (toggle compact view)
💡 How to Use:
Enter your planned Entry, Stop Loss, and Risk Amount
Set any TP1, TP2, or TP3 prices (set TP to 0 if not used)
The system will auto-compute your ideal lot size and show estimated profits
🔧 Parameters:
Risk Amount ($) – how much you’re willing to lose
Entry Price – your trade entry
Stop Loss Price – your SL level
Take Profit 1/2/3 – optional TP targets
Pip Value – profit/loss per point for 1 standard lot
📱 Mobile Mode – compact the table for small screens
🔐 Notes:
No trades are executed – this is a risk planning tool only
Designed for all markets (forex, gold, indices, crypto)
TP profits are equally split (e.g. 2 TP = 50% / 50%)
Mara JPY Strength (USDJPY+EURJPY+GBPJPY)/3 + DXYJPY, USDJPY, EURJPY, GBPJPY, smart money, bias, index, forex indicator, DXY, strength meter, professional, trading tool, price action

Mara JPY Bias ProMara JPY Bias Pro™ is a precision tool built for serious traders who focus on JPY and USD pairs.
This synthetic index combines USDJPY + EURJPY + GBPJPY, generating a smooth and dynamic representation of JPY strength or weakness. When the line turns green, JPY is weakening — time to look for LONG setups on XXX/JPY pairs. When red, JPY is strengthening — ideal moment for SHORT trades.
Built-in bias logic with adjustable MA-based trend detection or slope/momentum view lets you customize signals based on your strategy.
Plus, we’ve included a normalized DXY overlay, so you can track USD strength in parallel — perfect for traders working with EUR/USD, GBP/USD, USD/JPY and JPY crosses.
💡 Designed for day traders, scalpers, and smart money traders looking for clean confluence.
✅ Features:
Visual color-coded JPY bias (Green = Long / Red = Short)
Optional USD (DXY) strength overlay
Customizable MA length and bias logic
Built-in alerts for bias shifts & momentum flips
🔔 Alert-ready – never miss a reversal.
Trade smarter. Cut the noise. Stay on the right side of the move.


Step 3: Multi-Timeframe Trading SessionsFor editing purposes,
This is for editing purposes for developer to edit it before publishing.

ICT OTE Market MakerICT OTE Market Maker
Implementing ICT and automatically identifies OTE zones to minimize drawdowns.
XAUUSD & BTCUSD Buy/Sell Signals (80% Accuracy)this script gives approx 80% real and correct indicators depending on market

Buy/Sell Demand Pressure SMAThis indicator shows when competing buying and selling pressure has changed.
When bullish buying offsets bearish transaction volume, the indicator turns green. When bearish selling pressure offsets bullish buying volume the indicator is red.
Can be used as a normal SMA or to confirm buy/sell signals of other indicators.
Works best at the start of trades...and not exits but if set properly, it is a good indicator of when a trend has reversed.
~ jb tuttle

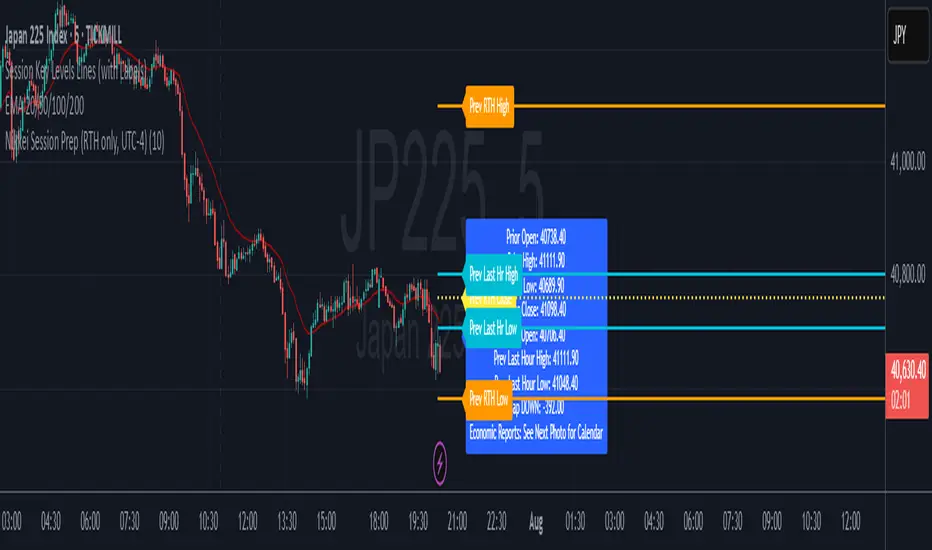
Nikkei Premarket High/Low LabelThis is Nikkei Premarket High/Low Label. shows you the premarket high and low. hope it helps :)
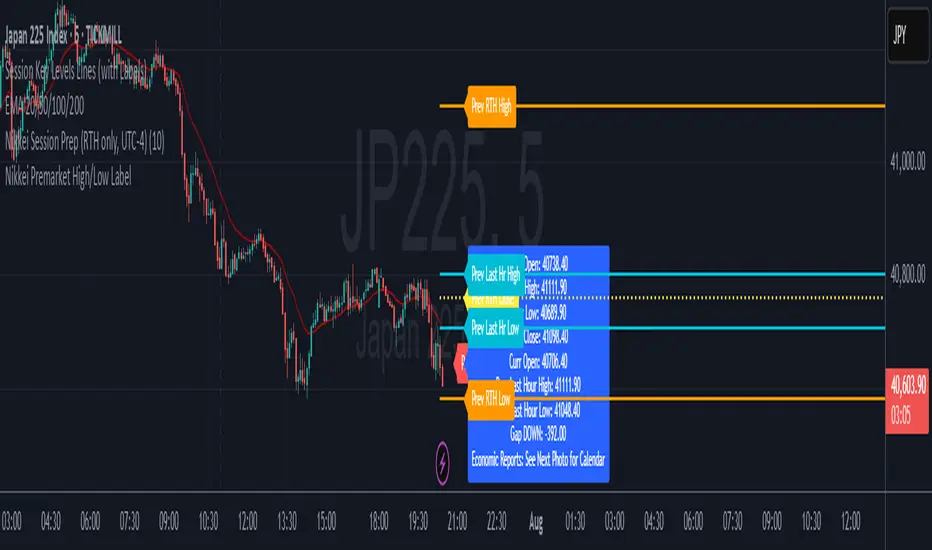
Nikkei Session Prep (RTH only, UTC-4)This is Nikkei Session Prep (RTH only, UTC-4). hope it helps :)
Donchian + Keltner Channel Strategy with Stops & Alerts BY GOUNIThis script combines Donchian Channels and Keltner Channels to identify potential buy and sell opportunities on the chart. It provides clear visual cues and includes volume labels and dynamic stop loss levels for better trading insights.

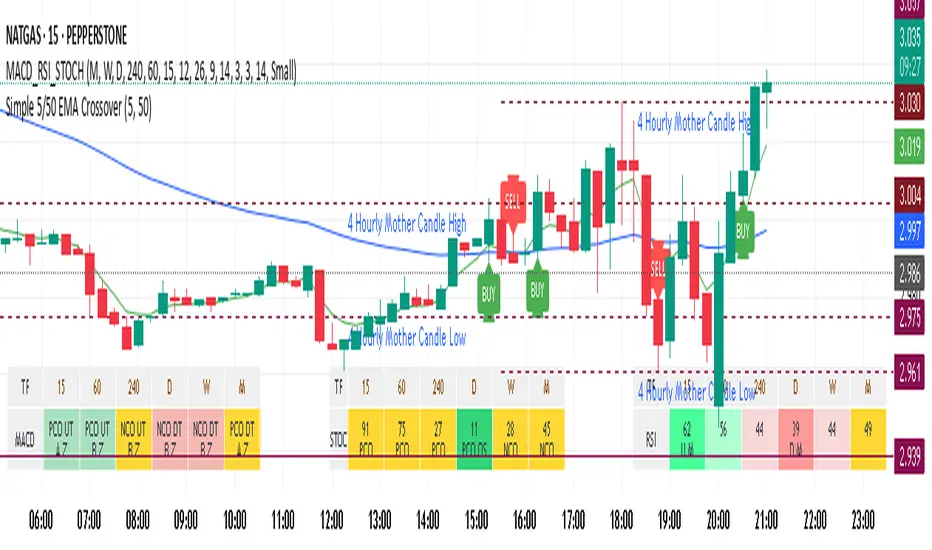
MTF Clean Panelsit is bigger model of a earlier model then i have made earlier it helps you see multiple timeframes together and includes more daily timeframe and have also been introduced a new 4 hours candle structure

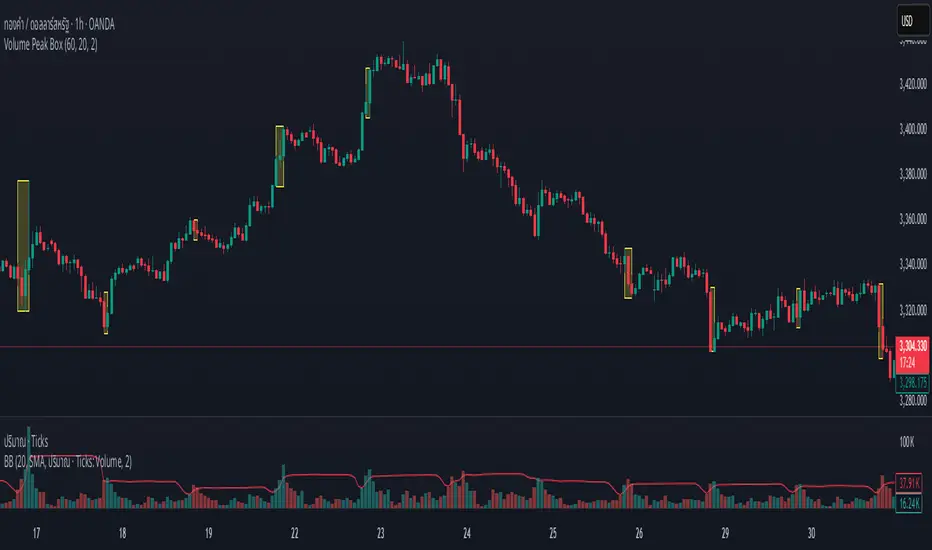
Volume Peak BoxTH Description
Volume Peak Box
อินดิเคเตอร์นี้ใช้ตรวจจับช่วงที่มี Volume สูงผิดปกติ โดยใช้ Bollinger Band กับข้อมูล Volume ที่ดึงจาก Timeframe ที่ล็อกไว้ (เช่น 1 ชั่วโมง) และจะแสดงผลในรูปแบบ กล่องครอบช่วงราคาสูง–ต่ำ ของช่วง Volume Peak นั้น
🔧 วิธีทำงาน:
คำนวณ Bollinger Band จาก Volume ของ Timeframe ที่กำหนด
ถ้า Volume สูงกว่า Upper Band → ถือว่าเป็น Volume Peak
วาดกล่องครอบ High–Low ของแท่งที่อยู่ในช่วง Volume Peak
กล่องจะแสดงบนทุก Timeframe แต่ใช้ข้อมูลจาก Timeframe ที่ล็อกไว้เท่านั้น
🧠 เหมาะสำหรับการดู:
โซน Breakout
การเคลื่อนไหวของสถาบัน
ความไม่สมดุลของอุปสงค์/อุปทาน
เหมาะมากหากใช้ร่วมกับการอ่านพฤติกรรมราคาใน Timeframe ย่อย เพื่อดูปฏิกิริยาราคาต่อแรง Volume จาก Timeframe ใหญ่
________________
ENG Description
Volume Peak Box
This indicator detects volume spikes based on Bollinger Bands applied to volume from a locked timeframe (e.g. 1H), and draws a box around the price range during those peak periods.
🔧 How it works:
Calculates Bollinger Bands on volume from the selected timeframe.
If volume exceeds the upper band, it is marked as a volume peak.
When a volume peak starts and ends, the indicator draws a box covering the high–low price range during that period.
These boxes remain visible on all timeframes, but always reflect data from the locked timeframe.
🧠 Great for identifying:
Breakout zones
Institutional activity
Supply/demand imbalances
Tip: Use with lower timeframe price action to see how the market reacts near volume peaks from higher timeframes.
EMA 20/50/200 - M3EDGE Clean Mode™The M3EDGE Clean Mode™ indicator is designed to spot the cleanest, most aligned market phases.
It filters out market noise and highlights only the high-probability trending zones where the odds are in your favor.
How it works:
• Tracks 3 key EMAs (20, 50, 200)
• Confirms directional alignment across short, medium, and long-term trends
• Colors optimal market phases to identify high-probability setups
• Optional display of the dynamic EMA50/EMA200 zone to visualize the trend’s core
Purpose:
🎯 Avoid choppy, sideways market conditions
🎯 Focus only on smooth, directional price moves
🎯 Reduce false signals and improve chart clarity
Best use cases:
• Ideal for scalping, day trading, and swing trading
• Works on all markets: indices, commodities, forex, crypto
• Perfect when combined with macro analysis and other M3EDGE™ setups
💡 Pro tip: The M3EDGE Clean Mode™ isn’t just another indicator — it’s a quality filter that keeps you out of messy conditions. When it lights up, you know the road ahead is clear.
