Multi-Strategy Trading Screener SummaryI only combined famous scripts, all thanks to wonderful scripts and community out there .
ThankYou !
------
Core Architecture
Multi-Symbol Analysis: Tracks up to 5 configurable tickers simultaneously
Multi-Timeframe Support: Each symbol can use different timeframes
Real-Time Dashboard: Color-coded table displaying all signals and analysis
Trend Validation: All signals include trend alignment confirmation
Integrated Trading Strategies
1. Breaker Blocks (Order Blocks)
Detects institutional order blocks using swing analysis
Tracks when blocks are broken and become "breaker blocks"
Monitors retests of broken levels
Shows trend alignment (✓ aligned, ⚠️ misaligned)
2. Chandelier Exit
ATR-based trend-following exit system
Provides BUY/SELL signals based on dynamic stop levels
Uses configurable ATR multiplier and lookback period
3. Smart Money Breakout
Channel breakout detection with volatility normalization
Identifies accumulation/distribution phases
Generates persistent BUY/SELL signals on breakouts
4. Trendline Breakout
Dynamic trendline detection using pivot highs/lows
Calculates trendline slopes and breakout points
Provides BUY signals on upward breaks, SELL on downward breaks
Dashboard Columns Explained
Symbol: Ticker being analyzed
Trend: Overall SuperTrend direction (🟢 UP / 🔴 DOWN / ⚪ FLAT)
Timeframe: Analysis timeframe with clock icon
Breaker Block: Type (Bullish/Bearish) with trend alignment indicator
Status: Price position relative to breaker block (Inside/Approaching/Far)
Retests: Number of times the broken level was retested (indicates level strength)
Volume: Volume associated with the order block formation
Chandelier: BUY/SELL signals from Chandelier Exit strategy
Smart Money: BUY/SELL signals from breakout detection
Trendline: BUY/SELL signals from trendline breakouts
Key Features
No HOLD States: All signals show definitive BUY (🟢) or SELL (🔴) only
Persistent Signals: Signals remain active until opposite conditions trigger
Color Coding: Visual distinction between bullish (green) and bearish (red) signals
Trend Alignment: Enhanced accuracy through trend confirmation logic
This screener provides a comprehensive view of market conditions across multiple strategies, helping identify high-probability trading opportunities when signals align.
Pesquisar nos scripts por "文华财经tick价格"

Live Market - Performance MonitorLive Market — Performance Monitor
Study material (no code) — step-by-step training guide for learners
________________________________________
1) What this tool is — short overview
This indicator is a live market performance monitor designed for learning. It scans price, volume and volatility, detects order blocks and trendline events, applies filters (volume & ATR), generates trade signals (BUY/SELL), creates simple TP/SL trade management, and renders a compact dashboard summarizing market state, risk and performance metrics.
Use it to learn how multi-factor signals are constructed, how Greeks-style sensitivity is replaced by volatility/ATR reasoning, and how a live dashboard helps monitor trade quality.
________________________________________
2) Quick start — how a learner uses it (step-by-step)
1. Add the indicator to a chart (any ticker / timeframe).
2. Open inputs and review the main groups: Order Block, Trendline, Signal Filters, Display.
3. Start with defaults (OB periods ≈ 7, ATR multiplier 0.5, volume threshold 1.2) and observe the dashboard on the last bar.
4. Walk the chart back in time (use the last-bar update behavior) and watch how signals, order blocks, trendlines, and the performance counters change.
5. Run the hands-on labs below to build intuition.
________________________________________
3) Main configurable inputs (what you can tweak)
• Order Block Relevant Periods (default ~7): number of consecutive candles used to define an order block.
• Min. Percent Move for Valid OB (threshold): minimum percent move required for a valid order block.
• Number of OB Channels: how many past order block lines to keep visible.
• Trendline Period (tl_period): pivot lookback for detecting highs/lows used to draw trendlines.
• Use Wicks for Trendlines: whether pivot uses wicks or body.
• Extension Bars: how far trendlines are projected forward.
• Use Volume Filter + Volume Threshold Multiplier (e.g., 1.2): requires volume to be greater than multiplier × average volume.
• Use ATR Filter + ATR Multiplier: require bar range > ATR × multiplier to filter noise.
• Show Targets / Table settings / Colors for visualization.
________________________________________
4) Core building blocks — what the script computes (plain language)
Price & trend:
• Spot / LTP: current close price.
• EMA 9 / 21 / 50: fast, medium, slow moving averages to define short/medium trend.
o trend_bullish: EMA9 > EMA21 > EMA50
o trend_bearish: EMA9 < EMA21 < EMA50
o trend_neutral: otherwise
Volatility & noise:
• ATR (14): average true range used for dynamic target and filter sizing.
• dynamic_zone = ATR × atr_multiplier: minimum bar range required for meaningful move.
• Annualized volatility: stdev of price changes × sqrt(252) × 100 — used to classify volatility (HIGH/MEDIUM/LOW).
Momentum & oscillators:
• RSI 14: overbought/oversold indicator (thresholds 70/30).
• MACD: EMA(12)-EMA(26) and a 9-period signal line; histogram used for momentum direction and strength.
• Momentum (ta.mom 10): raw momentum over 10 bars.
Mean reversion / band context:
• Bollinger Bands (20, 2σ): upper, mid, lower.
o price_position measures where price sits inside the band range as 0–100.
Volume metrics:
• avg_volume = SMA(volume, 20) and volume_spike = volume > avg_volume × volume_threshold
o volume_ratio = volume / avg_volume
Support & Resistance:
• support_level = lowest low over 20 bars
• resistance_level = highest high over 20 bars
• current_position = percent of price between support & resistance (0–100)
________________________________________
5) Order Block detection — concept & logic
What it tries to find: a bar (the base) followed by N candles in the opposite direction (a classical order block setup), with a minimum % move to qualify. The script records the high/low of the base candle, averages them, and plots those levels as OB channels.
How learners should think about it (conceptual):
1. An order block is a signature area where institutions (theory) left liquidity — often seen as a large bar followed by a sequence of directional candles.
2. This indicator uses a configurable number of subsequent candles to confirm that the pattern exists.
3. When found, it stores and displays the base candle’s high/low area so students can see how price later reacts to those zones.
Implementation note for learners: the tool keeps a limited history of OB lines (ob_channels). When new OBs exceed the count, the oldest lines are removed — good practice to avoid clutter.
________________________________________
6) Trendline detection — idea & interpretation
• The script finds pivot highs and lows using a symmetric lookback (tl_period and half that as right/left).
• It then computes a trendline slope from successive pivots and projects the line forward (extension_bars).
• Break detection: Resistance break = close crosses above the projected resistance line; Support break = close crosses below projected support.
Learning tip: trendlines here are computed from pivot points and time. Watch how changing tl_period (bigger = smoother, fewer pivots) alters the trendlines and break signals.
________________________________________
7) Signal generation & filters — step-by-step
1. Primary triggers:
o Bullish trigger: order block bullish OR resistance trendline break.
o Bearish trigger: bearish order block OR support trendline break.
2. Filters applied (both must pass unless disabled):
o Volume filter: volume must be > avg_volume × volume_threshold.
o ATR filter: bar range (high-low) must exceed ATR × atr_multiplier.
o Not in an existing trade: new trades only start if trade_active is false.
3. Trend confirmation:
o The primary trigger is only confirmed if trend is bullish/neutral for buys or bearish/neutral for sells (EMA alignment).
4. Result:
o When confirmed, a long or short trade is activated with TP/SL calculated from ATR multiples.
________________________________________
8) Trade management — what the tool does after a signal
• Entry management: the script marks a trade as trade_active and sets long_trade or short_trade flags.
• TP & SL rules:
o Long: TP = high + 2×ATR ; SL = low − 1×ATR
o Short: TP = low − 2×ATR ; SL = high + 1×ATR
• Monitoring & exit:
o A trade closes when price reaches TP or SL.
o When TP/SL hit, the indicator updates win_count and total_pnl using a very simple calculation (difference between TP/SL and previous close).
o Visual lines/labels are drawn for TP and updated as the trade runs.
Important learner notes:
• The script does not store a true entry price (it uses close in its P&L math), so PnL is an approximation — treat this as a learning proxy, not a position accounting system.
• There’s no sizing, slippage, or fee accounted — students must manually factor these when translating to real trades.
• This indicator is not a backtesting strategy; strategy.* functions would be needed for rigorous backtest results.
________________________________________
9) Signal strength & helper utilities
• Signal strength is a composite score (0–100) made up of four signals worth 25 points each:
1. RSI extreme (overbought/oversold) → 25
2. Volume spike → 25
3. MACD histogram magnitude increasing → 25
4. Trend existence (bull or bear) → 25
• Progress bars (text glyphs) are used to visually show RSI and signal strength on the table.
Learning point: composite scoring is a way to combine orthogonal signals — study how changing weights changes outcomes.
________________________________________
10) Dashboard — how to read each section (walkthrough)
The dashboard is split into sections; here's how to interpret them:
1. Market Overview
o LTP / Change%: immediate price & daily % change.
2. RSI & MACD
o RSI value plus progress bar (overbought 70 / oversold 30).
o MACD histogram sign indicates bullish/bearish momentum.
3. Volume Analysis
o Volume ratio (current / average) and whether there’s a spike.
4. Order Block Status
o Buy OB / Sell OB: the average base price of detected order blocks or “No Signal.”
5. Signal Status
o 🔼 BUY or 🔽 SELL if confirmed, or ⚪ WAIT.
o No-trade vs Active indicator summarizing market readiness.
6. Trend Analysis
o Trend direction (from EMAs), market sentiment score (composite), volatility level and band/position metrics.
7. Performance
o Win Rate = wins / signals (percentage)
o Total PnL = cumulative PnL (approximate)
o Bull / Bear Volume = accumulated volumes attributable to signals
8. Support & Resistance
o 20-bar highest/lowest — use as nearby reference points.
9. Risk & R:R
o Risk Level from ATR/price as a percent.
o R:R Ratio computed from TP/SL if a trade is active.
10. Signal Strength & Active Trade Status
• Numeric strength + progress bar and whether a trade is currently active with TP/SL display.
________________________________________
11) Alerts — what will notify you
The indicator includes pre-built alert triggers for:
• Bullish confirmed signal
• Bearish confirmed signal
• TP hit (long/short)
• SL hit (long/short)
• No-trade zone
• High signal strength (score > 75%)
Training use: enable alerts during a replay session to be notified when the indicator would have signalled.
________________________________________
12) Labs — hands-on exercises for learners (step-by-step)
Lab A — Order Block recognition
1. Pick a 15–30 minute timeframe on a liquid ticker.
2. Use default OB periods (7). Mark each time the dashboard shows a Buy/Sell OB.
3. Manually inspect the chart at the base candle and the following sequence — draw the OB zone by hand and watch later price reactions to it.
4. Repeat with OB periods 5 and 10; note stability vs noise.
Lab B — Trendline break confirmation
1. Increase trendline period (e.g., 20), watch trendlines form from pivots.
2. When a resistance break is flagged, compare with MACD & volume: was momentum aligned?
3. Note false breaks vs confirmed moves — change extension_bars to see projection effects.
Lab C — Filter sensitivity
1. Toggle Use Volume Filter off, and record the number and quality of signals in a 2-day window.
2. Re-enable volume filter and change threshold from 1.2 → 1.6; note how many low-quality signals are filtered out.
Lab D — Trade management simulation
1. For each signalled trade, record the time, close entry approximation, TP, SL, and eventual hit/miss.
2. Compute actual PnL if you had entered at the open of the next bar to compare with the script’s PnL math.
3. Tabulate win rate and average R:R.
Lab E — Performance review & improvement
1. Build a spreadsheet of signals over 30–90 periods with columns: Date, Signal type, Entry price (real), TP, SL, Exit, PnL, Notes.
2. Analyze which filters or indicators contributed most to winners vs losers and adjust weights.
________________________________________
13) Common pitfalls, assumptions & implementation notes (things to watch)
• P&L simplification: total_pnl uses close as a proxy entry price. Real entry/exit prices and slippage are not recorded — so PnL is approximate.
• No position sizing or money management: the script doesn’t compute position size from equity or risk percent.
• Signal confirmation logic: composite "signal_strength" is a simple 4×25 point scheme — explore different weights or additional signals.
• Order block detection nuance: the script defines the base candle and checks the subsequent sequence. Be sure to verify whether the intended candle direction (base being bullish vs bearish) aligns with academic/your trading definition — read the code carefully and test.
• Trendline slope over time: slope is computed using timestamps; small differences may make lines sensitive on very short timeframes — using bar_index differences is usually more stable.
• Not a true backtester: to evaluate performance statistically you must transform the logic into a strategy script that places hypothetical orders and records exact entry/exit prices.
________________________________________
14) Suggested improvements for advanced learners
• Record true entry price & timestamp for accurate PnL.
• Add position sizing: risk % per trade using SL distance and account size.
• Convert to strategy. (Pine Strategy)* to run formal backtests with equity curves, drawdowns, and metrics (Sharpe, Sortino).
• Log trades to an external spreadsheet (via alerts + webhook) for offline analysis.
• Add statistics: average win/loss, expectancy, max drawdown.
• Add additional filters: news time blackout, market session filters, multi-timeframe confirmation.
• Improve OB detection: combine wick/body, volume spike at base bar, and liquidity sweep detection.
________________________________________
15) Glossary — quick definitions
• ATR (Average True Range): measure of typical range; used to size targets and stops.
• EMA (Exponential Moving Average): trend smoothing giving more weight to recent prices.
• RSI (Relative Strength Index): momentum oscillator; >70 overbought, <30 oversold.
• MACD: momentum oscillator using difference of two EMAs.
• Bollinger Bands: volatility bands around SMA.
• Order Block: a base candle area with subsequent confirmation candles; a zone of institutional interest (learning model).
• Pivot High/Low: local turning point defined by candles on both sides.
• Signal Strength: combined score from multiple indicators.
• Win Rate: proportion of signals that hit TP vs total signals.
• R:R (Risk:Reward): ratio of potential reward (TP distance) to risk (entry to SL).
________________________________________
16) Limitations & assumptions (be explicit)
• This is an indicator for learning — not a trading robot or broker connection.
• No slippage, fees, commissions or tie-in to real orders are considered.
• The logic is heuristic (rule-of-thumb), not a guarantee of performance.
• Results are sensitive to timeframe, market liquidity, and parameter choices.
________________________________________
17) Practical classroom / study plan (4 sessions)
• Session 1 — Foundations: Understand EMAs, ATR, RSI, MACD, Bollinger Bands. Run the indicator and watch how these numbers change on a single day.
• Session 2 — Zones & Filters: Study order blocks and trendlines. Test volume & ATR filters and note changes in false signals.
• Session 3 — Simulated trading: Manually track 20 signals, compute real PnL and compare to the dashboard.
• Session 4 — Improvement plan: Propose changes (e.g., better PnL accounting, alternative OB rule) and test their impact.
________________________________________
18) Quick reference checklist for each signal
1. Was an order block or trendline break detected? (primary trigger)
2. Did volume meet threshold? (filter)
3. Did ATR filter (bar size) show a real move? (filter)
4. Was trend aligned (EMA 9/21/50)? (confirmation)
5. Signal confirmed → mark entry approximation, TP, SL.
6. Monitor dashboard (Signal Strength, Volatility, No-trade zone, R:R).
7. After exit, log real entry/exit, compute actual PnL, update spreadsheet.
________________________________________
19) Educational caveat & final note
This tool is built for training and analysis: it helps you see how common technical building blocks combine into trade ideas, but it is not a trading recommendation. Use it to develop judgment, to test hypotheses, and to design robust systems with proper backtesting and risk control before risking capital.
________________________________________
20) Disclaimer (must include)
Training & Educational Only — This material and the indicator are provided for educational purposes only. Nothing here is investment advice or a solicitation to buy or sell financial instruments. Past simulated or historical performance does not predict future results. Always perform full backtesting and risk management, and consider seeking advice from a qualified financial professional before trading with real capital.
________________________________________

P/B Ratio (Per Share) vs Median + Bollinger Band- 📝 This indicator highlights potential buying opportunities by analyzing the Price-to-Book (P/B) ratio in relation to Bollinger Bands and its historical median.
- 🎯 The goal is to provide a visually intuitive signal for value-oriented entries, especially when valuation compression aligns with historical context.
- 💡 Vertical green shading is applied when the P/B ratio drops below the lower Bollinger Band, which is calculated directly from the P/B ratio itself — not price. This condition often signals the ticker may be oversold.
- 🟢 Lighter green appears when the ratio is below the lower band but above the median, suggesting a possible shorter-term entry with slightly more risk.
- 🟢 Darker green appears when the ratio is both below the lower band and below the median, pointing to a potentially stronger, longer-term value entry.
- ⚠️ This logic was tested using 1 and 2-day time frames. It may not be as helpful in longer time frames, as the financial data TradingView pulls in begins in Q4 2017.
- ⚠️ Note: This script relies on financial data availability through TradingView. It may not function properly with certain tickers — especially ETFs, IPOs, or thinly tracked assets — where P/S ratio data is missing or incomplete.
- ⚠️ This indicator will not guarantee successful results. Use in conjunction with other indicators and do your due diligence.
- 🤖 This script was iteratively refined with the help of AI to ensure clean logic, minimalist design, and actionable signal clarity.
- 📢 Idea is based on the script "Historical PE ratio vs median" by haribotagada
- 💬 Questions, feedback, or suggestions? Drop a comment — I’d love to hear how you’re using it or what you'd like to see changed.

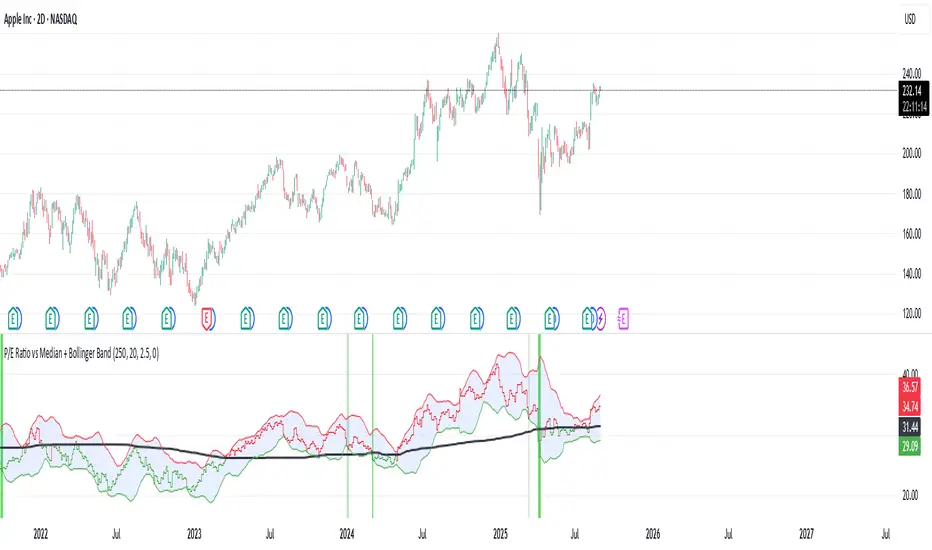
P/E Ratio vs Median + Bollinger Band- 📝 This indicator highlights potential buying opportunities by analyzing the Price-to-Earnings (P/E) ratio in relation to Bollinger Bands and its historical median.
- 🎯 The goal is to provide a visually intuitive signal for value-oriented entries, especially when valuation compression aligns with historical context.
- 💡 Vertical green shading is applied when the P/E ratio drops below the lower Bollinger Band, which is calculated directly from the P/E ratio itself — not price. This condition often signals the ticker may be oversold.
- 🟢 Lighter green appears when the ratio is below the lower band but above the median, suggesting a possible shorter-term entry with slightly more risk.
- 🟢 Darker green appears when the ratio is both below the lower band and below the median, pointing to a potentially stronger, longer-term value entry.
- ⚠️ This logic was tested using 1 and 2-day time frames. It may not be as helpful in longer time frames, as the financial data TradingView pulls in begins in Q4 2017.
- ⚠️ Note: This script relies on financial data availability through TradingView. It may not function properly with certain tickers — especially ETFs, IPOs, or thinly tracked assets — where P/S ratio data is missing or incomplete.
- ⚠️ This indicator will not guarantee successful results. Use in conjunction with other indicators and do your due diligence.
- 🤖 This script was iteratively refined with the help of AI to ensure clean logic, minimalist design, and actionable signal clarity.
- 📢 Idea is based on the script "Historical PE ratio vs median" by haribotagada
- 💬 Questions, feedback, or suggestions? Drop a comment — I’d love to hear how you’re using it or what you'd like to see changed.
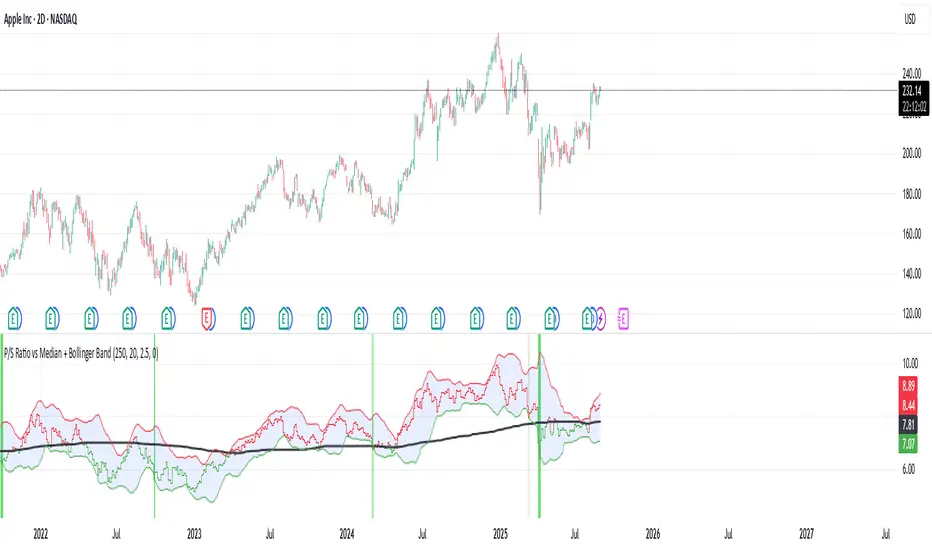
P/S Ratio vs Median + Bollinger Band- 📝 This indicator highlights potential buying opportunities by analyzing the Price-to-Sales (P/S) ratio in relation to Bollinger Bands and its historical median.
- 🎯 The goal is to provide a visually intuitive signal for value-oriented entries, especially when valuation compression aligns with historical context.
- 💡 Vertical green shading is applied when the P/S ratio drops below the lower Bollinger Band, which is calculated directly from the P/S ratio itself — not price. This condition often signals the ticker may be oversold.
- 🟢 Lighter green appears when the ratio is below the lower band but above the median, suggesting a possible shorter-term entry with slightly more risk.
- 🟢 Darker green appears when the ratio is both below the lower band and below the median, pointing to a potentially stronger, longer-term value entry.
- ⚠️ This logic was tested using 1 and 2-day time frames. It may not be as helpful in longer time frames, as the financial data TradingView pulls in begins in Q4 2017.
- ⚠️ Note: This script relies on financial data availability through TradingView. It may not function properly with certain tickers — especially ETFs, IPOs, or thinly tracked assets — where P/S ratio data is missing or incomplete.
- ⚠️ This indicator will not guarantee successful results. Use in conjunction with other indicators and do your due diligence.
- 🤖 This script was iteratively refined with the help of AI to ensure clean logic, minimalist design, and actionable signal clarity.
- 📢 Idea is based on the script "Historical PE ratio vs median" by @haribotagada
- 💬 Questions, feedback, or suggestions? Drop a comment — I’d love to hear how you’re using it or what you'd like to see changed.
Strat Failed 2-Up/2-Down Scanner v2**Strat Failed 2-Up/2-Down Scanner**
The Strat Failed 2-Up/2-Down Scanner is designed for traders using The Strat methodology, developed by Rob Smith, to identify key reversal patterns in any market and timeframe. This indicator detects two specific candlestick patterns: Failed 2-Up (bearish) and Failed 2-Down (bullish), which signal potential reversals when a directional move fails to follow through.
**What It Does**
- **Failed 2-Up**: Identifies a bearish candle where the low and high are higher than the previous candle’s low and high, but the close is below the open, indicating a failed attempt to continue an uptrend. These are marked with a red candlestick, a red downward triangle above the bar, and a table entry.
- **Failed 2-Down**: Identifies a bullish candle where the high and low are lower than the previous candle’s high and low, but the close is above the open, signaling a failed downtrend. These are marked with a green candlestick, a green upward triangle below the bar, and a table entry.
- A table in the top-right corner displays the signal type ("Failed 2-Up" or "Failed 2-Down") and the ticker symbol for quick reference.
- Alerts are provided for both patterns, making the indicator compatible with TradingView’s screener for automated scanning.
**How It Works**
The indicator analyzes each candlestick’s high, low, and close relative to the previous candle:
- Failed 2-Up: `low > low `, `high > high `, `close < open`.
- Failed 2-Down: `high < high `, `low < low `, `close > open`.
When these conditions are met, the indicator applies visual markers (colored bars and triangles) and updates the signal table. Alert conditions trigger notifications for integration with TradingView’s alert system.
**How to Use**
1. Apply the indicator to any chart (stocks, forex, crypto, etc.) on any timeframe (e.g., 1-minute, hourly, daily).
2. Monitor the chart for red (Failed 2-Up) or green (Failed 2-Down) candlesticks with corresponding triangles.
3. Check the top-right table for the latest signal and ticker.
4. Set alerts by selecting “Failed 2-Up Detected” or “Failed 2-Down Detected” in TradingView’s alert menu to receive notifications (e.g., via email or app).
5. Use the signals to identify potential reversal setups in conjunction with other Strat-based analysis, such as swing levels or time-based strategies.
**Originality**
Unlike other Strat indicators that may focus on swing levels or complex candlestick combinations, this scanner specifically targets Failed 2-Up and Failed 2-Down patterns with clear, minimalist visualizations (bars, triangles, table) and robust alert functionality. Its simplicity makes it accessible for both novice and experienced traders using The Strat methodology.
**Ideal For**
Day traders, swing traders, and scalpers looking to capitalize on reversal signals in trending or ranging markets. The indicator is versatile for any asset class and timeframe, enhancing trade decision-making with The Strat’s pattern-based approach.

MacD Alerts MACD Triggers (MTF) — Buy/Sell Alerts
What it is
A clean, multi-timeframe MACD indicator that gives you separate, ready-to-use alerts for:
• MACD Buy – MACD line crosses above the Signal line
• MACD Sell – MACD line crosses below the Signal line
It keeps the familiar MACD lines + histogram, adds optional 4-color histogram logic, and marks crossovers with green/red dots. Works on any symbol and any timeframe.
How signals are generated
• MACD = EMA(fast) − EMA(slow)
• Signal = SMA(MACD, length)
• Buy when crossover(MACD, Signal)
• Sell when crossunder(MACD, Signal)
• You can compute MACD on the chart timeframe or lock it to another timeframe (e.g., 1h MACD on a 4h chart).
Key features
• MTF engine: choose Use Current Chart Resolution or a custom timeframe.
• Separate alert conditions: publish two alerts (“MACD Buy” and “MACD Sell”)—ideal for different notifications or webhooks.
• Visuals: MACD/Signal lines, optional 4-color histogram (trend & above/below zero), and crossover dots.
• Heikin Ashi friendly: runs on whatever candle type your chart uses. (Tip below if you want “regular” candles while viewing HA.)
Settings (Inputs)
• Use Current Chart Resolution (on/off)
• Custom Timeframe (when the above is off)
• Show MACD & Signal / Show Histogram / Show Dots
• Color MACD on Signal Cross
• Use 4-color Histogram
• Lengths: Fast EMA (12), Slow EMA (26), Signal SMA (9)
How to set alerts (2 minutes)
1. Add the script to your chart.
2. Click ⏰ Alerts → + Create Alert.
3. Condition: choose this indicator → MACD Buy.
4. Options: Once per bar close (recommended).
5. Set your notification method (popup/email/webhook) → Create.
6. Repeat for MACD Sell.
Webhook tip: send JSON like
{"symbol":"{{ticker}}","time":"{{timenow}}","signal":"BUY","price":"{{close}}"}
(and “SELL” for the sell alert).
Good to know
• Symbol-agnostic: use it on crypto, stocks, indices—no symbol is hard-coded.
• Timeframe behavior: alerts are evaluated on bar close of the MACD timeframe you pick. Using a higher TF on a lower-TF chart is supported.
• Heikin Ashi note: if your chart uses HA, the calculations use HA by default. To force “regular” candles while viewing HA, tweak the code to use ticker.heikinashi() only when you want it.
• No repainting on close: crossover signals are confirmed at bar close; choose Once per bar close to avoid intra-bar noise.
Disclaimer
This is a tool, not advice. Test across timeframes/markets and combine with risk management (position sizing, SL/TP). Past performance ≠ future results.

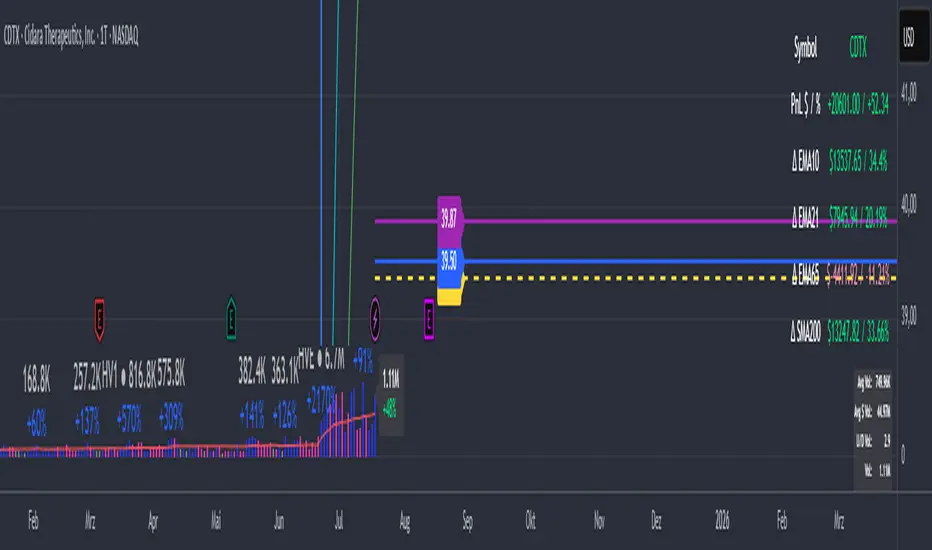
PnL_EMA_TRACK12_PRO_3.3_full_adjusted# Multi-Ticker Support
Manage up to 12 tickers simultaneously.
- For each symbol, input share quantities, entry prices, and two optional additional entry points (E2, E3) with their own shares and offset percentages.
- Dynamic handling of inputs using arrays for easier maintenance and scalability.
# Average Cost and PnL Calculation
- Computes weighted average entry costs across all position parts (E1 and optionally E2 and E3).
- Calculates real-time Profit & Loss (PnL) both in USD and percentage relative to the current price.
- Color-coded values: green for profit, red for loss — for quick visual feedback.
# Moving Averages as Benchmarks
- Uses daily EMAs (10, 21, 65) and 15-minute SMA 200 as reference levels.
- Calculates percentage deviations of these moving averages from the average entry price.
- Calculates dollar differences based on the total shares held.
# Chart Visualization
- Draws a dashed yellow line for the average cost of each position.
- Optionally draws two additional lines and labels for E2 (blue) and E3 (purple) if activated.
- Lines extend to the right to emphasize current relevance.
- Labels can be positioned left or right, with customizable horizontal offset.
# Interactive Table in Chart
- Positions the info table in any chosen corner or center of the chart (top/right/left/middle, etc.).
- Displays symbol, PnL (dollar and percentage), and deviations to key EMAs and SMA.
- Colors PnL values according to profit or loss for instant clarity.
# User-Friendly Settings
- Flexible font size options for both the table and labels.
- Customizable colors for positive and negative values (default green/red).
- Choice of label position and X-axis offset to fit your chart style.
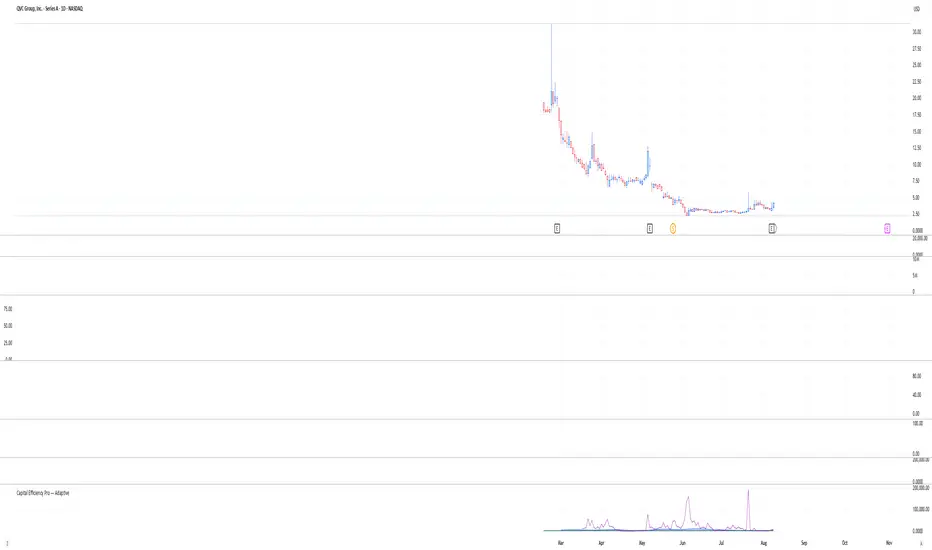
X-Day Capital Efficiency ScoreThis indicator helps identify the Most Profitable Movers for Your fixed Capital (ie, which assets offer the best average intraday profit potential for a fixed capital).
Unlike traditional volatility indicators (like ATR or % change), this script calculates how much real dollar profit you could have made each day over a custom lookback period — assuming you deployed your full capital into that ticker daily.
How it works:
Calculates the daily intraday range (high − low)
Filters for clean candles (where body > 60% of the candle range)
Assumes you invested the full amount of capital ($100K set as default) on each valid day
Computes an average daily profit score based on price action over the selected period (default set to 20 days)
Plots the score in dollars — higher = more efficient use of capital
Why It’s Useful:
Compare tickers based on real dollar return potential — not just % volatility
Spot low-priced, high-volatility stocks that are better suited for intraday or momentum trading
Inputs:
Capital ($): Amount you're hypothetically deploying (e.g., 100,000)
Look Back Period: Number of past days to average over (e.g., 20)
Essa - Multi-Timeframe LevelsEnhanced Multi‐Timeframe Levels
This indicator plots yearly, quarterly and monthly highs, lows and midpoints on your chart. Each level is drawn as a horizontal line with an optional label showing “ – ” (for example “Apr 2025 High – 1.2345”). If two or more timeframes share the same price (within two ticks), they are merged into a single line and the label lists each timeframe.
A distance table can be shown in any corner of the chart. It lists up to five active levels closest to the current closing price and shows for each level:
level name (e.g. “May 2025 Low”)
exact price
distance in pips or points (calculated according to the instrument’s tick size)
percentage difference relative to the close
Alerts can be enabled so that whenever price comes within a user-specified percentage of any level (for example 0.1 %), an alert fires. Once price decisively crosses a level, that level is marked as “broken” so it does not trigger again. Built-in alertcondition hooks are also provided for definite breaks of the current monthly, quarterly and yearly highs and lows.
Monthly lookback is configurable (default 6 months), and once the number of levels exceeds a cap (calculated as 20 + monthlyLookback × 3), the oldest levels are automatically removed to avoid clutter. Line widths and colours (with adjustable opacity for quarterly and monthly) can be set separately for each timeframe. Touches of each level are counted internally to allow future extension (for example visually emphasising levels with multiple touches).

VIX Z-Score (Inverted)📘 Indicator: VIX Z-Score (Inverted) + Table
🔍 Overview
This indicator calculates the Z-Score of the VIX (Volatility Index) and inverts it to identify potential buying opportunities during periods of fear and caution during periods of extreme optimism. The Z-Score is smoothed and visually displayed alongside a dynamic info table.
⚙️ How It Works
VIX Data: The VIX (ticker: CBOE:VIX) is pulled in real time.
Z-Score Calculation:
𝑍
=
(
𝑉
𝐼
𝑋
−
mean
)
standard deviation
Z=
standard deviation
(VIX−mean)
Over a customizable lookback period (default: 50).
Inversion:
Since high VIX usually means fear (often a contrarian buying signal), we invert the Z-Score:
𝑍
inv
=
−
𝑍
Z
inv
=−Z
Smoothing:
An EMA is applied to reduce noise and false signals.
Clamping:
The Z-Score is linearly scaled and capped between +2 and -2 for easy visualization in the info table.
📊 Z-Score Table (Top-Right)
Range Interpretation Table Color
+1.5 to +2 Extreme fear → Buy zone 🟩 Green
+0.5 to +1.5 Moderate fear 🟨 Lime
–0.5 to +0.5 Neutral ⬜ Gray
–0.5 to –1.5 Growing complacency 🟧 Orange
–1.5 to –2 Extreme optimism → Caution 🟥 Red
The current Z-Score (clamped version) is shown in real time on the right-hand info panel.
🧠 How to Use It
+2 Zone (Table: Green):
Market fear is at an extreme. Historically, such conditions are contrarian bullish—possible entry zones.
–2 Zone (Table: Red):
Indicates extreme optimism and low fear. Often a signal to be cautious or take profits.
Middle range (±0.5):
Market is neutral. Avoid major decisions based solely on sentiment here.
🧪 Best Practices
Combine with price action, volume, or trend filters.
Works well on daily or 4H timeframes.
Not a standalone signal—best used to confirm or fade sentiment extremes.

Dskyz (DAFE) AI Adaptive Regime - Beginners VersionDskyz (DAFE) AI Adaptive Regime - Pro: Revolutionizing Trading for All
Introduction
In the fast-paced world of financial markets, traders need tools that can keep up with ever-changing conditions while remaining accessible. The Dskyz (DAFE) AI Adaptive Regime - Pro is a groundbreaking TradingView strategy that delivers advanced, AI-driven trading capabilities to everyday traders. Available on TradingView (TradingView Scripts), this Pine Script strategy combines sophisticated market analysis with user-friendly features, making it a standout choice for both novice and experienced traders.
Core Functionality
The strategy is built to adapt to different market regimes—trending, ranging, volatile, or quiet—using a robust set of technical indicators, including:
Moving Averages (MA): Fast and slow EMAs to detect trend direction.
Average True Range (ATR): For dynamic stop-loss and volatility assessment.
Relative Strength Index (RSI) and MACD: Multi-timeframe confirmation of momentum and trend.
Average Directional Index (ADX): To identify trending markets.
Bollinger Bands: For assessing volatility and range conditions.
Candlestick Patterns: Recognizes patterns like bullish engulfing, hammer, and double bottoms, confirmed by volume spikes.
It generates buy and sell signals based on a scoring system that weighs these indicators, ensuring trades align with the current market environment. The strategy also includes dynamic risk management with ATR-based stops and trailing stops, as well as performance tracking to optimize future trades.
What Sets It Apart
The Dskyz (DAFE) AI Adaptive Regime - Pro distinguishes itself from other TradingView strategies through several unique features, which we compare to common alternatives below:
| Feature | Dskyz (DAFE) | Typical TradingView Strategies|
|---------|-------------|------------------------------------------------------------|
| Regime Detection | Automatically identifies and adapts to **four** market regimes | Often static or limited to trend/range detection |
| Multi‑Timeframe Analysis | Uses higher‑timeframe RSI/MACD for confirmation | Rarely incorporates multi‑timeframe data |
| Pattern Recognition | Detects candlestick patterns **with volume confirmation** | Limited or no pattern recognition |
| Dynamic Risk Management | ATR‑based stops and trailing stops | Often uses fixed stops or basic risk rules |
| Performance Tracking | Adjusts thresholds based on past performance | Typically static parameters |
| Beginner‑Friendly Presets | Aggressive, Conservative, Optimized profiles | Requires manual parameter tuning |
| Visual Cues | Color‑coded backgrounds for regimes | Basic or no visual aids |
The Dskyz strategy’s ability to integrate regime detection, multi-timeframe analysis, and user-friendly presets makes it uniquely versatile and accessible, addressing the needs of everyday traders who want professional-grade tools without the complexity.
-Key Features and Benefits
[Why It’s Ideal for Everyday Traders
⚡The Dskyz (DAFE) AI Adaptive Regime - Pro democratizes advanced trading by offering professional-grade tools in an accessible package. Unlike many TradingView strategies that require deep technical knowledge or fail in changing market conditions, this strategy simplifies complex analysis while maintaining robustness. Its presets and visual aids make it easy for beginners to start, while its adaptive features and performance tracking appeal to advanced traders seeking an edge.
🔄Limitations and Considerations
Market Dependency: Performance varies by market and timeframe. Backtesting is essential to ensure compatibility with your trading style.
Learning Curve: While presets simplify use, understanding regimes and indicators enhances effectiveness.
No Guaranteed Profits: Like all strategies, success depends on market conditions and proper execution. The Reddit discussion highlights skepticism about TradingView strategies’ universal success (Reddit Discussion).
Instrument Specificity: Optimized for futures (e.g., ES, NQ) due to fixed tick values. Test on other instruments like stocks or forex to verify compatibility.
📌Conclusion
The Dskyz (DAFE) AI Adaptive Regime - Pro is a revolutionary TradingView strategy that empowers everyday traders with advanced, AI-driven tools. Its ability to adapt to market regimes, confirm signals across timeframes, and manage risk dynamically. sets it apart from typical strategies. By offering beginner-friendly presets and visual cues, it makes sophisticated trading accessible without sacrificing power. Whether you’re a novice looking to trade smarter or a pro seeking a competitive edge, this strategy is your ticket to mastering the markets. Add it to your chart, backtest it, and join the elite traders leveraging AI to dominate. Trade like a boss today! 🚀
Use it with discipline. Use it with clarity. Trade smarter.
**I will continue to release incredible strategies and indicators until I turn this into a brand or until someone offers me a contract.
-Dskyz

Scalper's Fractal Cloud with RSI + VWAP + MACD (Fixed)Scalper’s Fractal Confluence Dashboard
1. Purpose of the Indicator
This TradingView indicator script provides a high-confluence setup for scalping and day trading. It blends momentum indicators (RSI, MACD), trend bias tools (EMA Cloud, VWAP), and structure (fractal swings, gap zones) to help confirm precise entries and exits.
2. Components of the Indicator
- EMA Cloud (50 & 200 EMA): Trend bias – green means bullish, red means bearish. Avoid longs under red cloud.
- VWAP: Institutional volume anchor. Ideal entries are pullbacks to VWAP in direction of trend.
- Gap Zones: Shows open-air zones (white space) where price can move fast. Used to anticipate momentum moves.
- ZigZag Swings: Marks structural pivots (highs/lows) – useful for stop placement and range anticipation.
- MACD Histogram: Shows bullish or bearish momentum via background color.
- RSI: Overbought (>70) or oversold (<30) warnings. Good for exits or countertrend reversion plays.
- EMA Spread Label: Quick view of momentum strength. Wide spread = strong trend.
3. Scalping Entry Checklist
Before entering a trade, confirm these conditions:
• • Bias: EMA cloud color supports trade direction
• • Price is above/below VWAP (confirming institutional flow)
• • MACD histogram matches direction (green for long, red for short)
• • RSI not at extreme (unless you’re fading trend)
• • If entering gap zone, expect fast move
• • Recent swing high/low nearby for target or stop
4. Risk & Sizing Guidelines
Risk 1–2% of account per trade. Place stop below recent swing low (for longs) or high (for shorts). Use fractional sizing near VWAP or white space zones for scalping reversals.
5. Daily Trade Journal Template
- Date:
- Ticker:
- Setup Type (VWAP pullback, Gap Break, EMA reversion):
- Entry Time:
- Bias (Green/Red Cloud):
- RSI Level / MACD Reading:
- Stop Loss:
- Target:
- Result (P/L):
- What I Did Well:
- What Needs Work:

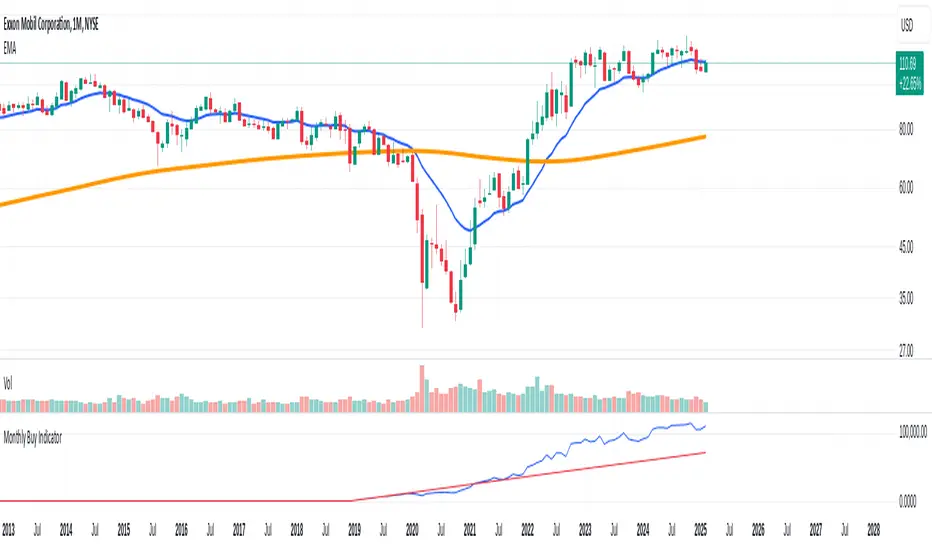
Monthly Buy IndicatorIt shows us the the total balance when buying monthly, ploting the total invested amount and total current balance along the time.
Opening the Data Window, it displays the profit (%) and the number of trades.
The "Allow Fractional Purchase" flag can be used to check the the performance of the ticker, disregarding how much the monthly amount is set vs the price of the ticker.
The trades are considering buying the available amount on the 1st candle of each month, at the Open price. The "Total Balance" considers the close price of each candle.
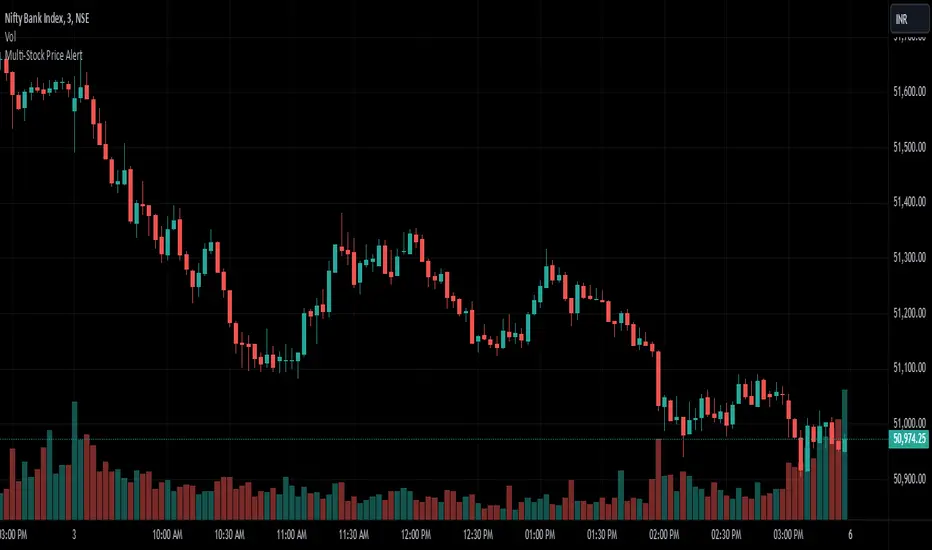
Multi-Stock Price AlertThis indicator is designed to track up to 25 stock tickers and trigger price alerts whenever their respective price targets are reached. The indicator allows users to input ticker symbols and corresponding price targets for multiple stocks. It continuously monitors the stock prices and generates alerts when the current price crosses or equals the specified target.
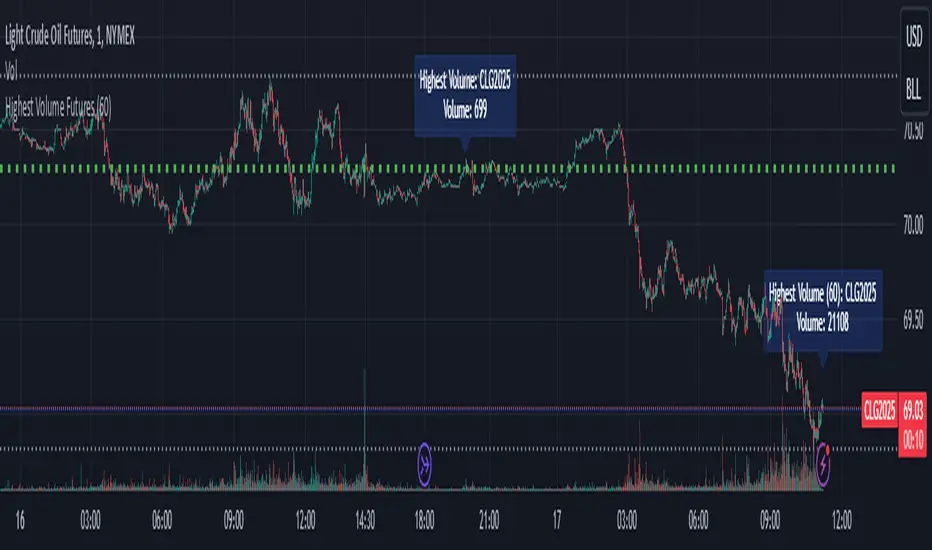
Highest Volume FuturesScript tracks the volume of futures contracts which are not expired for the current and next year. Provides a label at the real-time bar and when a different contract has higher volume in the last bar of the timeframe input as long as it is different from the current ticker. It should display on continuous and lower volume contract charts.
Intended to be used with a higher timeframe input.
Currently supports ES, MES, NQ, MNQ, RTY, M2K, YM, MYM, BTC, MBT, CL, MCL, GC, MGC, E7 and J7. If you'd like to add your own, then include the syminfo.root of your ticker and the appropriate month codes for that contract in the validMonthCodes switch list.
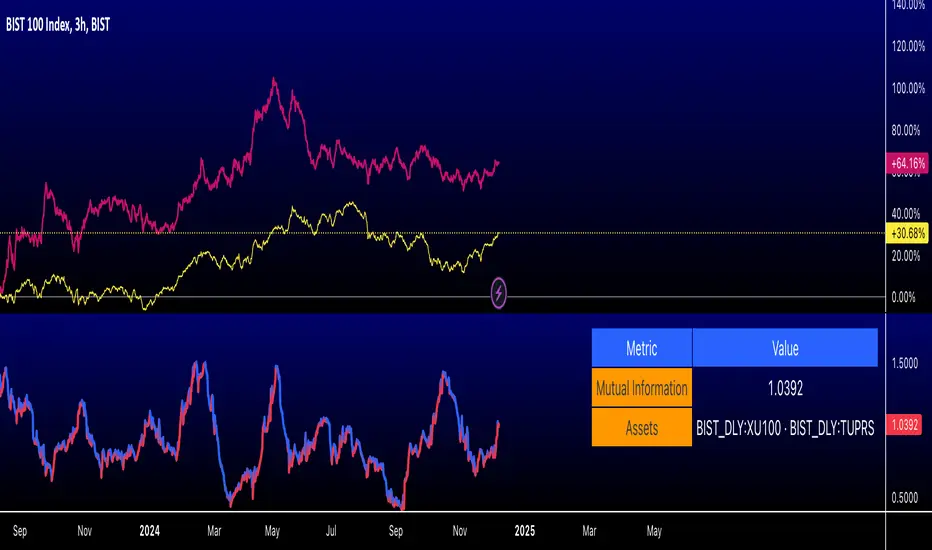
Romantic Information CoefficientThis script calculates the Mutual Information (MI) between the closing prices of two assets over a defined lookback period. Mutual Information is a measure of the shared information between two time-series datasets. A higher MI indicates a stronger relationship between the two assets.
Key Features:
Ticker Inputs: You can select the tickers for two assets. For example, SPY (S&P 500 ETF) and AAPL (Apple stock) can be compared.
Lookback Period: Choose the number of bars to look back and calculate the Mutual Information. A larger lookback period incorporates more data, but may be less responsive to recent price changes.
Bins for Discretization: Control the level of granularity for discretizing the asset prices. More bins result in a more detailed MI calculation but can also reduce the signal-to-noise ratio.
Color Coded MI: The MI plot dynamically changes color to provide visual feedback on whether the relationship between the two assets is strengthening (red) or weakening (blue).
Only for educational purposes. Not in anyway, investment advice.
DNSE VN301!, SMA & EMA Cross StrategyDiscover the tailored Pinescript to trade VN30F1M Future Contracts intraday, the strategy focuses on SMA & EMA crosses to identify potential entry/exit points. The script closes all positions by 14:25 to avoid holding any contracts overnight.
HNX:VN301!
www.tradingview.com
Setting & Backtest result:
1-minute chart, initial capital of VND 100 million, entering 4 contracts per time, backtest result from Jan-2024 to Nov-2024 yielded a return over 40%, executed over 1,000 trades (average of 4 trades/day), winning trades rate ~ 30% with a profit factor of 1.10.
The default setting of the script:
A decent optimization is reached when SMA and EMA periods are set to 60 and 15 respectively while the Long/Short stop-loss level is set to 20 ticks (2 points) from the entry price.
Entry & Exit conditions:
Long signals are generated when ema(15) crosses over sma(60) while Short signals happen when ema(15) crosses under sma(60). Long orders are closed when ema(15) crosses under sma(60) while Short orders are closed when ema(15) crosses over sma(60).
Exit conditions happen when (whichever came first):
Another Long/Short signal is generated
The Stop-loss level is reached
The Cut-off time is reached (14:25 every day)
*Disclaimers:
Futures Contracts Trading are subjected to a high degree of risk and price movements can fluctuate significantly. This script functions as a reference source and should be used after users have clearly understood how futures trading works, accessed their risk tolerance level, and are knowledgeable of the functioning logic behind the script.
Users are solely responsible for their investment decisions, and DNSE is not responsible for any potential losses from applying such a strategy to real-life trading activities. Past performance is not indicative/guarantee of future results, kindly reach out to us should you have specific questions about this script.
---------------------------------------------------------------------------------------
Khám phá Pinescript được thiết kế riêng để giao dịch Hợp đồng tương lai VN30F1M trong ngày, chiến lược tập trung vào các đường SMA & EMA cắt nhau để xác định các điểm vào/ra tiềm năng. Chiến lược sẽ đóng tất cả các vị thế trước 14:25 để tránh giữ bất kỳ hợp đồng nào qua đêm.
Thiết lập & Kết quả backtest:
Chart 1 phút, vốn ban đầu là 100 triệu đồng, vào 4 hợp đồng mỗi lần, kết quả backtest từ tháng 1/2024 tới tháng 11/2024 mang lại lợi nhuận trên 40%, thực hiện hơn 1.000 giao dịch (trung bình 4 giao dịch/ngày), tỷ lệ giao dịch thắng ~ 30% với hệ số lợi nhuận là 1,10.
Thiết lập mặc định của chiến lược:
Đạt được một mức tối ưu ổn khi SMA và EMA periods được đặt lần lượt là 60 và 15 trong khi mức cắt lỗ được đặt thành 20 tick (2 điểm) từ giá vào.
Điều kiện Mở và Đóng vị thế:
Tín hiệu Long được tạo ra khi ema(15) cắt trên sma(60) trong khi tín hiệu Short xảy ra khi ema(15) cắt dưới sma(60). Lệnh Long được đóng khi ema(15) cắt dưới sma(60) trong khi lệnh Short được đóng khi ema(15) cắt lên sma(60).
Điều kiện đóng vị thể xảy ra khi (tùy điều kiện nào đến trước):
Một tín hiệu Long/Short khác được tạo ra
Giá chạm mức cắt lỗ
Lệnh chưa đóng nhưng tới giờ cut-off (14:25 hàng ngày)
*Tuyên bố miễn trừ trách nhiệm:
Giao dịch hợp đồng tương lai có mức rủi ro cao và giá có thể dao động đáng kể. Chiến lược này hoạt động như một nguồn tham khảo và nên được sử dụng sau khi người dùng đã hiểu rõ cách thức giao dịch hợp đồng tương lai, đã đánh giá mức độ chấp nhận rủi ro của bản thân và hiểu rõ về logic vận hành của chiến lược này.
Người dùng hoàn toàn chịu trách nhiệm về các quyết định đầu tư của mình và DNSE không chịu trách nhiệm về bất kỳ khoản lỗ tiềm ẩn nào khi áp dụng chiến lược này vào các hoạt động giao dịch thực tế. Hiệu suất trong quá khứ không chỉ ra/cam kết kết quả trong tương lai, vui lòng liên hệ với chúng tôi nếu bạn có thắc mắc cụ thể về chiến lược giao dịch này.

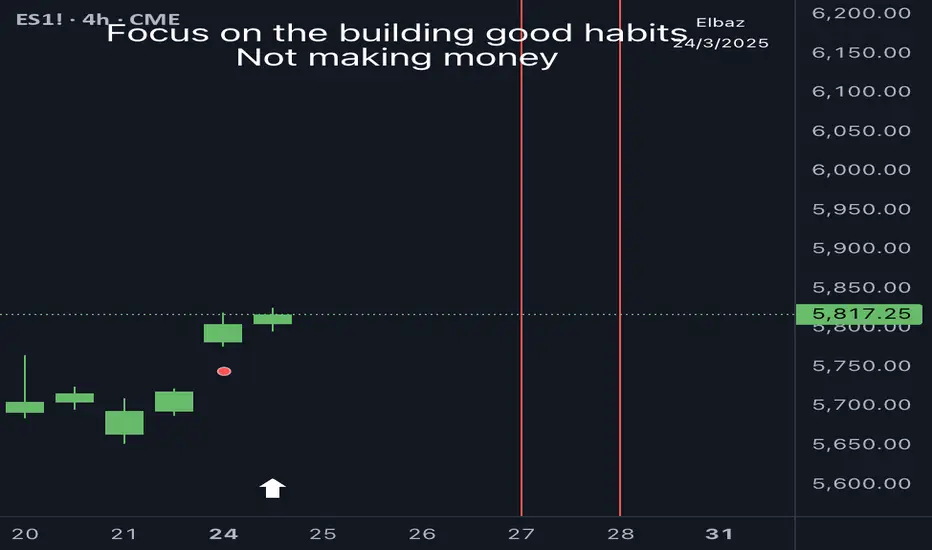
PSP Indicator [Elbaz]Precision Swing Point or PSP is a unique technical analysis tool designed to compare the price action of three tickers that are in sync.
It highlights moments when the price structure diverges between the markets, identifying ideal entry points for trades - We would like to enter a trade when we found PSP and one of the tickers took the wick while others didn't.
This strategy provides an edge by focusing on periods of desynchronization between the indices, where one index may be showing strength while another is lagging. The idea is to find the moments where the candle colors (bullish or bearish) differ across the markets, then wait for one of the tickers to "take" the wick of the PSP while other didn't and enter a trade.
Once a divergence is detected, the indicator plots an arrow on the chart, signaling a potential trade entry. To minimize risk, a good place to put stop loss will at the end of the wick of the PSP — the high or low wick of the candle where the divergence occurs.
The PSP Indicator allows for several custom inputs:
- Tickers: Customize the tickers to compare. The default values are S&P 500 E-mini, NASDAQ E-mini, and Dow Jones E-mini, if you trade Crypto you might want to use BTC, ETH, TOTAL3.
- Lookback Period: The lookback input defines how far back the indicator should evaluate to calculate the price structure point.
- Highlight Bar Times: Users can specify particular times during the trading day to highlight, such as the market open or significant news events. This helps traders focus on key trading windows.
[MAD] BTC ETF Volume In/OutflowThe " BTC ETF Volume In/Outflows" indicator is designed to analyze and visualize the volume data of various Bitcoin Exchange-Traded Funds (ETFs) across different exchanges. This indicator helps traders and analysts observe the inflows and outflows of trading volume in a structured and comparative manner.
Features
Multi-Ticker Support: The indicator is capable of handling volume data from multiple ETFs simultaneously, making it versatile for comparative analysis.
Volume Adjustments: Provides an option to view volume data either as the number of pieces (shares) traded or as monetary flow (value traded).
Compression Factor: Includes a volume compression factor setting that helps in emphasizing smaller volume changes or smoothing out volume spikes.
Data Calculation
Volume data is processed using a custom function that adjusts the data based on user settings for piece or monetary representation and applies a logarithmic compression factor.
This processed data is then fetched for each ticker.
Visualization
Volume data is visualized on the chart using column plots where each ETF's volume data is stacked and offset to provide a clear visual representation of in/outflows. Horizontal lines indicate the zero level for reference.
Usage Scenario
This indicator is particularly useful for traders who track multiple ETFs and need to compare their volume activities simultaneously. It provides insights into market trends, potentially indicating bullish or bearish shifts based on volume inflows and outflows across different instruments.
have fun :-)

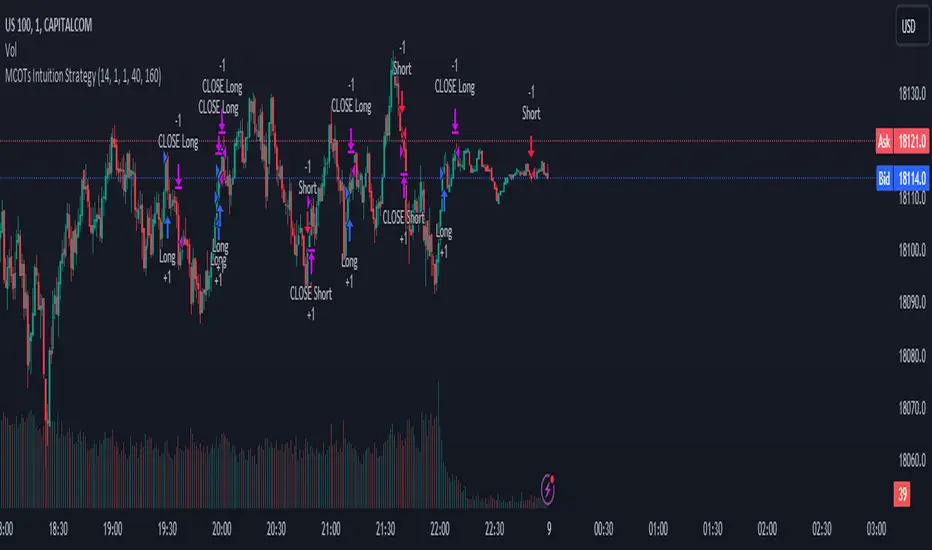
MCOTs Intuition StrategyInitial Capital: The strategy starts with an initial capital of $50,000.
Execution: Trades are executed on every price tick to capture all potential movements.
Contract Size: The default position size is one contract per trade.
Timeframe: Although not explicitly mentioned, this strategy is intended for a one-minute timeframe.
RSI Calculation: The Relative Strength Index (RSI) is calculated over a user-defined period (default is 14 periods).
Standard Deviation: The script calculates the standard deviation of the change in RSI values to determine the threshold for entering trades.
Exhaustion Detection: Before entering a long or short position, the script checks for exhaustion in the RSI’s momentum. This is to avoid entering trades during extreme conditions where a reversal is likely.
Entry Conditions: A long position is entered when the current RSI momentum exceeds the standard deviation threshold and is less than the previous momentum multiplied by an exhaustion factor. A short position is entered under the opposite conditions.
Limit Orders for Exit: Instead of traditional stop loss and take profit orders, the strategy uses limit orders to exit positions. This means the strategy sets a desired price level to close the position and waits for the market to reach this price.
Profit Target and Stop Loss: The script allows setting a profit target and stop loss in terms of ticks, which are the smallest measurable increments in price movement for the traded asset.
blah blah whatever
Percent Rank HistogramThis Pine script indicator is designed to create a visual representation of the percent rank for multiple financial instruments. Here's a breakdown of its key features:
Percent Rank Calculation:
The core functionality of this Pine script indicator revolves around the calculation of the percent rank for each selected financial instrument.
The percent rank is a statistical measure that indicates the percentage of historical data points that are less than or equal to the current value in a given series.
Symbol Selection:
The script allows the user to select up to 10 financial instruments (tickers) for analysis. The default symbols include various cryptocurrencies such as BTCUSD, ETHUSD etc., and TOTAL market cap at ticker 1, to show overal trend of crypto market.
(Top 9 Coins by market cap).
Columns and Colors:
The script visually represents the percent rank using columns based on lines.
The color of each column is determined by a gradient from red to green based on the calculated percent rank, providing a quick visual indication of the instrument's relative performance.
BTC Trending Up while other coins are underperformance:
Labels:
Labels are displayed on the chart, indicating the symbol name and the corresponding percent rank percentage.
The labels include directional arrows (▲ or ▼) to denote whether the percent rank is increasing or decreasing.
Customization:
Users can customize parameters such as the percent rank length and column width to adapt the indicator to their specific preferences, or select needed assets to compare them to each other.
Chart Desk and Scales:
The script includes the visualization of a chart desk with scale lines to provide additional context to the chart. When Percent Rank above middle scale line (50) usually it signaling about asset trending up and below 50 asset trending down.
Mozilla Public License:
The script is subject to the terms of the Mozilla Public License 2.0.
This indicator is useful for traders and analysts interested in visually assessing the percent rank of multiple financial instruments simultaneously, helping them identify potential opportunities or trends in the market.

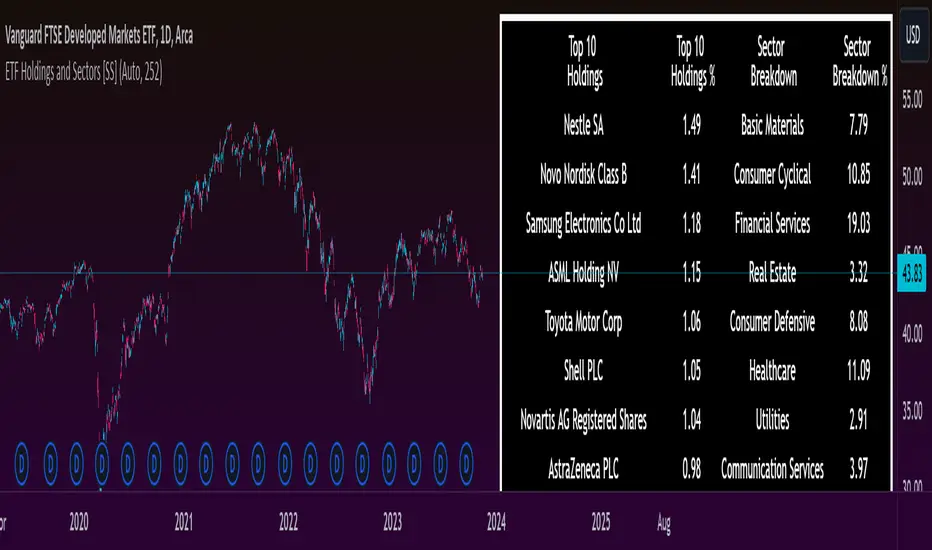
ETF Holdings and Sectors [SS]Made this fun little indicator.
It is another showcase one, just demonstrating the ETF library that contains the top 10 holdings of various US-based ETFs, as well as a breakdown by sector.
The indicator is defaulted to auto settings. This means it will automatically populate with ETF data when you are on that ETF chart. If you are on another chart, it will disappear for which no information is available, it will disappear. (Note, it is also programmed to recognize the leveraged share versions, such as TNA, TZA, SPXL, UPRO, etc.)
However, there is another cool little function it does, which is, it will search all available ETFs in the database to find if any of them hold the ticker you are on and, if so, what percentage of the ETF is invested in that particular ticker.
We can look at some examples:
MSFT:
NVDA:
BA:
AAPL:
JPM:
And if you are on a chart that is neither an ETF or is not found in any of the databases, the indicator disappears:
It made it so you could leave it running in the background and it would do its thing.
You can also choose to manually search through the available ETFs in the list.
Another function is, that when you are on the ETF itself, it will display the past 252 (1 trading year) day return. You can modify this to any amount of days you would like in the settings.
All of the settings are customizable. You can choose what you want and don't want to be plotted.
That's the indicator in a nutshull, just something fun and interesting to play around with.
Hope you enjoy!
Safe trades everyone and thanks for reading!