Dynamic Portfolio TrackerDynamic Portfolio Tracker
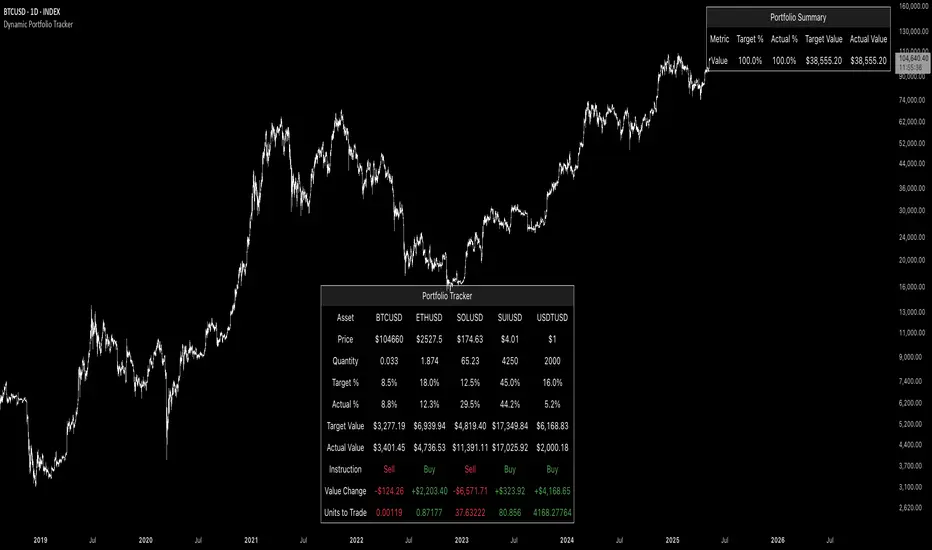
The Dynamic Portfolio Tracker is a visual tool for actively managing and monitoring a multi-asset portfolio directly on TradingView. It allows users to input up to 15 custom assets (with a default setup for 5), define how much of each asset they hold, and assign a target allocation percentage to each. The script then calculates live market prices, total portfolio value, current vs. target weightings, and provides clear, color-coded instructions on whether to buy, sell, or hold each asset. It displays all this data in an on-chart table, showing both the dollar amount and the quantity to adjust for each asset, helping users keep their portfolio aligned with their strategy in real time.
How to Use the Inputs (What Each Field Means)
1. Portfolio Assets (Tickers)
Fields: Asset 1 Ticker, Asset 2 Ticker, …, Asset 15 Ticker
What it does: Lets you select which assets (crypto, stocks, etc.) you want to track. These are live symbols pulled from TradingView.
2. Asset Quantities
Fields: Asset 1 Amount, Asset 2 Amount, …, Asset 15 Amount
What it means: How much of each asset you currently hold. For example:
• 0.03 BTC
• 2.1 ETH
Why it’s needed: The script multiplies this by the live price to calculate the current dollar value of each asset in your portfolio.
3. Target %
Fields: Asset 1 Implied %, Asset 2 Implied %, …, Asset 15 Implied %
What it means: Your desired allocation for each asset. For example:
• 40% BTC
• 20% ETH
• 10% SOL, etc.
Important: These must total 100% or less across all assets. The script checks this and shows an error if the total exceeds 100%.
The Dynamic Portfolio Tracker displays two powerful on-chart tables:
1. Main Table — Per Asset Breakdown
This table shows detailed, real-time information for each asset in your portfolio. Each row represents a different asset, and each column has a specific meaning:
Column What It Means
Asset = The symbol of the asset (e.g., BTCUSD, ETHUSD), auto-stripped from the exchange name.
Price = The current market price of the asset, pulled live from TradingView.
Quantity = How much of that asset you currently hold, entered manually in the inputs.
Target % = The percentage of your total portfolio you want this asset to represent.
Actual % = What percentage of your portfolio it currently makes up (based on price × quantity).
Target Value = How much (in $) this asset should be worth in your portfolio.
Actual Value = How much (in $) this asset is currently worth.
Instruction = Whether to Buy, Sell, or Hold to match your target allocation.
Value Change = The dollar amount you’d need to buy/sell to rebalance this asset.
Units to Trade = The number of asset units to buy/sell to reach the target value.
2. Portfolio Summary Table — Portfolio Totals
This smaller table appears in the top-right corner and summarizes your entire portfolio at a glance:
Target % = Total of all your assigned target allocations (should equal 100%).
Actual % = Actual portfolio composition (always 100% unless your capital is zero).
Target Value = Total value your portfolio should be based on your target percentages.
Actual Value = Current live total value of your portfolio.
If there’s a discrepancy between Target Value and Actual Value, the difference is shown in each row of the main table, so you can adjust individual assets accordingly.
Privacy First: Hide Sensitive Financial Data
A unique feature of this tool is the ability to hide sensitive financial data, such as:
• Target Value
• Actual Value
• Total Portfolio Value
You can turn these off using toggle settings, and they’ll be replaced with a crossed-out eye icon (👁️🗨️) — just like on modern crypto exchanges. This feature makes the script safe for streaming, screenshots, or sharing publicly while protecting your privacy.
But more importantly:
Feelings are the enemy of good investing.
Seeing the value of your portfolio fluctuate can trigger fear or greed. By hiding your dollar values, you’re not just securing your data — you’re reducing the temptation to react emotionally.
It’s just numbers. Systems over Feelings.
Table Automatically Adapts to Your Asset Count
The Dynamic Portfolio Tracker is designed to scale with your portfolio. Simply choose how many assets you want to track (up to 15), and the table will automatically resize to fit exactly that number — no wasted space or empty rows.
• Select 1 to 15 assets using the “Number of Assets” input
• The table expands or contracts dynamically to show only those rows
• All calculations, summaries, and layout elements adjust accordingly in real time
This keeps the interface clean, focused, and perfectly tailored to your setup — whether you’re tracking 3 coins or managing a full portfolio of 12+ tokens.
Customize Your Table to Match Your Style
The Dynamic Portfolio Tracker offers a full suite of visual customization options, allowing you to tailor the table to your charting style or stream layout. You can:
• Choose text colors for labels, values, and headers
• Set background colors for the full table and header row — or turn them off completely for a clean, transparent look
• Control border and frame settings, including color, thickness, or disabling them entirely
• Pick custom colors for Buy and Sell signals in the rebalance column
• Adjust table font size from tiny to large to match your resolution or preferences
Special Thanks
This tool wouldn’t exist without the knowledge and inspiration gained through The Real World. A sincere thank you to the Investing Master, the Guides, and Professor Adam — your frameworks and lessons brought clarity, discipline, and structure to this build.
And of course, glory to L4 — where real men are made.
Pesquisar nos scripts por "文华财经tick价格"
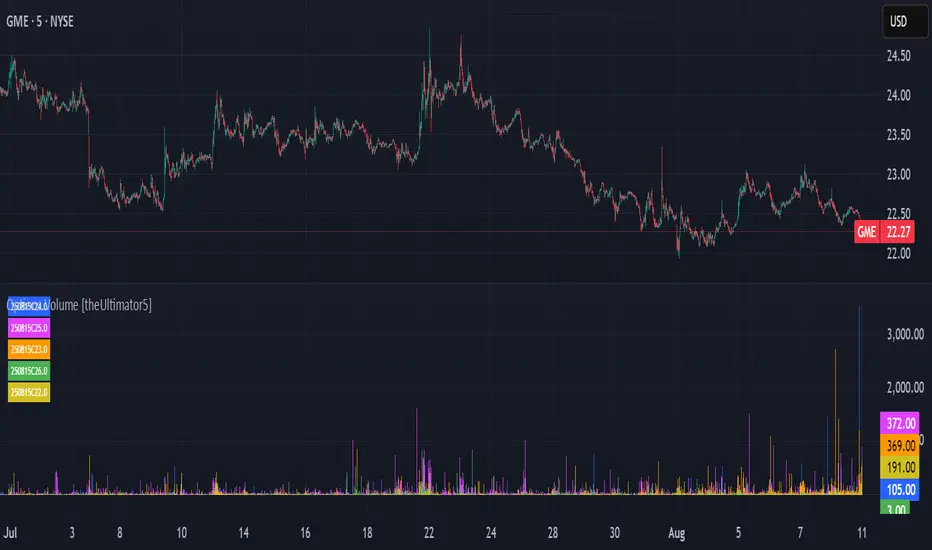
Options Volume [theUltimator5]📊 Option Volume — Multi-Strike Option Flow Visualizer
The Option Volume indicator tracks and visualizes volume activity for up to 10 custom option strike symbols on any ticker. It supports both individual strike analysis and a combined cumulative volume mode, providing an intuitive view of option flow across your selected strikes.
🔧 Features:
Dynamic Strike Control: Select up to 10 strikes and customize each with ticker, expiration date (YYMMDD), and option type (Call or Put).
Volume Display Modes:
🔹 Individual: Shows a separate volume bar for each strike.
🔸 Cumulative: Combines all selected strike volumes into a single bar, colored green for Calls and red for Puts.
Customizable Table Display:
Toggle the option symbol table on/off.
Position the table in any corner of the chart.
Table cell colors match plotted bars in Individual mode, or turn red/green in Cumulative mode based on option type.
Smart Volume Filtering: Only shows volume bars on the bar where volume updates (i.e., no carryover from stale bars).
Input Efficiency: All strike prices are automatically rounded to the nearest 0.5 increment for standardized symbol formatting.
⚙️ How to Use:
Select the ticker you want to analyze.
Input the expiration date and option type (C or P).
Define strike prices (up to 10).
Toggle between Individual or Cumulative volume display.
Adjust the number of visible strikes and table position as needed.
This tool is ideal for traders looking to monitor strike-level option volume behavior, spot flow anomalies, or keep track of high-interest strike activity in real-time.
The indicator currently doesn't support multiple expiration dates or a combination of calls/puts. If you want to view multiple expirations or a both calls and puts at the same time, simply add the indicator multiple times.
Custom Performance TableThis script generates a table designed to provide a concise yet highly customizable overview of the performance of multiple financial instruments, displayed directly on the chart. The table can include up to 40 tickers, each individually configurable, with values updated in real time based on either the current chart timeframe or a specific user-selected timeframe.
NOTE : The update frequency of the table values depends on the refresh rate of the chart's main ticker to which the indicator is applied. To ensure a consistent and reliable data feed, especially when monitoring heterogeneous instruments, it is recommended to apply the indicator to a highly liquid and continuously traded asset, such as BTCUSD.
PERFORMANCE CALCULATION MODES
You can choose from three different performance calculation modes:
1) Change % (Percentage Change)
Displays the percentage change of the current price compared to the previous candle within the selected timeframe.
(Current Price - Previous Price) / Previous Price * 100
This mode provides an immediate and straightforward measure of each instrument's percentage movement, useful for quick visual comparisons of relative strength among assets.
2) Z-Score
The Z-Score measures how much the current price variation deviates from the historical average variation, relative to the standard deviation of those variations.
(Current Variation - Average Variation) / Standard Deviation of Variations
The result indicates how statistically unusual a movement is:
- Values near 0 suggest normal variations.
- Values above ±2 indicate statistically significant deviations.
This is a valuable tool for identifying overbought/oversold conditions or market stress events and is often used in mean reversion strategies.
NOTE : Due to technical constraints, Z-Score can only be calculated when the selected timeframe matches the chart's timeframe exactly.
3) RAROC (Risk-Adjusted Return on Capital)
RAROC expresses an asset's performance in relation to the risk taken, measured through its volatility (standard deviation of price).
Percentage Change / Standard Deviation of Price
It allows for an assessment of return efficiency in relation to volatility.
A high RAROC value indicates a high return relative to the risk, making it a useful tool for comparing assets with different risk profiles. It is especially suitable for portfolio selection and allocation purposes.
TABLE CONFIGURATION
Each ticker can be customized with its own label, colors, and position in the table.
Each row can display the ticker name or a custom label, which, at the user's discretion, can either replace the name or be shown as an informational tooltip.
The table can be placed anywhere on the chart using horizontal and vertical offset parameters. Thanks to offset support, you can, for example, create financial market overview layouts. This can be done by completely “cleaning” the chart from price and indicators using TradingView settings, and then displaying multiple tables simultaneously (see the example chart published here).
Advanced customization options are also available for the table's appearance, including font settings, colors, borders, and more.
CALCULATION TIMEFRAME
The indicator allows the user to force a specific timeframe (Daily, Weekly, Monthly, Yearly) when applied to intraday charts.
However, for Z-Score mode, the selected timeframe must match the chart's timeframe exactly to ensure correct computation. Otherwise, the script will halt until settings are properly adjusted.
USAGE NOTES
Custom Performance Table is a flexible and adaptable tool, suitable for both intraday operations and medium- to long-term analysis. It is designed for traders and analysts who need to compare assets based on quantitative metrics, whether simple (like percentage change) or more advanced and risk-adjusted (such as Z-Score and RAROC).

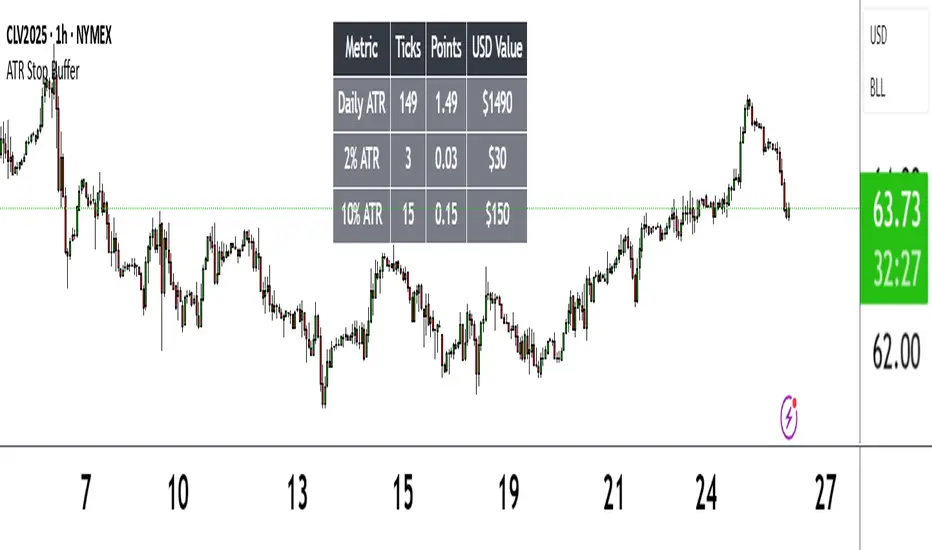
ATR Stop BufferThe ATR Stop Buffer indicator calculates the Daily Average True Range (ATR) and converts it into ticks based on the symbol's minimum price movement. It then displays the full ATR, 2% of ATR, and 10% of ATR in a clean table format, rounded up for simplicity. This tool is ideal for traders who want to set volatility-based stop-loss levels or buffers for their trades.
Key Features:
- Uses a 14-period Daily ATR for robust volatility measurement.
- Converts ATR into ticks for precise application across different instruments.
- Table display with toggle option for flexibility.
- Perfect for risk management and trade planning.
How to Use:
1. Add the indicator to your chart.
2. Use the table values to adjust your stop-loss distances (e.g., 2% ATR for tight stops, 10% ATR for wider buffers).
3. Toggle the table off if you only need the values occasionally.
Note: Works best on instruments with defined tick sizes (e.g., futures, forex, stocks).
Multi-indicator Signal Builder [Skyrexio]Overview
Multi-Indicator Signal Builder is a versatile, all-in-one script designed to streamline your trading workflow by combining multiple popular technical indicators under a single roof. It features a single-entry, single-exit logic, intrabar stop-loss/take-profit handling, an optional time filter, a visually accessible condition table, and a built-in statistics label. Traders can choose any combination of 12+ indicators (RSI, Ultimate Oscillator, Bollinger %B, Moving Averages, ADX, Stochastic, MACD, PSAR, MFI, CCI, Heikin Ashi, and a “TV Screener” placeholder) to form entry or exit conditions. This script aims to simplify strategy creation and analysis, making it a powerful toolkit for technical traders.
Indicators Overview
1. RSI (Relative Strength Index)
Measures recent price changes to evaluate overbought or oversold conditions on a 0–100 scale.
2. Ultimate Oscillator (UO)
Uses weighted averages of three different timeframes, aiming to confirm price momentum while avoiding false divergences.
3. Bollinger %B
Expresses price relative to Bollinger Bands, indicating whether price is near the upper band (overbought) or lower band (oversold).
4. Moving Average (MA)
Smooths price data over a specified period. The script supports both SMA and EMA to help identify trend direction and potential crossovers.
5. ADX (Average Directional Index)
Gauges the strength of a trend (0–100). Higher ADX signals stronger momentum, while lower ADX indicates a weaker trend.
6. Stochastic
Compares a closing price to a price range over a given period to identify momentum shifts and potential reversals.
7. MACD (Moving Average Convergence/Divergence)
Tracks the difference between two EMAs plus a signal line, commonly used to spot momentum flips through crossovers.
8. PSAR (Parabolic SAR)
Plots a trailing stop-and-reverse dot that moves with the trend. Often used to signal potential reversals when price crosses PSAR.
9. MFI (Money Flow Index)
Similar to RSI but incorporates volume data. A reading above 80 can suggest overbought conditions, while below 20 may indicate oversold.
10. CCI (Commodity Channel Index)
Identifies cyclical trends or overbought/oversold levels by comparing current price to an average price over a set timeframe.
11. Heikin Ashi
A type of candlestick charting that filters out market noise. The script uses a streak-based approach (multiple consecutive bullish or bearish bars) to gauge mini-trends.
12. TV Screener
A placeholder condition designed to integrate external buy/sell logic (like a TradingView “Buy” or “Sell” rating). Users can override or reference external signals if desired.
Unique Features
1. Multi-Indicator Entry and Exit
You can selectively enable any subset of 12+ classic indicators, each with customizable parameters and conditions. A position opens only if all enabled entry conditions are met, and it closes only when all enabled exit conditions are satisfied, helping reduce false triggers.
2. Single-Entry / Single-Exit with Intrabar SL/TP
The script supports a single position at a time. Once a position is open, it monitors intrabar to see if the price hits your stop-loss or take-profit levels before the bar closes, making results more realistic for fast-moving markets.
3. Time Window Filter
Users may specify a start/end date range during which trades are allowed, making it convenient to focus on specific market cycles for backtesting or live trading.
4. Condition Table and Statistics
A table at the bottom of the chart lists all active entry/exit indicators. Upon each closed trade, an integrated statistics label displays net profit, total trades, win/loss count, average and median PnL, etc.
5. Seamless Alerts and Automation
Configure alerts in TradingView using “Any alert() function call.”
The script sends JSON alert messages you can route to your own webhook.
The indicator can be integrated with Skyrexio alert bots to automate execution on major cryptocurrency exchanges
6. Optional MA/PSAR Plots
For added visual clarity, optionally plot the chosen moving averages or PSAR on the chart to confirm signals without stacking multiple indicators.
Methodology
1. Multi-Indicator Entry Logic
When multiple entry indicators are enabled (e.g., RSI + Stochastic + MACD), the script requires all signals to align before generating an entry. Each indicator can be set for crossovers, crossunders, thresholds (above/below), etc. This “AND” logic aims to filter out low-confidence triggers.
2. Single-Entry Intrabar SL/TP
One Position At a Time: Once an entry signal triggers, a trade opens at the bar’s close.
Intrabar Checks: Stop-loss and take-profit levels (if enabled) are monitored on every tick. If either is reached, the position closes immediately, without waiting for the bar to end.
3. Exit Logic
All Conditions Must Agree: If the trade is still open (SL/TP not triggered), then all enabled exit indicators must confirm a closure before the script exits on the bar’s close.
4. Time Filter
Optional Trading Window: You can activate a date/time range to constrain entries and exits strictly to that interval.
Justification of Methodology
Indicator Confluence: Combining multiple tools (RSI, MACD, etc.) can reduce noise and false signals.
Intrabar SL/TP: Capturing real-time spikes or dips provides a more precise reflection of typical live trading scenarios.
Single-Entry Model: Straightforward for both manual and automated tracking (especially important in bridging to bots).
Custom Date Range: Helps refine backtesting for specific market conditions or to avoid known irregular data periods.
How to Use
1. Add the Script to Your Chart
In TradingView, open Indicators , search for “Multi-indicator Signal Builder”.
Click to add it to your chart.
2. Configure Inputs
Time Filter: Set a start and end date for trades.
Alerts Messages: Input any JSON or text payload needed by your external service or bot.
Entry Conditions: Enable and configure any indicators (e.g., RSI, MACD) for a confluence-based entry.
Close Conditions: Enable exit indicators, along with optional SL (negative %) and TP (positive %) levels.
3. Set Up Alerts
In TradingView, select “Create Alert” → Condition = “Any alert() function call” → choose this script.
Entry Alert: Triggers on the script’s entry signal.
Close Alert: Triggers on the script’s close signal (or if SL/TP is hit).
Skyrexio Alert Bots: You can route these alerts via webhook to Skyrexio alert bots to automate order execution on major crypto exchanges (or any other supported broker).
4. Visual Reference
A condition table at the bottom summarizes active signals.
Statistics Label updates automatically as trades are closed, showing PnL stats and distribution metrics.
Backtesting Guidelines
Symbol/Timeframe: Works on multiple assets and timeframes; always do thorough testing.
Realistic Costs: Adjust commissions and potential slippage to match typical exchange conditions.
Risk Management: If using the built-in stop-loss/take-profit, set percentages that reflect your personal risk tolerance.
Longer Test Horizons: Verify performance across diverse market cycles to gauge reliability.
Example of statistic calculation
Test Period: 2023-01-01 to 2025-12-31
Initial Capital: $1,000
Commission: 0.1%, Slippage ~5 ticks
Trade Count: 468 (varies by strategy conditions)
Win rate: 76% (varies by strategy conditions)
Net Profit: +96.17% (varies by strategy conditions)
Disclaimer
This indicator is provided strictly for informational and educational purposes .
It does not constitute financial or trading advice.
Past performance never guarantees future results.
Always test thoroughly in demo environments before using real capital.
Enjoy exploring the Multi-Indicator Signal Builder! Experiment with different indicator combinations and adjust parameters to align with your trading preferences, whether you trade manually or link your alerts to external automation services. Happy trading and stay safe!

Automatic comparison of symbols depending on custom listIn the indicator settings, specify a list of tickers and the corresponding symbol for comparison (e.g. TVC:DXY). Each new list must be on a separate line. The line must begin with the symbol for comparison, then an equal sign (=), and then a list of tickers separated by commas (e.g. OANDA:XAUUSD, OANDA:XAGUSD). If the ticker selected in the chart window is not found in any of the lists, then the symbol from the first list, which is specified before the equal sign, will be used as the symbol for comparison. For example:
TVC:DXY = OANDA:XAUUSD, OANDA:XAGUSD
OANDA:BCOUSD = OANDA:SPX500USD
OANDA:SPX500USD = BINANCE:BTCUSDT
***
Автоматическое сравнение символов в зависимости от настраиваемого списка
В настройках индикатора укажите список тикеров и соответствующий символ для сравнения. Каждый новый список должен быть на отдельной строке. В начале строки должен быть указан символ для сравнения (например, TVC:DXY), затем знак равенства (=) и после него список тикеров, разделенных запятыми (например, OANDA:XAUUSD, OANDA:XAGUSD). Если выбранный в окне графика тикер не будет найден ни в одном из списков, то в качестве символа для сравнения ему будет соответствовать символ из первого списка, который указан перед знаком равенства. Например:
TVC:DXY = OANDA:XAUUSD, OANDA:XAGUSD
OANDA:BCOUSD = OANDA:SPX500USD
OANDA:SPX500USD = BINANCE:BTCUSDT

Combined VolumeThis indicator displays the combined volume for all the exchanges listed in the settings menu.
For example, with the default settings, on BTCUSD the indicator will display the current market's volume AND the volume of all other major exchanges listed on TradingView.
The gray indicator value is the current exchange's volume, the colored volume is the combined volume of all other exchanges, allowing you to compare the current exchange's volume to the broad market to give you a better idea of local exchange activity versus broad market activity.
If you want to add more exchange tickers, turn "debug" mode on and a small label will appear in the top right telling you which market type & exchange ticker you're currently on. All exchange tickers must be separated by a comma.
The "Other Exchanges" input setting overrides all other lists allowing you to specify your own exchange list for assets not provided by the default settings (the indicator supports crypto, forex and stocks by default).

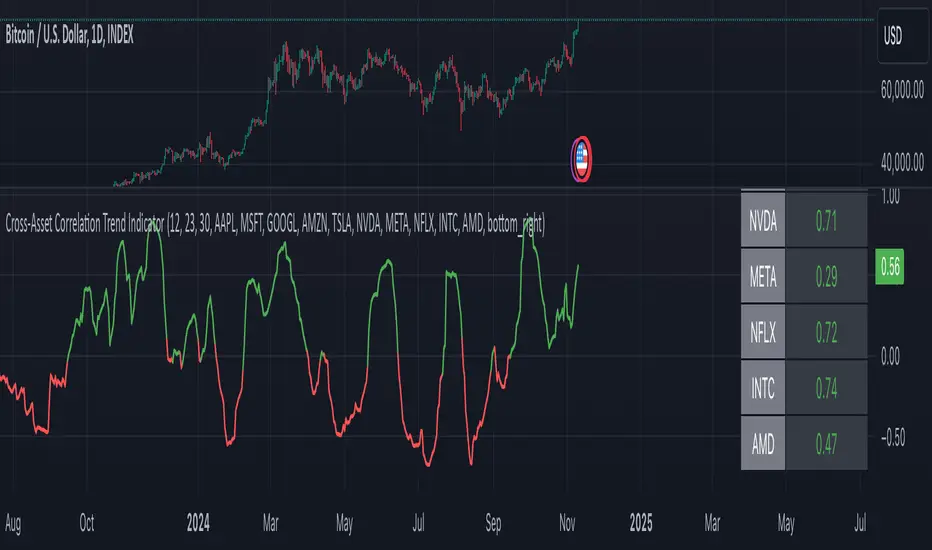
Cross-Asset Correlation Trend IndicatorCross-Asset Correlation Trend Indicator
This indicator uses correlations between the charted asset and ten others to calculate an overall trend prediction. Each ticker is configurable, and by analyzing the trend of each asset, the indicator predicts an average trend for the main asset on the chart. The strength of each asset's trend is weighted by its correlation to the charted asset, resulting in a single average trend signal. This can be a rather robust and effective signal, though it is often slow.
Functionality Overview :
The Cross-Asset Correlation Trend Indicator calculates the average trend of a charted asset based on the correlation and trend of up to ten other assets. Each asset is assigned a trend signal using a simple EMA crossover method (two customizable EMAs). If the shorter EMA crosses above the longer one, the asset trend is marked as positive; if it crosses below, the trend is negative. Each trend is then weighted by the correlation coefficient between that asset’s closing price and the charted asset’s closing price. The final output is an average weighted trend signal, which combines each trend with its respective correlation weight.
Input Parameters :
EMA 1 Length : Sets the period of the shorter EMA used to determine trends.
EMA 2 Length : Sets the period of the longer EMA used to determine trends.
Correlation Length : Defines the lookback period used for calculating the correlation between the charted asset and each of the other selected assets.
Asset Tickers : Each of the ten tickers is configurable, allowing you to set specific assets to analyze correlations with the charted asset.
Show Trend Table : Toggle to show or hide a table with each asset’s weighted trend. The table displays green, red, or white text for each weighted trend, indicating positive, negative, or neutral trends, respectively.
Table Position : Choose the position of the trend table on the chart.
Recommended Use :
As always, it’s essential to backtest the indicator thoroughly on your chosen asset and timeframe to ensure it aligns with your strategy. Feel free to modify the input parameters as needed—while the defaults work well for me, they may need adjustment to better suit your assets, timeframes, and trading style.
As always, I wish you the best of luck and immense fortune as you develop your systems. May this indicator help you make well-informed, profitable decisions!
Forex Heatmap█ OVERVIEW
This indicator creates a dynamic grid display of currency pair cross rates (exchange rates) and percentage changes, emulating the Cross Rates and Heat Map widgets available on our Forex page. It provides a view of realtime exchange rates for all possible pairs derived from a user-specified list of currencies, allowing users to monitor the relative performance of several currencies directly on a TradingView chart.
█ CONCEPTS
Foreign exchange
The Foreign Exchange (Forex/FX) market is the largest, most liquid financial market globally, with an average daily trading volume of over 5 trillion USD. Open 24 hours a day, five days a week, it operates through a decentralized network of financial hubs in various major cities worldwide. In this market, participants trade currencies in pairs , where the listed price of a currency pair represents the exchange rate from a given base currency to a specific quote currency . For example, the "EURUSD" pair's price represents the amount of USD (quote currency) that equals one unit of EUR (base currency). Globally, the most traded currencies include the U.S. dollar (USD), Euro (EUR), Japanese yen (JPY), British pound (GBP), and Australian dollar (AUD), with USD involved in over 87% of all trades.
Understanding the Forex market is essential for traders and investors, even those who do not trade currency pairs directly, because exchange rates profoundly affect global markets. For instance, fluctuations in the value of USD can impact the demand for U.S. exports or the earnings of companies that handle multinational transactions, either of which can affect the prices of stocks, indices, and commodities. Additionally, since many factors influence exchange rates, including economic policies and interest rate changes, analyzing the exchange rates across currencies can provide insight into global economic health.
█ FEATURES
Requesting a list of currencies
This indicator requests data for every valid currency pair combination from the list of currencies defined by the "Currency list" input in the "Settings/Inputs" tab. The list can contain up to six unique currency codes separated by commas, resulting in a maximum of 30 requested currency pairs.
For example, if the specified "Currency list" input is "CAD, USD, EUR", the indicator requests and displays relevant data for six currency pair combinations: "CADUSD", "USDCAD", "CADEUR", "EURCAD", "USDEUR", "EURUSD". See the "Grid display" section below to understand how the script organizes the requested information.
Each item in the comma-separated list must represent a valid currency code. If the "Currency list" input contains an invalid currency code, the corresponding cells for that currency in the "Cross rates" or "Heat map" grid show "NaN" values. If the list contains empty items, e.g., "CAD, ,EUR, ", the indicator ignores them in its data requests and calculations.
NOTE: Some uncommon currency pair combinations might not have data feeds available. If no available symbols provide the exchange rates between two specified currencies, the corresponding table cells show "NaN" results.
Realtime data
The indicator retrieves realtime market prices, daily price changes, and minimum tick sizes for all the currency pairs derived from the "Currency list" input. It updates the retrieved information shown in its grid display after new ticks become available to reflect the latest known values.
NOTE: Pine scripts execute on realtime bars only when new ticks are available in the chart's data feed. If no new updates are available from the chart's realtime feed, it may cause a delay in the data the indicator receives.
Grid display
This indicator displays the requested data for each currency pair in a table with cells organized as a grid. Each row name corresponds to a pair's base currency , and each column name corresponds to a quote currency . The cell at the intersection of a specific row and column shows the value requested from the corresponding currency pair.
For example, the cell at the intersection of a "EUR" row and "USD" column shows the data retrieved for the "EURUSD" currency pair, and the cell at the "USD" row and "EUR" column shows data for the inverse pair ("USDEUR").
Note that the main diagonal cells in the table, where rows and columns with the same names intersect, are blank. The exchange rate from one currency to itself is always 1, and no Forex symbols such as "EUREUR" exist.
The dropdown input at the top of the "Settings/Inputs" tab determines the type of information displayed in the table. Two options are available: "Cross rates" and "Heat map" . Both modes color their cells for light and dark themes separately based on the inputs in the "Colors" section.
Cross rates
When a user selects the "Cross rates" display mode, the table's cells show the latest available exchange rate for each currency pair, emulating the behavior of the Cross Rates widget. Each cell's value represents the amount of the quote currency (column name) that equals one unit of the base currency (row name). This display allows users to compare cross rates across currency pairs, and their inverses.
The background color of each cell changes based on the most recent update to the exchange rate, allowing users to monitor the direction of short-term fluctuations as they occur. By default, the background turns green (positive cell color) when the cross rate increases from the last recorded update and red (negative cell color) when the rate decreases. The cell's color reverts to the chart's background color after no new updates are available for 200 milliseconds.
Heat map
When a user selects the "Heat map" display mode, the table's cells show the latest daily percentage change of each currency pair, emulating the behavior of the Heat Map widget.
In this mode, the background color of each cell depends on the corresponding currency pair's daily performance. Heat maps typically use colors that vary in intensity based on the calculated values. This indicator uses the following color coding by default:
• Green (Positive cell color): Percentage change > +0.1%
• No color: Percentage change between 0.0% and +0.1%
• Bright red (Negative cell color): Percentage change < -0.1%
• Lighter/darker red (Minor negative cell color): Percentage change between 0.0% and -0.1%
█ FOR Pine Script™ CODERS
• This script utilizes dynamic requests to iteratively fetch information from multiple contexts using a single request.security() instance in the code. Previously, `request.*()` functions were not allowed within the local scopes of loops or conditional structures, and most `request.*()` function parameters, excluding `expression`, required arguments of a simple or weaker qualified type. The new `dynamic_requests` parameter in script declaration statements enables more flexibility in how scripts can use `request.*()` calls. When its value is `true`, all `request.*()` functions can accept series arguments for the parameters that define their requested contexts, and `request.*()` functions can execute within local scopes. See the Dynamic requests section of the Pine Script™ User Manual to learn more.
• Scripts can execute up to 40 unique `request.*()` function calls. A `request.*()` call is unique only if the script does not already call the same function with the same arguments. See this section of the User Manual's Limitations page for more information.
• Typically, when requesting higher-timeframe data with request.security() using barmerge.lookahead_on as the `lookahead` argument, the `expression` argument should use the history-referencing operator to offset the series, preventing lookahead bias on historical bars. However, the request.security() call in this script uses barmerge.lookahead_on without offsetting the `expression` because the script only displays results for the latest historical bar and all realtime bars, where there is no future information to leak into the past. Instead, using this call on those bars ensures each request fetches the most recent data available from each context.
• The request.security() instance in this script includes a `calc_bars_count` argument to specify that each request retrieves only a minimal number of bars from the end of each symbol's historical data feed. The script does not need to request all the historical data for each symbol because it only shows results on the last chart bar that do not depend on the entire time series. In this case, reducing the retrieved bars in each request helps minimize resource usage without impacting the calculated results.
Look first. Then leap.

JordanSwindenLibraryLibrary "JordanSwindenLibrary"
TODO: add library description here
getDecimals()
Calculates how many decimals are on the quote price of the current market
Returns: The current decimal places on the market quote price
getPipSize(multiplier)
Calculates the pip size of the current market
Parameters:
multiplier (int) : The mintick point multiplier (1 by default, 10 for FX/Crypto/CFD but can be used to override when certain markets require)
Returns: The pip size for the current market
truncate(number, decimalPlaces)
Truncates (cuts) excess decimal places
Parameters:
number (float) : The number to truncate
decimalPlaces (simple float) : (default=2) The number of decimal places to truncate to
Returns: The given number truncated to the given decimalPlaces
toWhole(number)
Converts pips into whole numbers
Parameters:
number (float) : The pip number to convert into a whole number
Returns: The converted number
toPips(number)
Converts whole numbers back into pips
Parameters:
number (float) : The whole number to convert into pips
Returns: The converted number
getPctChange(value1, value2, lookback)
Gets the percentage change between 2 float values over a given lookback period
Parameters:
value1 (float) : The first value to reference
value2 (float) : The second value to reference
lookback (int) : The lookback period to analyze
Returns: The percent change over the two values and lookback period
random(minRange, maxRange)
Wichmann–Hill Pseudo-Random Number Generator
Parameters:
minRange (float) : The smallest possible number (default: 0)
maxRange (float) : The largest possible number (default: 1)
Returns: A random number between minRange and maxRange
bullFib(priceLow, priceHigh, fibRatio)
Calculates a bullish fibonacci value
Parameters:
priceLow (float) : The lowest price point
priceHigh (float) : The highest price point
fibRatio (float) : The fibonacci % ratio to calculate
Returns: The fibonacci value of the given ratio between the two price points
bearFib(priceLow, priceHigh, fibRatio)
Calculates a bearish fibonacci value
Parameters:
priceLow (float) : The lowest price point
priceHigh (float) : The highest price point
fibRatio (float) : The fibonacci % ratio to calculate
Returns: The fibonacci value of the given ratio between the two price points
getMA(length, maType)
Gets a Moving Average based on type (! MUST BE CALLED ON EVERY TICK TO BE ACCURATE, don't place in scopes)
Parameters:
length (simple int) : The MA period
maType (string) : The type of MA
Returns: A moving average with the given parameters
barsAboveMA(lookback, ma)
Counts how many candles are above the MA
Parameters:
lookback (int) : The lookback period to look back over
ma (float) : The moving average to check
Returns: The bar count of how many recent bars are above the MA
barsBelowMA(lookback, ma)
Counts how many candles are below the MA
Parameters:
lookback (int) : The lookback period to look back over
ma (float) : The moving average to reference
Returns: The bar count of how many recent bars are below the EMA
barsCrossedMA(lookback, ma)
Counts how many times the EMA was crossed recently (based on closing prices)
Parameters:
lookback (int) : The lookback period to look back over
ma (float) : The moving average to reference
Returns: The bar count of how many times price recently crossed the EMA (based on closing prices)
getPullbackBarCount(lookback, direction)
Counts how many green & red bars have printed recently (ie. pullback count)
Parameters:
lookback (int) : The lookback period to look back over
direction (int) : The color of the bar to count (1 = Green, -1 = Red)
Returns: The bar count of how many candles have retraced over the given lookback & direction
getBodySize()
Gets the current candle's body size (in POINTS, divide by 10 to get pips)
Returns: The current candle's body size in POINTS
getTopWickSize()
Gets the current candle's top wick size (in POINTS, divide by 10 to get pips)
Returns: The current candle's top wick size in POINTS
getBottomWickSize()
Gets the current candle's bottom wick size (in POINTS, divide by 10 to get pips)
Returns: The current candle's bottom wick size in POINTS
getBodyPercent()
Gets the current candle's body size as a percentage of its entire size including its wicks
Returns: The current candle's body size percentage
isHammer(fib, colorMatch)
Checks if the current bar is a hammer candle based on the given parameters
Parameters:
fib (float) : (default=0.382) The fib to base candle body on
colorMatch (bool) : (default=false) Does the candle need to be green? (true/false)
Returns: A boolean - true if the current bar matches the requirements of a hammer candle
isStar(fib, colorMatch)
Checks if the current bar is a shooting star candle based on the given parameters
Parameters:
fib (float) : (default=0.382) The fib to base candle body on
colorMatch (bool) : (default=false) Does the candle need to be red? (true/false)
Returns: A boolean - true if the current bar matches the requirements of a shooting star candle
isDoji(wickSize, bodySize)
Checks if the current bar is a doji candle based on the given parameters
Parameters:
wickSize (float) : (default=2) The maximum top wick size compared to the bottom (and vice versa)
bodySize (float) : (default=0.05) The maximum body size as a percentage compared to the entire candle size
Returns: A boolean - true if the current bar matches the requirements of a doji candle
isBullishEC(allowance, rejectionWickSize, engulfWick)
Checks if the current bar is a bullish engulfing candle
Parameters:
allowance (float) : (default=0) How many POINTS to allow the open to be off by (useful for markets with micro gaps)
rejectionWickSize (float) : (default=disabled) The maximum rejection wick size compared to the body as a percentage
engulfWick (bool) : (default=false) Does the engulfing candle require the wick to be engulfed as well?
Returns: A boolean - true if the current bar matches the requirements of a bullish engulfing candle
isBearishEC(allowance, rejectionWickSize, engulfWick)
Checks if the current bar is a bearish engulfing candle
Parameters:
allowance (float) : (default=0) How many POINTS to allow the open to be off by (useful for markets with micro gaps)
rejectionWickSize (float) : (default=disabled) The maximum rejection wick size compared to the body as a percentage
engulfWick (bool) : (default=false) Does the engulfing candle require the wick to be engulfed as well?
Returns: A boolean - true if the current bar matches the requirements of a bearish engulfing candle
isInsideBar()
Detects inside bars
Returns: Returns true if the current bar is an inside bar
isOutsideBar()
Detects outside bars
Returns: Returns true if the current bar is an outside bar
barInSession(sess, useFilter)
Determines if the current price bar falls inside the specified session
Parameters:
sess (simple string) : The session to check
useFilter (bool) : (default=true) Whether or not to actually use this filter
Returns: A boolean - true if the current bar falls within the given time session
barOutSession(sess, useFilter)
Determines if the current price bar falls outside the specified session
Parameters:
sess (simple string) : The session to check
useFilter (bool) : (default=true) Whether or not to actually use this filter
Returns: A boolean - true if the current bar falls outside the given time session
dateFilter(startTime, endTime)
Determines if this bar's time falls within date filter range
Parameters:
startTime (int) : The UNIX date timestamp to begin searching from
endTime (int) : the UNIX date timestamp to stop searching from
Returns: A boolean - true if the current bar falls within the given dates
dayFilter(monday, tuesday, wednesday, thursday, friday, saturday, sunday)
Checks if the current bar's day is in the list of given days to analyze
Parameters:
monday (bool) : Should the script analyze this day? (true/false)
tuesday (bool) : Should the script analyze this day? (true/false)
wednesday (bool) : Should the script analyze this day? (true/false)
thursday (bool) : Should the script analyze this day? (true/false)
friday (bool) : Should the script analyze this day? (true/false)
saturday (bool) : Should the script analyze this day? (true/false)
sunday (bool) : Should the script analyze this day? (true/false)
Returns: A boolean - true if the current bar's day is one of the given days
atrFilter(atrValue, maxSize)
Parameters:
atrValue (float)
maxSize (float)
tradeCount()
Calculate total trade count
Returns: Total closed trade count
isLong()
Check if we're currently in a long trade
Returns: True if our position size is positive
isShort()
Check if we're currently in a short trade
Returns: True if our position size is negative
isFlat()
Check if we're currentlyflat
Returns: True if our position size is zero
wonTrade()
Check if this bar falls after a winning trade
Returns: True if we just won a trade
lostTrade()
Check if this bar falls after a losing trade
Returns: True if we just lost a trade
maxDrawdownRealized()
Gets the max drawdown based on closed trades (ie. realized P&L). The strategy tester displays max drawdown as open P&L (unrealized).
Returns: The max drawdown based on closed trades (ie. realized P&L). The strategy tester displays max drawdown as open P&L (unrealized).
totalPipReturn()
Gets the total amount of pips won/lost (as a whole number)
Returns: Total amount of pips won/lost (as a whole number)
longWinCount()
Count how many winning long trades we've had
Returns: Long win count
shortWinCount()
Count how many winning short trades we've had
Returns: Short win count
longLossCount()
Count how many losing long trades we've had
Returns: Long loss count
shortLossCount()
Count how many losing short trades we've had
Returns: Short loss count
breakEvenCount(allowanceTicks)
Count how many break-even trades we've had
Parameters:
allowanceTicks (float) : Optional - how many ticks to allow between entry & exit price (default 0)
Returns: Break-even count
longCount()
Count how many long trades we've taken
Returns: Long trade count
shortCount()
Count how many short trades we've taken
Returns: Short trade count
longWinPercent()
Calculate win rate of long trades
Returns: Long win rate (0-100)
shortWinPercent()
Calculate win rate of short trades
Returns: Short win rate (0-100)
breakEvenPercent(allowanceTicks)
Calculate break even rate of all trades
Parameters:
allowanceTicks (float) : Optional - how many ticks to allow between entry & exit price (default 0)
Returns: Break-even win rate (0-100)
averageRR()
Calculate average risk:reward
Returns: Average winning trade divided by average losing trade
unitsToLots(units)
(Forex) Convert the given unit count to lots (multiples of 100,000)
Parameters:
units (float) : The units to convert into lots
Returns: Units converted to nearest lot size (as float)
getFxPositionSize(balance, risk, stopLossPips, fxRate, lots)
(Forex) Calculate fixed-fractional position size based on given parameters
Parameters:
balance (float) : The account balance
risk (float) : The % risk (whole number)
stopLossPips (float) : Pip distance to base risk on
fxRate (float) : The conversion currency rate (more info below in library documentation)
lots (bool) : Whether or not to return the position size in lots rather than units (true by default)
Returns: Units/lots to enter into "qty=" parameter of strategy entry function
EXAMPLE USAGE:
string conversionCurrencyPair = (strategy.account_currency == syminfo.currency ? syminfo.tickerid : strategy.account_currency + syminfo.currency)
float fx_rate = request.security(conversionCurrencyPair, timeframe.period, close )
if (longCondition)
strategy.entry("Long", strategy.long, qty=zen.getFxPositionSize(strategy.equity, 1, stopLossPipsWholeNumber, fx_rate, true))
skipTradeMonteCarlo(chance, debug)
Checks to see if trade should be skipped to emulate rudimentary Monte Carlo simulation
Parameters:
chance (float) : The chance to skip a trade (0-1 or 0-100, function will normalize to 0-1)
debug (bool) : Whether or not to display a label informing of the trade skip
Returns: True if the trade is skipped, false if it's not skipped (idea being to include this function in entry condition validation checks)
fillCell(tableID, column, row, title, value, bgcolor, txtcolor, tooltip)
This updates the given table's cell with the given values
Parameters:
tableID (table) : The table ID to update
column (int) : The column to update
row (int) : The row to update
title (string) : The title of this cell
value (string) : The value of this cell
bgcolor (color) : The background color of this cell
txtcolor (color) : The text color of this cell
tooltip (string)
Returns: Nothing.

Sylvain Zig-Zag [MyTradingCoder]This Pine Script version of ZigZagHighLow is a faithful port of Sylvain Vervoort's original study, initially implemented in NinjaScript and later added to the thinkorswim standard library. This indicator identifies and connects swing points in price data, offering a clear visualization of market moves that exceed a specified threshold. Additionally, it now includes features for detecting and plotting support and resistance levels, enhancing its utility for technical analysis.
Overview
The Sylvain Zig-Zag study excels at highlighting significant price swings by plotting points where the price change, combined with volatility adjustments via the Average True Range (ATR), exceeds a user-defined percentage. It effectively smooths out minor fluctuations, allowing traders to focus on the primary market trends. This tool is particularly useful in identifying potential turning points, trends in price movements, and key support and resistance levels, making it a valuable addition to your technical analysis arsenal.
How It Works
The Sylvain Zig-Zag indicator works by detecting swing points in the price data and connecting them to form a zigzag pattern. A swing point is identified when the price moves a certain distance, defined by a combination of percentage change and ATR. This distance must be exceeded for a swing point to be plotted.
When the price moves upwards and exceeds the previous high by a specified percentage plus a factor of the ATR, a new high swing point is plotted. Conversely, a low swing point is plotted when the price moves downwards and exceeds the previous low by the same criteria. This ensures that only significant price moves are considered, filtering out minor fluctuations and providing a clear view of the overall market trend.
In addition to plotting zigzag lines, the indicator can now identify and draw support and resistance levels based on the detected swing points. These levels are crucial for identifying potential reversal areas and market structure.
Key Features
Swing Point Detection: Accurately identifies significant price swings by considering both percentage price change and volatility (via Average True Range).
Dynamic Support/Resistance: Automatically generates support and resistance lines based on the identified swing points, providing potential areas of price reversals.
Customizable Parameters: Tailor the indicator's sensitivity to your preferred trading style and market conditions. Adjust parameters like percentage reversal, ATR settings, and absolute/tick reversals.
Visual Clarity: Choose to display the ZigZag line, support/resistance levels, new trend icons, continuation icons, and even customize bar colors for easy visual analysis.
Trading Applications
Trend Identification: Easily visualize the prevailing market trend using the direction of the ZigZag line and support/resistance levels.
Entry/Exit Signals: Potential entry points can be identified when the price interacts with the dynamic support/resistance levels.
Stop-Loss Placement: Use recent swing points as logical places for setting stop-loss orders.
Profit Targets: Project potential price targets based on the distance between previous swing points.
Input Parameters
Several input parameters can be adjusted to customize the behavior of the Sylvain Zig-Zag indicator. These parameters allow traders to fine-tune the detection of swing points and support/resistance levels to better suit their trading strategy and the specific market conditions they are analyzing.
High Source and Low Source:
These inputs define the price points used for detecting high and low swing points, respectively. You can choose between high, low, open, or close prices for these calculations.
Percentage Reversal:
This input sets the minimum percentage change in price required for a swing to be detected. A higher percentage value will result in fewer but more significant swing points, while a lower value will detect more frequent, smaller swings.
Absolute Reversal:
This parameter allows for an additional fixed value to be added to the minimum price change and ATR change. This can be useful for increasing the distance between swing points in volatile markets.
ATR Length:
This input defines the period used for calculating the ATR, which is a measure of market volatility. A longer ATR period will smooth out the ATR calculation, while a shorter period will make it more sensitive to recent price changes.
ATR Multiplier:
This factor is applied to the ATR value to adjust the sensitivity of the swing point detection. A higher multiplier will increase the required price movement for a swing point to be plotted, reducing the number of detected swings.
Tick Reversal:
This input allows for an additional value in ticks to be added to the minimum price change and ATR change, providing further customization in the swing point detection process.
Support and Resistance:
Show S/R: Enable or disable the plotting of support and resistance levels.
Max S/R Levels: Set the maximum number of support and resistance levels to display.
S/R Line Width: Adjust the width of the support and resistance lines.
Visual Settings
The Sylvain Zig-Zag indicator also includes visual settings to enhance the clarity of the plotted swing points and trends. You can customize the color and width of the zigzag line, and enable icons to indicate new trends and continuation patterns. Additionally, the bars can be colored based on the detected trend, aiding in quick visual analysis.
Conclusion
This port of the ZigZagHighLow study from NinjaScript to Pine Script preserves the essence of Sylvain Vervoort’s methodology while adding new features for support and resistance. It provides traders with a powerful tool for technical analysis. The combination of price changes and ATR ensures that you have a robust and adaptable tool for identifying key market movements and structural levels. Customize the settings to match your trading style and gain a clearer picture of market trends, turning points, and support/resistance areas. Enjoy improved market analysis and more informed trading decisions with the Sylvain Zig-Zag indicator.

Market Internals & InfoThis script provides various information on Market Internals and other related info. It was a part of the Daily Levels script but that script was getting very large so I decided to separate this piece of it into its own indicator. I plan on adding some additional features in the near future so stay tuned for those!
The script provides customizability to show certain market internals, tickers, and even Market Profile TPO periods.
Here is a summary of each setting:
NASDAQ and NYSE Breadth Ratio
- Ratio between Up Volume and Down Volume for NASDAQ and NYSE markets. This can help inform about the type of volume flowing in and out of these exchanges.
Advance/Decline Line (ADL)
The ADL focuses specifically on the number of advancing and declining stocks within an index, without considering their trading volume.
Here's how the ADL works:
It tracks the daily difference between the number of stocks that are up in price (advancing) and the number of stocks that are down in price (declining) within a particular index.
The ADL is a cumulative measure, meaning each day's difference is added to the previous day's total.
If there are more advancing stocks, the ADL goes up.
If there are more declining stocks, the ADL goes down.
By analyzing the ADL, investors can get a sense of how many stocks are participating in a market move.
Here's what the ADL can tell you:
Confirmation of Trends: When the ADL moves in the same direction as the underlying index (e.g., ADL rising with a rising index), it suggests broad participation in the trend and potentially stronger momentum.
Divergence: If the ADL diverges from the index (e.g., ADL falling while the index is rising), it can be a warning sign. This suggests that fewer stocks are participating in the rally, which could indicate a weakening trend.
Keep in mind:
The ADL is a backward-looking indicator, reflecting past market activity.
It's often used in conjunction with other technical indicators for a more complete picture.
TRIN Arms Index
The TRIN index, also called the Arms Index or Short-Term Trading Index, is a technical analysis tool used in the stock market to gauge market breadth and sentiment. It essentially compares the number of advancing stocks (gaining in price) to declining stocks (losing price) along with their trading volume.
Here's how to interpret the TRIN:
High TRIN (above 1.0): This indicates a weak market where declining stocks and their volume are dominating the market. It can be a sign of a potential downward trend.
Low TRIN (below 1.0): This suggests a strong market where advancing stocks and their volume are in control. It can be a sign of a potential upward trend.
TRIN around 1.0: This represents a more balanced market, where it's difficult to say which direction the market might be headed.
Important points to remember about TRIN:
It's a short-term indicator, primarily used for intraday trading decisions.
It should be used in conjunction with other technical indicators for a more comprehensive market analysis. High or low TRIN readings don't guarantee future price movements.
VIX/VXN
VIX and VXN are both indexes created by the Chicago Board Options Exchange (CBOE) to measure market volatility. They differ based on the underlying index they track:
VIX (Cboe Volatility Index): This is the more well-known index and is considered the "fear gauge" of the stock market. It reflects the market's expectation of volatility in the S&P 500 index over the next 30 days.
VXN (Cboe Nasdaq Volatility Index): This is a counterpart to the VIX, but instead gauges volatility expectations for the Nasdaq 100 index over the coming 30 days. The tech-heavy Nasdaq can sometimes diverge from the broader market represented by the S&P 500, hence the need for a separate volatility measure.
Both VIX and VXN are calculated based on the implied volatilities of options contracts listed on their respective indexes. Here's a general interpretation:
High VIX/VXN: Indicates a high level of fear or uncertainty in the market, suggesting investors expect significant price fluctuations in the near future.
Low VIX/VXN: Suggests a more complacent market with lower expectations of volatility.
Important points to remember about VIX and VXN:
They are forward-looking indicators, reflecting market sentiment about future volatility, not necessarily current market conditions.
High VIX/VXN readings don't guarantee a market crash, and low readings don't guarantee smooth sailing.
These indexes are often used by investors to make decisions about portfolio allocation and hedging strategies.
Inside/Outside Day
This provides a quick indication of it we are still trading inside or outside of yesterdays range and will show "Inside Day" or "Outside Day" based upon todays range vs. yesterday's range.
Custom Ticker Choices
Ability to add up to 5 other tickers that can be tracked within the table
Show Market Profile TPO
This only shows on timeframes less than 30m. It will show both the current TPO period and the remaining time within that period.
Table Customization
Provided drop downs to change the text size and also the location of the table.

Footprint liteFootprint Lite enables you to monitor volume distribution for the current ticker, offering resolutions as 1 second, segmented by specified price levels with visual representations. Additionally, you have the flexibility to customize the displayed Imbalance price level and the number of consecutive Imbalance level lines.
Here are the input options:
Group Display:
This section allows you to adjust how Footprints are displayed.
"Count show bars": Directly adjusts the display to show the last 'n' bars.
"Display all available bars": Shows all available bars.
Group Row size:
Adjusts the parameters for generating Footprints based on price step size.
"Ticks Per Row": Directly sets the price step, calculated by multiplying the entered value by syminfo.mintick.
"Auto": Enables automatic mode for selecting the "Ticks Per Row" value.
"Max row": Relevant for auto mode, it sets the acceptable number of rows within a bar. The automatic "Ticks Per Row" calculation is based on the first available bar and applied to subsequent bars.
Group Imbalance:
Customizes the display of price levels represented by Imbalance and emphasizes consecutive lines.
"Imbalance Percent": A coefficient expressed as a percentage to determine the Imbalance of price levels, comparing the buy price diagonally to the previous sell price.
"Stacked levels": Sets the minimum number of consecutive Imbalance levels required to draw extended lines.
Alerts:
You can set alerts for various events:
"New imbalance line sell": Alerts on the appearance of a new imbalance line for selling.
"New imbalance line buy": Alerts on the appearance of a new imbalance line for buying.
"Stop past imbalance line sell": Alerts when the previous imbalance line for selling stops, indicating it has reached the range from low to high of the current bar.
"Stop past imbalance line buy": Alerts when the previous imbalance line for buying stops, indicating it is within the range from low to high of the current bar.
"New imbalance buy": Alerts on the appearance of a new or change in the current imbalance level for buying.
"New imbalance sell": Alerts on the appearance of a new or change in the current imbalance level for selling.

Market Performance TableThe Market Performance Table displays the performance of multiple tickers (up to 5) in a table format. The tickers can be customized by selecting them through the indicator settings.
The indicator calculates various metrics for each ticker, including the 1-day change percentage, whether the price is above the 50, 20, and 10-day simple moving averages (SMA), as well as the relative strength compared to the 10/20 SMA and 20/50 SMA crossovers. It also calculates the price deviation from the 50-day SMA.
The table is displayed on the chart and can be positioned in different locations.
Credits for the idea to @Alex_PrimeTrading ;)

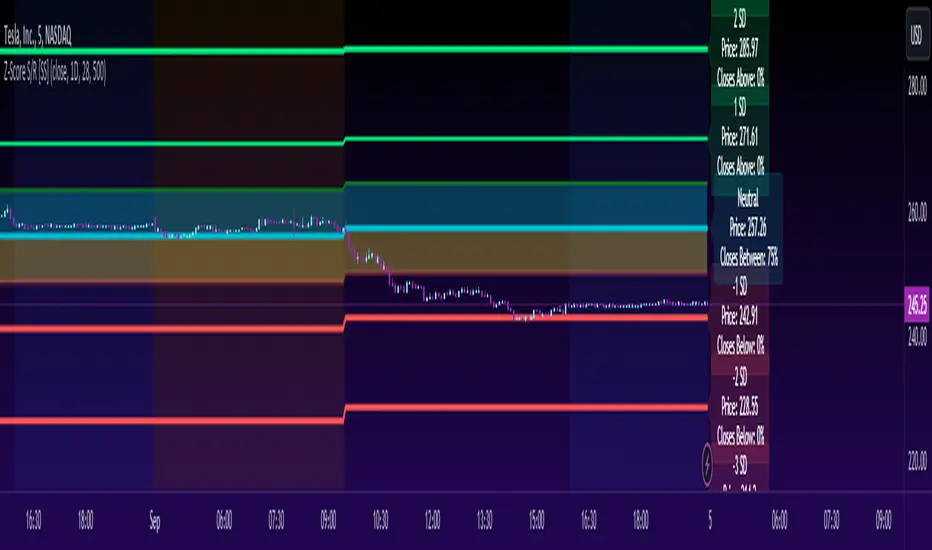
Z-Score Support & Resistance [SS}Hello everyone,
This is the Z-Score Support and Resistance (S/R) indicator.
How it works:
The trouble with most indicators and strategies that rely on distributions is that they are constantly moving targets.
To combat this, what I have done is anchored the assessment of the normal distribution to the period open price and dropped the data from the current day.
This provides us with a static assessment of the current distribution and static target levels.
It then plots out an assessment of what would be neutral (0 Standard Deviations) all the way up to +3 Standard Deviations and all the way down to -3 Standard Deviations.
It can plot out this assessment on any timeframe, from the minutes to the months to the years, simply select which desired timeframe you want in the settings menu (default is 9 which seems to work well for most generic tickers and indicies).
The indicator will also count the number of times a ticker has closed within each designated period. To do this, please make sure that you have the assessment timeframe opened on the chart. So if you want to look at the instances on the daily timeframe, ensure you have the daily timeframe opened. If you want to look on the monthly, ensure you have the monthly opened, etc. (See below):
How to Use:
To use the indicator, its pretty simple.
Simply select the desired timeframe you want to use as S/R and use it!
You can adjust the period lookback from the defaulted 9 period based on:
a) The degree of normality in the dataset (you can use a kurtosis indicator to help you ascertain this); or
b) The back-test results of closes within a desired range.
For the later, you can see an example below:
This is TSLA with a 9 period lookback:
We can see that 50% of closes are happening within 0.5 and -0.5 standard deviations. If we extend this to a 15 period lookback:
Now over 60% of closes are happening in this area.
Why does this matter? Well, because now we know our prime short and long entries (see below):
The green arrows represent prime long setups and the red prime short setups.
This is because we know, 61% of the time the ticker will close between 0.5 and -0.5 standard deviations, so we can trade the ticker back to this area.
Further instructions:
Because it is somewhat of a complex indicator, I have done a tutorial video that I will link below here:
And that is the indicator my friends! Hopefully you enjoy :-).
As always, leave your comments and suggestions / Questions below!
Safe trades!
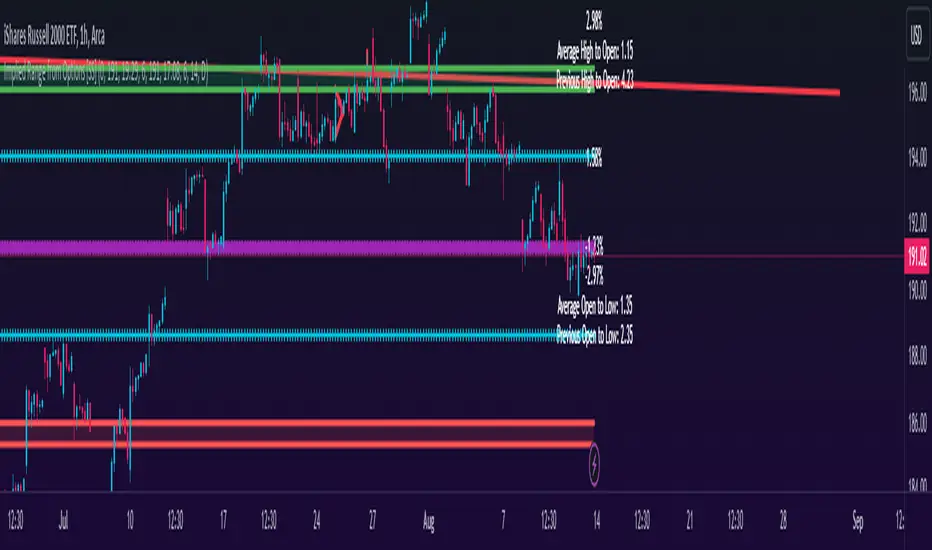
Implied Range from Options [SS]I have been promising to post this for a while, but I just needed to make sure that a) there were no similar indicators already available and b) make it a bit more user friendly.
So here it is, a basic indicator that will display the implied range from options.
In addition to displaying the implied range from options, it will provide some secondary information to help add context to the implied range. Those are shown in the chart below:
The indicator will list various precents at each point to the upside and to the downside. This is the percent move required, based on the current close price, to obtain any point in the implied move range.
In addition, the indicator will display the average move from open to high and open to low over a user defined period (default to 14 candle period) as well as the previous open to high and open to low move from the previous day.
This is to give you context of:
a) How much of a % increase or decrease is required to reach the implied ranges; and
b) How does the implied range compare to the ticker's average moves.
An increased implied range that exceeds the ticker's average move can alert you that the market is pricing in an above average move. This can be helpful and alert you to potential news releases or other fundamental things that have the potential to move the market.
How to Use the indicator:
So unfortunately, this indicator requires a bit of manual input. I was going to do an auto IV calculcation using Black-Scholes Model but just to be more rigorous in accuracy, I decided to, for now, leave it at a manual input. So when you launch the settings menu, this is what you will see:
You can collect all of this required information from your broker. Inversely, you can collect it online for free from various services such as Barchart or COBE's exchange website. The easiest way is to just pull it from your broker though.
Make sure, if you are doing weekly options to see the weekly range, you set the timeframe to 1 week. The timeframe function will calculate the average move over the desired timeframe length. So if you are doing a 0 dte for the next day, you want to see the intra-day range and will select the 1 day timeframe. It will then present to you the range averages and information on the daily timeframe for you to compare to the implied options range.
Same for the weekly, monthly, yearly, etc.
Additional options:
The indicator provides the midline average and midway points, to add static targets if you are trading the implied range.
These can be toggled on or off in the settings menu:
As well, as you can see, you can also toggle off the range labels.
There is also an offset option. This allows you to extend the range into the future:
Simply select how many candles you would like to plot the range in advance.
Closing remarks
That is the indicator. Its very simple, but it is handy. I was never one to pay attention to option pricing data, but I have been plotting it out daily and weekly these past few weeks and it does add a bit of context in terms of what the market is thinking. So I do recommend actually adding it to your repertoire of analyses going into the weeks and months, and really just paying attention to how the average ranges compare to what the market is pricing in.
One quick suggestion, select the strike price that aligns with the closing price of the ticker. This gives you a better representation of the range.
Safe trades everyone and leave your comments, questions and suggestions below!
A_Taders_Edge_LIBRARYLibrary "A_Taders_Edge_LIBRARY"
RCI(_rciLength, _close, _interval, _outerMostRangeOfOscillator)
- You will see me using this a lot. DEFINITELY my favorite oscillator to utilize for SO many different things from timing entries/exits to determining trends.
Parameters:
_rciLength (int)
_close (float)
_interval (int)
_outerMostRangeOfOscillator (int)
Returns: - Outputs a single RCI value that will between (-)_outerMostRangeOfOscillator to (+)_outerMostRangeOfOscillator
InvalidTID(_close, _showInvalidAssets, _securityTickerid, _invalidArray)
- This is to add a table on the right of your chart that prints all the TickerID's that were either not formulated correctly in the scripts input or that is not a valid symbol and should be changed.
Parameters:
_close (float)
_showInvalidAssets (simple bool)
_securityTickerid (string)
_invalidArray (string )
Returns: - Does NOT return a value but rather the table with the invalid TickerID's from the scripts input that need to be changed.
LabelLocation(_firstLocation)
- This is ONLY for when you are wanting to print ALERT LABELS with the assets name for when an alert trigger occurs for that asset. There are a total of 40 assets that can be used in each copy of the script. You don't want labels from different assets printing on top of each other because you will not be able to read the asset name that the label is for. Ex. If you put your _firstLocation in the input settings as 1 and have 40 assets on this copy of the scanner then the first asset in the list is assigned to the location value 1 on the scale, and the 2nd in the list is assigned to location value 2...and so on. If your first location is set to 81 then the 1st asset is 81 and 2nd is 82 and so on.
Parameters:
_firstLocation (simple int)
Returns: - regardless of if you have the maximum amount of assets being screened (40 max), this export function will output 40 locations… So there needs to be 40 variables assigned to the tuple in this export function. What I mean by that is there needs to be 40 variables between the ' '. If you only have 20 assets in your scripts input settings, then only the first 20 variables within the ' ' Will be assigned to a value location and the other 20 will be assigned 'NA'.
SeparateTickerids(_string)
- You must form this single tickerID input string exactly as laid out in the water (a little gray circle at the end of the setting, that you hover your cursor over to read the details of). IF the string is formed correctly then it will break up. All of the tip rate is within the string into a total of 40 separate strings which will be all of the tickerIDs that the script is using in your MO scanner.
Parameters:
_string (simple string)
Returns: - this will output, 40 different security assets within the tuple output (ie. 40 variable within the ' ') regardless of if you were including 40 assets, to be screened in the MO Screener or not. if you have less than 40 assets, then once the variables are assigned to all of the tickerIDs, the rest of the variables will be assigned "NA".
TickeridForLabelsAndSecurity(_includeExchange, _ticker)
- this export function is used to output 2 tickerID strings. One is formulated to properly work in the request.security() function while the other is how it will appear on the asset name labels depending on how you form your assets string in the MO scanners input settings. Review the tooltip next to the setting, to learn how to form the string so that the asset name labels will appear how you want in the labels at the end of the line plots & the alert labels that would be triggered if the MO Scanner is set up to include Alert Trigger Labels.
Parameters:
_includeExchange (simple bool)
_ticker (simple string)
Returns: - this export function is used to output 2 tickerID strings. One is formulated to properly work in the request.security() function while the other is how it will appear on the asset name labels depending on how you form your assets string in the MO scanners input settings. Review the tooltip next to the setting, to learn how to form the string so that the asset name labels will appear how you want in the labels at the end of the line plots & the alert labels that would be triggered if the MO Scanner is set up to include Alert Trigger Labels.
PercentChange(_startingValue, _endingValue)
- this is a quick export function to calculate how much % change has occurred between the _startingValue and the _endingValue that you input into the export function.
Parameters:
_startingValue (float)
_endingValue (float)
Returns: - it will output a single percentage value between 0-100 with trailing numbers behind a decimal. If you want, only a certain amount of numbers behind the decimal, this export function needs to be put within a formatting function to do so. Explained in the MO Scanner INTRO VIDEO.
PrintedBarCount(_time, _barCntLength, _bcPmin)
- This export function will outfit the percentage of printed bars (that occurred within _barCntLength amount of time) out of the MAX amount of bars that potentially COULD HAVE been printed. Iexplanation in the MO Scanner INTRO VIDEO.
Parameters:
_time (int)
_barCntLength (int)
_bcPmin (int)
Returns: - Gives 2 outputs. The first is the total % of Printed Bars within the user set time period and second is true/false according to if the Printed BarCount % is above the _bcPmin threshold that you input into this export function.

Trend Correlation HeatmapHello everyone!
I am excited to release my trend correlation heatmap, or trend heatmap for short.
Per usual, I think its important to explain the theory before we get into the use of the indicator, so let's get into the theory!
The theory:
So what is a correlation?
Correlation is the relationship one variable has to another. Correlations are the basis of everything I do as a quantitative trader. From the correlation between the same variables (i.e. autocorrelation), the correlation between other variables (i.e. VIX and SPY, SPY High and SPY Low, DXY and ES1! close, etc.) and, as well, the correlation between price and time (time series correlation).
This may sound very familiar to you, especially if you are a user, observer or follower of my ideas and/or indicators. Ninety-five percent of my indicators are a function of one of those three things. Whether it be a time series based indicator (i.e.my time series indicator), whether it be autocorrelation (my autoregressive cloud indicator or my autocorrelation oscillator) or whether it be regressive in nature (i.e. my SPY Volume weighted close, or even my expected move which uses averages in lieu of regressive approaches but is foundational in regression principles. Or even my VIX oscillator which relies on the premise of correlations between tickers.) So correlation is extremely important to me and while its true I am more of a regression trader than anything, I would argue that I am more of a correlation trader, because correlations are the backbone of how I develop math models of stocks.
What I am trying to stress here is the importance of correlations. They really truly are foundational to any type of quantitative analysis for stocks. And as such, understanding the current relationship a stock has to time is pivotal for any meaningful analysis to be conducted.
So what is correlation to time and what does it tell us?
Correlation to time, otherwise known and commonly referred to as "Time Series", is the relationship a ticker's price has to the passing of time. It is displayed in the traditional Pearson Correlation Coefficient or R value and can be any value from -1 (strong negative relationship, i.e. a strong downtrend) to + 1 (i.e. a strong positive relationship, i.e. a strong uptrend). The higher or lower the value the stronger the up or downtrend is.
As such, correlation to time tells us two very important things. These are:
a) The direction of the stock; and
b) The strength of the trend.
Let's take a look at an example:
Above we have a chart of QQQ. We can see a trendline that seems to fit well. The questions we ask as traders are:
1. What is the likelihood QQQ breaks down from this trendline?
2. What is the likelihood QQQ continues up?
3. What is the likelihood QQQ does a false breakdown?
There are numerous mathematical approaches we can take to answer these questions. For example, 1 and 2 can be answered by use of a Cumulative Distribution Density analysis (CDDA) or even a linear or loglinear regression analysis and 3 can be answered, more or less, with a linear regression analysis and standard error ascertainment, or even just a general comparison using a data science approach (such as cosine similarity or Manhattan distance).
But, the reality is, all 3 of these questions can be visualized, at least in some way, by simply looking at the correlation to time. Let's look at this chart again, this time with the correlation heatmap applied:
If we look at the indicator we can see some pivotal things. These are:
1. We have 4, very strong uptrends that span both higher AND lower timeframes. We have a strong uptrend of 0.96 on the 5 minute, 50 candle period. We have a strong uptrend at the 300 candle lookback period on the 1 minute, we have a strong uptrend on the 100 day lookback on the daily timeframe period and we have a strong uptrend on the 5 minute on the 500 candle lookback period.
2. By comparison, we have 3 downtrends, all of which have correlations less than the 4 uptrends. All of the downtrends have a correlation above -0.8 (which we would want lower than -0.8 to be very strong), and all of the uptrends are greater than + 0.80.
3. We can also see that the uptrends are not confined to the smaller timeframes. We have multiple uptrends on multiple timeframes and both short term (50 to 100 candles) and long term (up to 500 candles).
4. The overall trend is strengthening to the upside manifested by a positive Max Change and a Positive Min change (to be discussed later more in-depth).
With this, we can see that QQQ is actually very strong and likely will continue at least some upside. If we let this play out:
We continued up, had one test and then bounced.
Now, I want to specify, this indicator is not a panacea for all trading. And in relation to the 3 questions posed, they are best answered, at least quantitatively, not only by correlation but also by the aforementioned methods (CDDA, etc.) but correlation will help you get a feel for the strength or weakness present with a stock.
What are some tangible applications of the indicator?
For me, this indicator is used in many ways. Let me outline some ways I generally apply this indicator in my day and swing trading:
1. Gauging the strength of the stock: The indictor tells you the most prevalent behavior of the stock. Are there more downtrends than uptrends present? Are the downtrends present on the larger timeframes vs uptrends on the shorter indicating a possible bullish reversal? or vice versa? Are the trends strengthening or weakening? All of these things can be visualized with the indicator.
2. Setting parameters for other indicators: If you trade EMAs or SMAs, you may have a "one size fits all" approach. However, its actually better to adjust your EMA or SMA length to the actual trend itself. Take a look at this:
This is QQQ on the 1 hour with the 200 EMA with 200 standard deviation bands added. If we look at the heatmap, we can see, yes indeed 200 has a fairly strong uptrend correlation of 0.70. But the strongest hourly uptrend is actually at 400 candles, with a correlation of 0.91. So what happens if we change the EMA length and standard deviation to 400? This:
The exact areas are circled and colour coded. You can see, the 400 offers more of a better reference point of supports and resistances as well as a better overall trend fit. And this is why I never advocate for getting married to a specific EMA. If you are an EMA 200 lover or 21 or 51, know that these are not always the best depending on the trend and situation.
Components of the indicator:
Ah okay, now for the boring stuff. Let's go over the functionality of the indicator. I tried to keep it simple, so it is pretty straight forward. If we open the menu here are our options:
We have the ability to toggle whichever timeframes we want. We also have the ability to toggle on or off the legend that displays the colour codes and the Max and Min highest change.
Max and Min highest change: The max and min highest change simply display the change in correlation over the previous 14 candles. An increasing Max change means that the Max trend is strengthening. If we see an increasing Max change and an increasing Min change (the Min correlation is moving up), this means the stock is bullish. Why? Because the min (i.e. ideally a big negative number) is going up closer to the positives. Therefore, the downtrend is weakening.
If we see both the Max and Min declining (red), that means the uptrend is weakening and downtrend is strengthening. Here are some examples:
Final Thoughts:
And that is the indicator and the theory behind the indicator.
In a nutshell, to summarize, the indicator simply tracks the correlation of a ticker to time on multiple timeframes. This will allow you to make judgements about strength, sentiment and also help you adjust which tools and timeframes you are using to perform your analyses.
As well, to make the indicator more user friendly, I tried to make the colours distinctively different. I was going to do different shades but it was a little difficult to visualize. As such, I have included a toggle-able legend with a breakdown of the colour codes!
That's it my friends, I hope you find it useful!
Safe trades and leave your questions, comments and feedback below!

AlphaTrend - ScreenerScreener version of AlphaTrend indicator:
BUY / LONG when AlphaTrend line crosses above its 2 bars offsetted line, and there would be a green filling between them
SELL / SHORT when AlphaTrend line crosses below its 2 bars offsetted line, and filling would be red then.
Default values:
Coefficient: 1, which is the factor of the trailing ATR value
Common Period: 14, which is the length of ATR MFI and RSI
AlphaTrend default uses MFI in the calculation, and MFI (Money Flow Index) needs the volume data of the chart.
If your chart doesn't have the volume data, please select the "Change Calculation" option to use RSI instead of MFI.
Screener Panel:
You can explore 20 different and user-defined tickers, which can be changed from the SETTINGS (shares, crypto, commodities...) on this screener version.
The screener panel shows up right after the bars on the right side of the chart.
Tickers seen in green are the ones that are in an uptrend, according to AlphaTrend.
The ones that appear in red are those in the SELL signal, in a downtrend.
The numbers in front of each Ticker indicate how many bars passed after the last BUY or SELL signal of AlphaTrend.
For example, according to the indicator, when BTCUSDT appears in (3) and in GREEN, Bitcoin switched to BUY signal 3 bars ago.

Candle Combo ScreenerThe Candle Combo Screener allows you to see candlestick combinations for up to 5 different tickers at the same time . If one of the candle combination is detected the corresponding cell will be highlighted to alert you.
Candle Combinations Detected
Bullish Kicker
Bullish & Bearish Oops Reversals
Open Equals High / Low
Inside Day
Select any 5 tickers. Colors and table settings are fully customizable to fit your style.
Bullish Kicker
The opening price of the current candle gaps up above the body of the prior day's candle AND the prior day's candle close was less than the open.
Oops Reversals
Bullish: Price opens below the prior day’s low and closes above.
Bearish: Price opens above the prior day's high and closes below.
Open Equals High / Low
The current candles opening price is equal to either the high or low of the day.
Inside Day
The current candles high and low are contained within the prior day's high and low.

Three-Day Rolling PivotThe three-day rolling pivot is another pivot concept,
which may be used by intermediate positions, for several days or even weeks.
It can be utilized in many ways, such as to determine an entry point or trailing stop.
As the name suggests, this pivot is based on the last three days.
I learned this concept of the book "The logical Trader" by Mark Fisher.
Kudos go to him!
My version of the Three-Day Rolling Pivot uses actual data!
And all similar scripts I have found so far calculate future data and don't take into account the original data.
I hope this script will help some people to do some better decisions.
And I am pleased to get some advice to make this script even better!
Future data vs original data
Pine Script v5 Reference Manual:
Merge strategy for the requested data position... This merge strategy can lead to undesirable effect of getting data from "future" on calculation on history. This is unacceptable in backtesting strategies, but can be useful in indicators.
e2e4 on Stack Overflow said:
Pine v1-v2's security() function is using the lookahead parameter by default, which could be modified in v3-v5...
stackoverflow.com
I haven't found a script which put this into account jet.
I leave this option available for people that wanna more speculated data. But it's disabled by default.
Long/Short Example
You can enter Long when the market cross over the upper line (default color is green) and you should put your trailing stop 1-5 ticks below the lower line (default color is red).
The opposite when Shorting, then the market has to cross down the lower line and your trailing stop should be 1-5 ticks above the upper line.
How does this script work:
First it fetches the highest high of ...
yesterday,
the day before yesterday,
and the day before that.
After that the script looks for the highest high of all three.
Next it does the same for previous lowest low.
Last but not least, it fetches the closing price of the last day.
After that it adds all three prices together and divide them by three.
This result in a three day pivot price.
Then it adds the highest high and lowest low of the three last days and divide it by two.
This gives us the second number we need to calculate the differential.
The differential is the gap between the three day pivot price and the second number.
Sometimes the second number is bigger than the three day pivot price so I took that into account too. Other wise the colors plotted would be on the wrong site.
Finally, the script is rounding the numbers to the nearest minimum tick of that security.

Market TrendThis indicator show how is the trend of 40 stock in SET Index Thailand ordered by market capitalization.
RSI, Moving Average and MACD is used to calculate vale of each stocks.
The trend will be assigned and cumulative as 1 represent uptrend while -1 represents downtrend.
For example RSI
If RSI > RSI moving average, it will be uptrend and return 1.
If RSI < RSI moving average, it will be downtrend and return-1.
The calculation will return positive and negative of total 40 stocks (or other tickers).
If positive is greater than negative, it mean that the market is uptrend and vise versa.
Here some examples
RSI
Moving Average
MACD
You can change to other tickers.
Enjoy..

CVD - Cumulative Volume Delta (Chart)█ OVERVIEW
This indicator displays cumulative volume delta (CVD) as an on-chart oscillator. It uses intrabar analysis to obtain more precise volume delta information compared to methods that only use the chart's timeframe.
The core concepts in this script come from our first CVD indicator , which displays CVD values as plot candles in a separate indicator pane. In this script, CVD values are scaled according to price ranges and represented on the main chart pane.
█ CONCEPTS
Bar polarity
Bar polarity refers to the position of the close price relative to the open price. In other words, bar polarity is the direction of price change.
Intrabars
Intrabars are chart bars at a lower timeframe than the chart's. Each 1H chart bar of a 24x7 market will, for example, usually contain 60 bars at the lower timeframe of 1min, provided there was market activity during each minute of the hour. Mining information from intrabars can be useful in that it offers traders visibility on the activity inside a chart bar.
Lower timeframes (LTFs)
A lower timeframe is a timeframe that is smaller than the chart's timeframe. This script utilizes a LTF to analyze intrabars, or price changes within a chart bar. The lower the LTF, the more intrabars are analyzed, but the less chart bars can display information due to the limited number of intrabars that can be analyzed.
Volume delta
Volume delta is a measure that separates volume into "up" and "down" parts, then takes the difference to estimate the net demand for the asset. This approach gives traders a more detailed insight when analyzing volume and market sentiment. There are several methods for determining whether an asset's volume belongs in the "up" or "down" category. Some indicators, such as On Balance Volume and the Klinger Oscillator , use the change in price between bars to assign volume values to the appropriate category. Others, such as Chaikin Money Flow , make assumptions based on open, high, low, and close prices. The most accurate method involves using tick data to determine whether each transaction occurred at the bid or ask price and assigning the volume value to the appropriate category accordingly. However, this method requires a large amount of data on historical bars, which can limit the historical depth of charts and the number of symbols for which tick data is available.
In the context where historical tick data is not yet available on TradingView, intrabar analysis is the most precise technique to calculate volume delta on historical bars on our charts. This indicator uses intrabar analysis to achieve a compromise between simplicity and accuracy in calculating volume delta on historical bars. Our Volume Profile indicators use it as well. Other volume delta indicators in our Community Scripts , such as the Realtime 5D Profile , use real-time chart updates to achieve more precise volume delta calculations. However, these indicators aren't suitable for analyzing historical bars since they only work for real-time analysis.
This is the logic we use to assign intrabar volume to the "up" or "down" category:
• If the intrabar's open and close values are different, their relative position is used.
• If the intrabar's open and close values are the same, the difference between the intrabar's close and the previous intrabar's close is used.
• As a last resort, when there is no movement during an intrabar and it closes at the same price as the previous intrabar, the last known polarity is used.
Once all intrabars comprising a chart bar are analyzed, we calculate the net difference between "up" and "down" intrabar volume to produce the volume delta for the chart bar.
█ FEATURES
CVD resets
The "cumulative" part of the indicator's name stems from the fact that calculations accumulate during a period of time. By periodically resetting the volume delta accumulation, we can analyze the progression of volume delta across manageable chunks, which is often more useful than looking at volume delta accumulated from the beginning of a chart's history.
You can configure the reset period using the "CVD Resets" input, which offers the following selections:
• None : Calculations do not reset.
• On a fixed higher timeframe : Calculations reset on the higher timeframe you select in the "Fixed higher timeframe" field.
• At a fixed time that you specify.
• At the beginning of the regular session .
• On trend changes : Calculations reset on the direction change of either the Aroon indicator, Parabolic SAR , or Supertrend .
• On a stepped higher timeframe : Calculations reset on a higher timeframe automatically stepped using the chart's timeframe and following these rules:
Chart TF HTF
< 1min 1H
< 3H 1D
<= 12H 1W
< 1W 1M
>= 1W 1Y
Specifying intrabar precision
Ten options are included in the script to control the number of intrabars used per chart bar for calculations. The greater the number of intrabars per chart bar, the fewer chart bars can be analyzed.
The first five options allow users to specify the approximate amount of chart bars to be covered:
• Least Precise (Most chart bars) : Covers all chart bars by dividing the current timeframe by four.
This ensures the highest level of intrabar precision while achieving complete coverage for the dataset.
• Less Precise (Some chart bars) & More Precise (Less chart bars) : These options calculate a stepped LTF in relation to the current chart's timeframe.
• Very precise (2min intrabars) : Uses the second highest quantity of intrabars possible with the 2min LTF.
• Most precise (1min intrabars) : Uses the maximum quantity of intrabars possible with the 1min LTF.
The stepped lower timeframe for "Less Precise" and "More Precise" options is calculated from the current chart's timeframe as follows:
Chart Timeframe Lower Timeframe
Less Precise More Precise
< 1hr 1min 1min
< 1D 15min 1min
< 1W 2hr 30min
> 1W 1D 60min
The last five options allow users to specify an approximate fixed number of intrabars to analyze per chart bar. The available choices are 12, 24, 50, 100, and 250. The script will calculate the LTF which most closely approximates the specified number of intrabars per chart bar. Keep in mind that due to factors such as the length of a ticker's sessions and rounding of the LTF, it is not always possible to produce the exact number specified. However, the script will do its best to get as close to the value as possible.
As there is a limit to the number of intrabars that can be analyzed by a script, a tradeoff occurs between the number of intrabars analyzed per chart bar and the chart bars for which calculations are possible.
Display
This script displays raw or cumulative volume delta values on the chart as either line or histogram oscillator zones scaled according to the price chart, allowing traders to visualize volume activity on each bar or cumulatively over time. The indicator's background shows where CVD resets occur, demarcating the beginning of new zones. The vertical axis of each oscillator zone is scaled relative to the one with the highest price range, and the oscillator values are scaled relative to the highest volume delta. A vertical offset is applied to each oscillator zone so that the highest oscillator value aligns with the lowest price. This method ensures an accurate, intuitive visual comparison of volume activity within zones, as the scale is consistent across the chart, and oscillator values sit below prices. The vertical scale of oscillator zones can be adjusted using the "Zone Height" input in the script settings.
This script displays labels at the highest and lowest oscillator values in each zone, which can be enabled using the "Hi/Lo Labels" input in the "Visuals" section of the script settings. Additionally, the oscillator's value on a chart bar is displayed as a tooltip when a user hovers over the bar, which can be enabled using the "Value Tooltips" input.
Divergences occur when the polarity of volume delta does not match that of the chart bar. The script displays divergences as bar colors and background colors that can be enabled using the "Color bars on divergences" and "Color background on divergences" inputs.
An information box in the lower-left corner of the indicator displays the HTF used for resets, the LTF used for intrabars, the average quantity of intrabars per chart bar, and the number of chart bars for which there is LTF data. This is enabled using the "Show information box" input in the "Visuals" section of the script settings.
FOR Pine Script™ CODERS
• This script utilizes `ltf()` and `ltfStats()` from the lower_tf library.
The `ltf()` function determines the appropriate lower timeframe from the selected calculation mode and chart timeframe, and returns it in a format that can be used with request.security_lower_tf() .
The `ltfStats()` function, on the other hand, is used to compute and display statistical information about the lower timeframe in an information box.
• The script utilizes display.data_window and display.status_line to restrict the display of certain plots.
These new built-ins allow coders to fine-tune where a script’s plot values are displayed.
• The newly added session.isfirstbar_regular built-in allows for resetting the CVD segments at the start of the regular session.
• The VisibleChart library developed by our resident PineCoders team leverages the chart.left_visible_bar_time and chart.right_visible_bar_time variables to optimize the performance of this script.
These variables identify the opening time of the leftmost and rightmost visible bars on the chart, allowing the script to recalculate and draw objects only within the range of visible bars as the user scrolls.
This functionality also enables the scaling of the oscillator zones.
These variables are just a couple of the many new built-ins available in the chart.* namespace.
For more information, check out this blog post or look them up by typing "chart." in the Pine Script™ Reference Manual .
• Our ta library has undergone significant updates recently, including the incorporation of the `aroon()` indicator used as a method for resetting CVD segments within this script.
Revisit the library to see more of the newly added content!
Look first. Then leap.
