Backtest any Indicator v5Happy Trade,
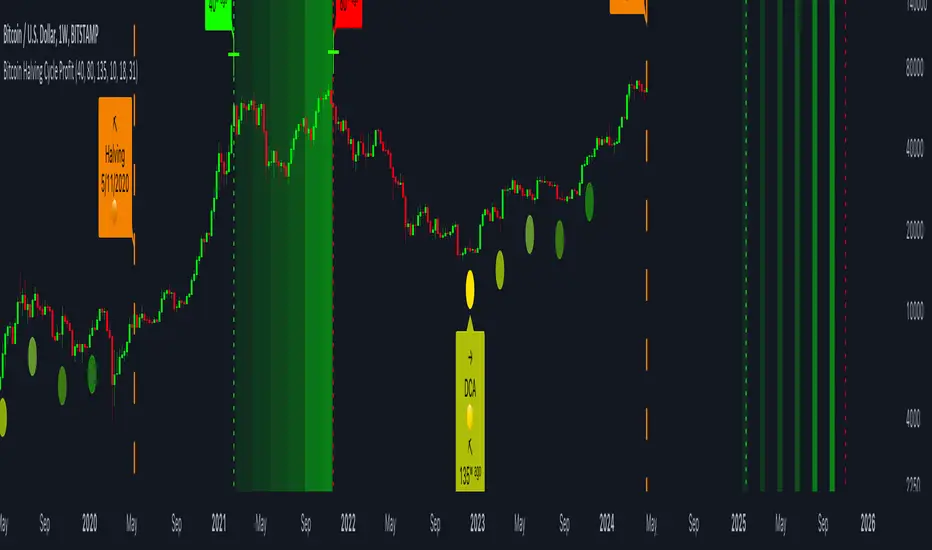
here you get the opportunity to backtest any of your indicators like a strategy without converting them into a strategy. You can choose to go long or go short and detailed time filters. Further more you can set the take profit and stop loss, initial capital, quantity per trade and set the exchange fees. You get an overall result table and even a detailed, scroll-able table with all trades. In the Image 1 you see the provided info tables about all Trades and the Result Summary. Further more every trade is marked by a background color, Labels and Levels. An opening Label with the trade direction and trade number. A closing Label again with the trade number, the trades profit in % and the total amount of $ after all past trades. A green line for the take profit level and a red line for the stop loss.
Image 1
Example
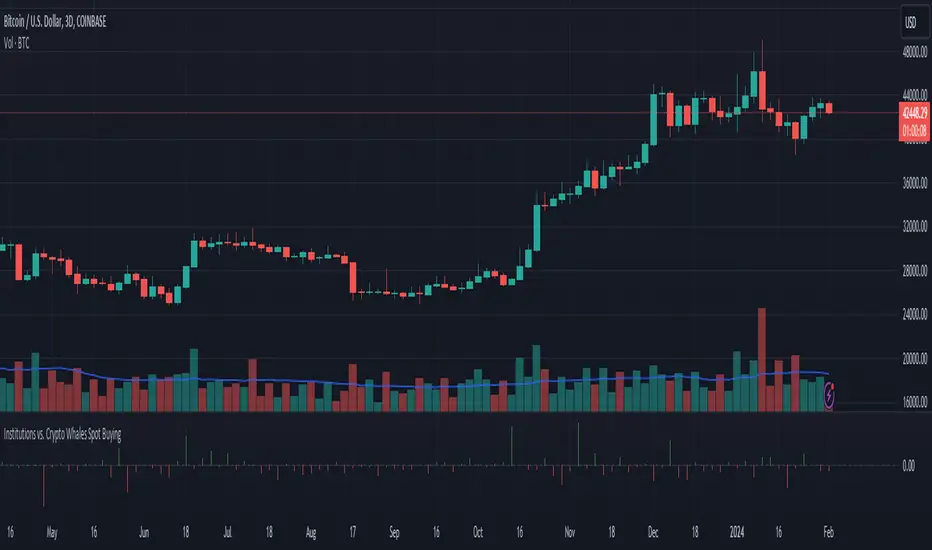
For this description we choose the Stochastic RSI indicator from TradingView as it is. In Image 2 is shown the performance of it with decent settings.
Timeframe=45, BTCUSD, 2023-08-01 - 2023-10-20
Stoch RSI: k=30, d=40, RSI-length=140, stoch-length=140
Backtest any Indicator: input signal=Stoch RSI, goLong, take profit=9.1%, stop loss=2.5%, start capital=1000$, qty=5%, fee=0.1%, no Session Filter
Image 2
Usage
1) You need to know the name of the boolean (or integer) variable of your indicator which hold the buy condition. Lets say that this boolean variable is called BUY. If this BUY variable is not plotted on the chart you simply add the following code line at the end of your pine script.
For boolean (true/false) BUY variables use this:
plot(BUY ? 1:0,'Your buy condition hold in that variable BUY',display = display.data_window)
And in case your script's BUY variable is an integer or float then use instate the following code line:
plot(BUY ,'Your buy condition hold in that variable BUY',display = display.data_window)
2) Probably the name of this BUY variable in your indicator is not BUY. Simply replace in the code line above the BUY with the name of your script's trade condition variable.
3) Save your changed Indicator script.
4) Then add this 'Backtest any Indicator' script to the chart ...
5) and go to the settings of it. Choose under "Settings -> Buy Signal" your Indicator. So in the example above choose .
The form is usually: ' : BUY'. Then you see something like Image 2
6) Decide which trade direction the BUY signal should trigger. A go Long or a go Short by set the hook or not.
Now you have a backtest of your Indicator without converting it into a strategy. You may change the setting of your Indicator to the best results and setup the following strategy settings like Time- and Session Filter, Stop Loss, Take Profit etc. More of it below in the section Settings Menu.
Appereance
In the Image 2 you see on the right side the List of Trades . To scroll down you go into the settings again and decrease the scroll value. So you can see all trades that have happened before. In case there is an open trade you will find it at the last position of the list.
Every Long trade is green back grounded while Short trades are red.
Every trade begins with a label that show goLong or goShort and its number. And ends with another label again with its number, Profit in % and the resulting total amount of cash.
If activated you further see the Take Profit as a green line and the Stop Loss as a orange line. In the settings you can set their percentage above or below the entry price.
You also see the Result Summary below. Here you find the usual stats of a strategy of all closed trades. The profit after total amount of fees , amount of trades, Profit Factor and the total amount of fees .
Settings Menu
In the settings menu you will find the following high-lighted sections. Most of the settings have a question mark on their right side. Move over it with the cursor to read specific explanation.
Input Signal of your Indicator: Under Buy you set the trade signal of your Indicator. And under Target you set the value when a trade should happen. In the Example with the Stochastic RSI above we used 20. Below you can set the trade direction, let it be go short when hooked or go long when unhooked.
Trade Settings & List of Trades: Take Profit set the target price of any trade. Stop Loss set the price to step out when a trade goes the wrong direction. Check mark the List of Trades to see any single trade with their stats. In case that there are more trades as fits in the list you can scroll down the list by decrease the value Scroll .
Time Filter: You can set a Start Time or deactivate it by leave it unhooked. The same with End Time .
Session Filter: here you can choose to activate it on weekly base. Which days of the week should be trading and those without. And also on daily base from which time on and until trade are possible. Outside of all times and sessions there will be no new trades if activated.
Invest Settings: here you can choose the amount of cash to start with. The Quantity percentage define for every trade how much of the cash should be invested and the Fee percentage which have to be payed every trade. Open position and closing position.
Other Announcements
This Backtest script don't use the strategy functions of TradingView. It is programmed as an indicator. All trades get executed at candle closing. This script use the functionality "Indicator-on-Indicator" from TradingView.
Conclusion
So now it is your turn, take your promising indicators and connect it to that Backtest script. With it you get a fast impression of how successful your indicator will trade. You don't have to relay on coders who maybe add cheating code lines. Further more you can check with the Time Filter under which market condition you indicator perform the best or not so well. Also with the Session Filter you can sort out repeating good market conditions for your indicator. Even you can check with the GoShort XOR GoLong check mark the trade signals of you indicator in opposite trade direction with one click. And compare your indicators under the same conditions and get the results just after 2 clicks. Thanks to the in-build fee setting you get an impression how much a 0.1% fee cost you in total.
Cheers
Pesquisar nos scripts por "信达股份40周年"

PresentTrend RMI Synergy - Strategy [presentTrading] █ Introduction and How it is Different
The "PresentTrend RMI Synergy Strategy" is the combined power of the Relative Momentum Index (RMI) and a custom presentTrend indicator. This strategy introduces a multifaceted approach, integrating momentum analysis with trend direction to offer traders a more nuanced and responsive trading mechanism.
BTCUSD 6h L/S Performance
Local
█ Strategy, How It Works: Detailed Explanation
The "PresentTrend RMI Synergy Strategy" intricately combines the Relative Momentum Index (RMI) and a custom SuperTrend indicator to create a powerful tool for traders.
🔶 Relative Momentum Index (RMI)
The RMI is a variation of the Relative Strength Index (RSI), but instead of using price closes against itself, it measures the momentum of up and down movements in price relative to previous prices over a given period. The RMI for a period length `N` is calculated as follows:
RMI = 100 - 100/ (1 + U/D)
where:
- `U` is the average upward price change over `N` periods,
- `D` is the average downward price change over `N` periods.
The RMI oscillates between 0 and 100, with higher values indicating stronger upward momentum and lower values suggesting stronger downward momentum.
RMI = 21
RMI = 42
For more information - RMI Trend Sync - Strategy :
🔶 presentTrend Indicator
The presentTrend indicator combines the Average True Range (ATR) with a moving average to determine trend direction and dynamic support or resistance levels. The presentTrend for a period length `M` and a multiplier `F` is defined as:
- Upper Band: MA + (ATR x F)
- Lower Band: MA - (ATR x F)
where:
- `MA` is the moving average of the close price over `M` periods,
- `ATR` is the Average True Range over the same period,
- `F` is the multiplier to adjust the sensitivity.
The trend direction switches when the price crosses the presentTrend bands, signaling potential entry or exit points.
presentTrend length = 3
presentTrend length = 10
For more information - PresentTrend - Strategy :
🔶 Strategy Logic
Entry Conditions:
- Long Entry: Triggered when the RMI exceeds a threshold, say 60, indicating a strong bullish momentum, and when the price is above the presentTrend, confirming an uptrend.
- Short Entry: Occurs when the RMI drops below a threshold, say 40, showing strong bearish momentum, and the price is below the present trend, indicating a downtrend.
Exit Conditions with Dynamic Trailing Stop:
- Long Exit: Initiated when the price crosses below the lower presentTrend band or when the RMI falls back towards a neutral level, suggesting a weakening of the bullish momentum.
- Short Exit: Executed when the price crosses above the upper presentTrend band or when the RMI rises towards a neutral level, indicating a reduction in bearish momentum.
Equations for Dynamic Trailing Stop:
- For Long Positions: The exit price is set at the lower SuperTrend band once the entry condition is met.
- For Short Positions: The exit price is determined by the upper SuperTrend band post-entry.
These dynamic trailing stops adjust as the market moves, providing a method to lock in profits while allowing room for the position to grow.
This strategy's strength lies in its dual analysis approach, leveraging RMI for momentum insights and presentTrend for trend direction and dynamic stops. This combination offers traders a robust framework to navigate various market conditions, aiming to capture trends early and exit positions strategically to maximize gains and minimize losses.
█ Trade Direction
The strategy provides flexibility in trade direction selection, offering "Long," "Short," or "Both" options to cater to different market conditions and trader preferences. This adaptability ensures that traders can align the strategy with their market outlook, risk tolerance, and trading goals.
█ Usage
To utilize the "PresentTrend RMI Synergy Strategy," traders should input their preferred settings in the Pine Script™ and apply the strategy to their charts. Monitoring RMI for momentum shifts and adjusting positions based on SuperTrend signals can optimize entry and exit points, enhancing potential returns while managing risk.
█ Default Settings
1. RMI Length: 21
The 21-period RMI length strikes a balance between capturing momentum and filtering out market noise, offering a medium-term outlook on market trends.
2. Super Trend Length: 7
A SuperTrend length of 7 periods is chosen for its responsiveness to price movements, providing a dynamic framework for trend identification without excessive sensitivity.
3. Super Trend Multiplier: 4.0
The multiplier of 4.0 for the SuperTrend indicator widens the trend bands, focusing on significant market moves and reducing the impact of minor fluctuations.
---
The "PresentTrend RMI Synergy Strategy" represents a significant step forward in trading strategy development, blending momentum and trend analysis in a unique way. By providing a detailed framework for understanding market dynamics, this strategy empowers traders to make more informed decisions.

Monte Carlo Future Moves [ChartPrime]ORIGINS AND HISTORICAL BACKGROUND:
Prior to the the advent of the Monte Carlo method, examining well-understood deterministic problems via simulation generally utilized statistical sampling to gauge uncertainty estimations. The Monte Carlo (MC) approach inverts this paradigm by modeling with probabilistic metaheuristics to address deterministic problems. Addressing Buffon's needle problem, an early form of the Monte Carlo method estimated π (3.14159) by dropping needles on a floor. Later, the modern MC inception primarily began when Stanislaw Ulam was playing solitaire games while experiencing illness and recovery.
Ulam further developed, applied, and ascribed "Monte Carlo" as a classified code name to maintain a level of secrecy for the modern method applications during collaborative investigations on neutron diffusion and collision intricacies with John von Neumann. Despite having relevant data, physicist's conventional deterministic mathematical methods were unable to solve mysterious "neutronion problems". Monte Carlo filled in the gaps necessary to resolve this perplexing neutron problem with innovative statistics, and the resilient MC continues onward to have diverse application in many fields of science. MC also extends into the realm of relevance within finance.
APPLICATION IN FINANCE:
Building on its historical roots, the Monte Carlo method's transition into finance opened new avenues for risk assessment and predictive analysis. In financial markets, characterized by uncertainty and complex variables, this method offers a powerful tool for simulating a wide range of scenarios and assessing probabilities of different outcomes. By employing probabilistic models to predict price movements, the Monte Carlo method helps in creating more resilient and informed trading strategies. This approach is particularly valuable in options pricing, portfolio management, and risk assessment, where understanding the range of potential outcomes is crucial for making sound investment decisions. Our indicator utilizes this methodology, blending traditional financial analysis with advanced statistical techniques.
THE INDICATOR:
The Monte Carlo Future Moves (ChartPrime) indicator is designed to predict future price movements. It simulates various possible price paths, showing the likelihood of different outcomes. We have designed it to be simple to use and understand by displaying lines indicating the most likely bullish and bearish outcomes. The arrows point to these areas making it intuitive to understand. Also included is extreme price levels shown in blue and yellow. This is the most likely extreme range that the price will move to. The outcome distribution is there to show you the range of outcomes along with a visual representation of the possible future outcomes. To make things more user friendly we have also included a representation of this distribution as a background heatmap. The brighter the price level, the more likely the price will end at that level. Finally, we have also included a market bias indication on the side that shows you the general bullish/bearish probabilities.
HOW TO USE:
To use this indicator you want to first assess the market bias. From there you want to target the most likely polar outcome. You can use the range of outcomes to assess your risk and set a stop within a reasonable range of the desired target. By default the indicator projects 10 steps into the future, however this can be easily adjusted in the settings. Generally this indicator excels at mid-term estimations and may yield inconclusive results if the prediction period is too short or too long. You can change the granularity of the outcomes to give you a more or less detailed view of the future. That being said, a lower resolution can make the predictions less useful while a higher resolution can give you a less useful picture. If you decide to use a higher resolution we have included an option to smooth the final result. This is intended to reduce the uncertainty and noise in the predicted outcomes. It is advised to use the minimum level of smoothing possible as a high level of smoothing will greatly reduce the accuracy.
INPUT SECTION:
Derivative Source changes how the indicator sees the price movements. When you set this to Candle it will use the difference between the open and close of each candle. If set to Move, it will use the difference between closing prices. If you are in a market with gaps, you might want to use Candle as this will prevent the indicator from seeing gaps.
Number of Simulations is a crucial setting as it is the core of this indicator. This determines the number of simulations the indicator will use to get its final result. By default it is set to 1000 as we feel like that is around the minimum number of simulations required to get a reasonable output while maintaining stability. In tests the maximum number of simulations we have been able to consistently achieve is 2000.
Lookback is the number of historical candles to account for. A lookback that is too short will not have enough data to accurately assess the likelihood of a price movement, while a period that is too large can make the data less relevant. By default this is set to 1000 as we feel like this is a reasonable tradeoff between volume of data and relevance.
Steps Into Future is the prediction period. By default we have picked a period of 10 steps as this has a good balance between accuracy and usability. The more steps into the future you go, the more uncertain the future outcome will be.
Outcome Granularity controls the precision of the simulated outcomes. By default this is set to 40 as its a good balance between resolution and accuracy.
Outcome Smoothing allows you to smooth the outcome distribution. By default this is set to 0 as it is generally not needed for lower resolutions. Smoothing levels beyond 2 are not recommended as it will negatively impact the output.
Returns Granularity controls the level of definition in the collected price movements. This directly impacts indicator performance and is set to 50 by default because its a good balance between fidelity and usability. When this number is too small, the simulations will be less accurate while numbers too large will negatively impact the probabilities of the movements.
Drift is the trend component in the simulation. This adds the directionality of the simulations by biasing the movements in the current direction of the market. We have included both the standard formula for drift and linear regression. Both methods are well suited for simulating future price movements and have their own advantages. The drift period is set to 100 by default as its a good balance between current and historical directionality. You may want to increase or decrease this number depending on the current market conditions but it is advised to use a period that isn't too small. If your period is too small it can skew the outcomes too much resulting in poor performance. When this is set to 0 it will use the same period as your lookback.
Volatility Adjust , adjusts the simulation to include current volatility. This makes sure that the price movements in the simulation reflects the current market conditions better by making sure that each price move is at least a minimum size.
Returns Style allows you to pick between using percent moves and log returns. We have opted to make percent move the default as it is more intuitive for beginners however both settings yield similar results. Log returns can be less cpu intensive so it might be desirable for longer term predictions.
Precision adjusts the rounding of used when collecting the frequency of price movement sizes. By default this is set to 4 as its is fairly accurate without impacting performance too much. A larger number will make the indicator more precise but at the cost of cpu time. Precision levels that are too small can greatly reduce the accuracy of the simulation and even break the indicator all together.
Update Every Bar allows you to recalculate the prediction every bar and is there for you if you want to strictly use the market bias. It is not recommended to enable this feature but it is there for flexibility.
Side of Chart allows you to pick what side of the price action you want the visuals to be on. When its set to the right everything will be to the right of the starting point and when its set to Left it will position everything to the left of the starting point.
Move Visualization is there to give you an arrow to the most likely bullish and bearish moves. It is meant as a visual aid and visualization tool. The color of these arrows use the same colors as the distribution.
Most Likely Move is a horizontal line that indicates the most likely move. It is positioned in the same location as the Move Visualization.
Standard Deviation is horizontal lines at the extremities of the simulated price action. These represent the most likely range of the future outcomes. You can adjust the multiplier of the standard deviation but by default it is set to 2.
Most Likely Direction is a vertical bar that shows you the sum of the up and down probabilities. It is there to show you the bias of the outcomes and guide you in decision making.
Max Probability Zone is a horizontal line that highlights the location of the highest probability move. You can think of it almost like the POC in a volume distribution but in this case it is the "most likely" single outcome.
Outcome Distribution allows you to toggle the distribution on or off. This is the distribution of all of the simulated outcomes. You can toggle the scale width of the distribution to fit your visual style.
Distribution Text toggles the probability text inside of the distribution bars. When you have a large number for the outcome granularity this text may not be visible and you may want to disable this feature.
Background is a heatmap of the outcome distribution. This allows you to visualize the underlying distribution without the need for the distribution histogram. The brighter the color, the more likely the outcome is for that level. It can be useful for visualizing the range of possible outcomes.
Starting Line is simply a horizontal line indicating the starting point of the simulation. It just the opening price for the starting position.
Extend Lines allows you to extend the lines and background past the prediction period.
CONCLUSION:
With its intuitive visuals and flexible settings, the Monte Carlo Future Moves (ChartPrime) indicator is practice and easy to use. It brings clarity to price movement predictions, helping you to build confidence in your strategies. This indicator not only reflects the evolution of technical analysis but also touches on data-driven insights.
Enjoy

Institutions vs. Crypto Whales Spot BuyingBased on analysis from @tedtalksmacro, I have put together a similar tool that helps to visualise whether institutions (Coinbase and Deribit) or native crypto whales (Binance and Bitfinex) are leading the BTC spot buying.
This is plotted as the normalised relative difference (-1 and 1) between the average of Coinbase and Deribit spot price versus Binance and Bitfinex. If positive (i.e. green bar), institutions are trading at a premium; if negative (i.e. red bar), crypto whales are trading at a premium.
For example, if crypto whales are trading at a premium and price is increasing, then they are leading the buying relative to institutions. However, if whales are trading at a premium and price is decreasing, then it is likely institutions are selling off at a more rapid rate relative to the crypto whales buying pressure. This applies to the alternate scenario where institutions are trading at a premium to crypto whales.
In recent times, native crypto whales (largely Binance) drove the push from 40 to 48k, but then also marked the local top with a major sell off at this price. Institutions then took over buying at the most recent lows, driven largely by GBTC outflows slowing down and Blackrock daily inflows exceeding Grayscale outflows for the first time late last week.
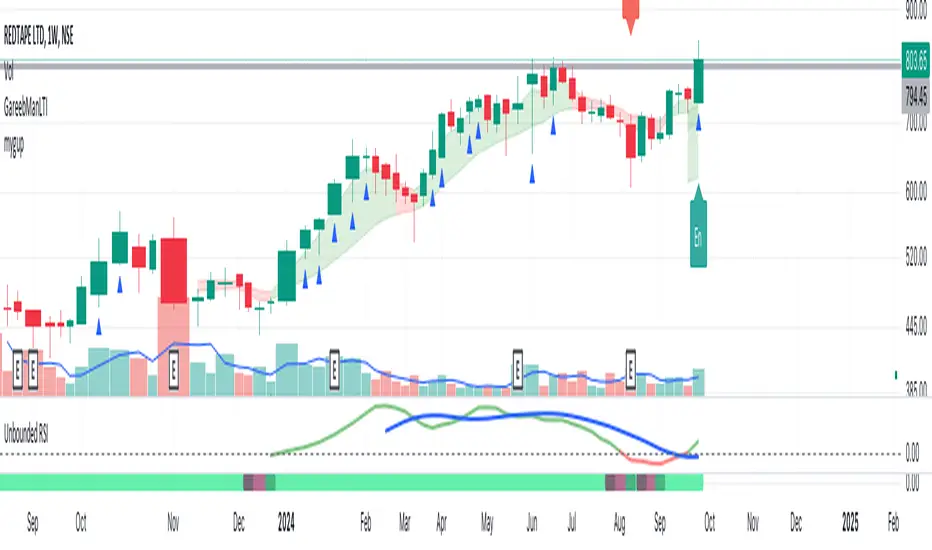
Unbounded RSIIntroducing the concept of "Unbounded RSI".
Instead of indexing the average gain and average loss, over the time period of interest, we leave the average gain and loss unbounded. Instead we "bound" them by difference of each and smoothen out this difference in an envelope using exponential average. See code.
What this does to traditional RSI concept?
No concept of "overbought", "oversold"
No concept of "60-40", "70-30" bands and arguments over it
No concept of "Range Shifts"
...
How to use it?
I am generally a positional long trader. So I present my version. Of course, I expect each individual who decide to use this concept, to come up with their ideas, based on their style and temperament.
The points below, I apply on a Weekly Timeframe Chart.
Once, we see a long consolidation and price breakout, we should be able to see "Green" histogram bars. These appear, once we have the stock at least 20% up from the 52WL and the "Unbounded RSI" has turned positive. This can be a good time to "enter" into the scrip.
The height of the bars are significant, since they essentially show, that the "gap" between the avg. gain and avg. loss is widening, indicating momentum. Swing trading can thrive in these environments I guess.
Falling heights indicate that gaps to close, though, the "gap can still be green". This means, momentum is now falling. Swing traders and "quick buck makers", would ideally book profits here. If the color of the bars still remain "Green" it indicates that momentum has reduced but still the gains are "more" than loss on the timeperiod selected.
Once the histogram turns red, it means that the gain is now lower than loss. An increasing height underground, means this loss is widening. Generally, this will corelate with price action (not necessarily volume).
At this time, exits should be looked for, may be also check other factors/indicators to decide, but surely the momentum and the gain% over the timeperiod selected has now gone.
Note for Pine Coders:
The source code can easily be modified to develop this concept further.
For example:
Use different smoothing algorithms
Remove 52WL condition and introduce new additional conditions
Instead of price change of the stock for gain/loss calculations, we use the concept of Relative Strength (RS, not RSI) and measuere the gain/loss based on a benchmark index . I intend to work on this concept, soon.
You shall see a variable "unboundedRSI" which is actually a ratio of the Avg. Gain / Avg. Loss. This ratio is not plotted. It is kept there, for future use.
Many more
Rocket RSI from John EhlersWhat is Rocket RSI
Welles Wilder's original description of the relative strength index (RSI) in his 1978 New Concepts In Technical Trading Systems specified a calculation period of 14 days. This requirement led him on a 40-year quest to find the right length of data for calculating indicators and trading strategy rules. Many technicians touched on RSI and explained its applications. In this study we will obtain a more flexible and easier to interpret formulation (of the indicator). We will also estimate the algorithm to properly handle a statistical approach to technical analysis. Start with RSI Here is the original definition of the RSI indicator:
RSI = 100 - 100 / (1 + RS)
RS = Average gain from downtime over the specified time period / Average loss from downtime over the specified time period My first observation is that the factor of 100 is insignificant. Second, there is no need for averages because we take the ratio of closes (CU) to closes (CD) and if we accumulate the wins and losses independently, the averages emerge. Therefore We will only accumulate CU and CD. He can then write the RSI equation as:
RSI = 1 – 1 / (1 + CU / CD)
If he use a little algebra to put everything on a common denominator on the right side of the equation, the indicator equation becomes:
RSI = CU / (CU + CD)
In this formulation, if CU accumulation is zero, the RSI value is zero, and if CD accumulation is zero, the RSI value is 1. If you reduce the price action to its primitive level as a sine wave, it is easy to see that this RSI only has CU going from valley to peak and only CD going from peak to valley. This RSI follows the shape of the sine wave between these two limits. However, the sine wave oscillates between -1 and +1, not between 0 and +1. If we multiply the above equation by 2 and then subtract 1, we can make the RSI have the same swing limits as the sine wave. the product is as follows:
RSI = 2*CU / (CU + CD) – 1
Again, using a little algebra to put the right-hand side of the equation on a common denominator, the equation develops like this:
MyRSI = (CU – CD) / (CU + CD)
Again, the vertical scale of the RocketRSI indicator is in standard deviations. For example, -2 means it is two standard deviations below the mean. Since exceeding two standard deviations in the Gaussian probability distribution occurs in only 2.4% of the results
Because we are using the momentum of the dominant cycle period, the spike where the indicator falls below -2 provides a surgically precise timing signal to enter a long position. Similarly, exceeding the +2 standard deviation level is a timing signal to exit a long position or return to a short position. Therefore using the RocketRSI indicator is relatively intuitive. The only concern is whether a dominant cycle is present in the data, setting the indicator to half the dominant cycle period, and whether smoothing causes lag.
DETERMINING CYCLICAL TURNING POINTS
When you insert the chart you see an example of what the RocketRSI indicator looks like. Here you see that RocketRSI precisely displays cyclical turning points as statistical events. Cator can be applied. I used RS Length 10 because according to Ehlers, stocks and stock indexes usually have a more or less monthly cycle (about 20 bars). A cursory examination of Figure 2 shows that negative increases in the indicator correspond to excellent buying opportunities, while positive increases correspond to excellent selling opportunities. Exceeding +/- 2 on the indicator scale indicates that a cyclical reversal is a high probability event.

Entry Buy/Sell with Adjustable EMA-WMA Difference by Brian LeThe "Entry Buy/Sell with RSI-WMA Conditions" script, crafted by Brian Le, is a specialized TradingView indicator designed for traders who seek to capitalize on specific RSI (Relative Strength Index) crossover events relative to key moving averages, specifically the EMA (Exponential Moving Average) and WMA (Weighted Moving Average). This tool is particularly useful for identifying potential entry points in a trading strategy, marked by distinctive visual signals on the chart.
Key Features:
Customizable Timeframes and Lengths: Users can adjust the lengths of the RSI, EMA, and WMA, making the indicator versatile across various timeframes and trading styles.
RSI Crossover Signals: The script generates signals based on the RSI crossing over the EMA. A green dot signifies a potential buy signal when the RSI crosses above the EMA, while a red dot indicates a potential sell signal when the RSI crosses below the EMA.
Special Conditions Based on WMA: The indicator enhances decision-making by including the WMA in its analysis. Buy signals (green dots) are only shown when the RSI is below the WMA, and sell signals (red dots) are displayed when the RSI is above the WMA. This additional condition helps in filtering out less probable trades.
EMA and WMA Difference Filter: A unique feature of this script is the ability to set a minimum point difference between the EMA and WMA, adding another layer of specificity to the generated signals.
RSI Threshold Filters: The indicator includes optional filters to show signals only when the RSI is above 40 (for buy signals) or below 60 (for sell signals), aiding in avoiding overbought or oversold conditions.
Enhanced Visuals for Significant Events: For more prominent trading events, such as the RSI crossing both the EMA and WMA within a single candle, the script plots larger symbols (triangles), making these significant events stand out on the chart.
Live Economic Calendar by toodegrees⚠️ PLEASE READ ⚠️
Although this indicator is accurate in showcasing live and upcoming News Events, checking the original sources is always suggested. This indicator aims to save Time, but due to limitations it may not be 100% correct 100% of the Time.
Description:
The Live Economic Calendar indicator seamlessly integrates with external news sources to provide real-Time, upcoming, and past financial news directly on your Tradingview chart.
By having a clear understanding of when news are planned to be released, as well as their respective impact, analysts can prepare their weeks and days in advance. These injections of volatility can be harnessed by analysts to support their thesis, or may want to be avoided to ensure higher probability market conditions. Fundamentals and news releases transcend the boundaries of technical analysis, as their effects are difficult to predict or estimate.
Designed for both novice and experienced traders, the Live Economic Calendar indicator enhances your analysis by keeping you informed of the latest and upcoming market-moving news.
This is achieved with three different visual components:
News Table: A dedicated News Table shows the Day of the Week, Date, Time of the Day, Currency, Expected Impact, and News Name for each event (in chronological order). Once a news event has occurred, or the day is over, it will be greyed out – helping to focus on the next upcoming news events.
News Lines: Vertical lines plotted in the future help analysts monitor upcoming news events; vertical lines in the past help analysts spot and backtest previous news events that already occurred.
News Labels: Color-coded news labels will plot once the news events have occurred. This not only gives analysts a minimalistic visual cue, but also retains the information of which news were released at that Time in their tooltips.
Forex Factory Calendar News Feed:
The Forex Factory Data Feed includes news events from January 2007 to the present. The data is updated daily. Please see the Technical Description below for more information.
Forex Factory provides news for all major currencies and markets:
Australia (AUD)
Canada (CAD)
Switzerland (CHF)
China (CNY)
European Union (EUR)
United Kingdom (GBP)
Japan (JPY)
New Zealand (NZD)
United States of America (USD)
Further, there are four types of news impact, defined by respective color-coding which is retained to avoid confusion:
⚪ Holiday
🟡 Low Impact
🟠 Medium Impact
🔴 High Impact
News' Time of the day data is in 24H format, and 'All Day' news are marked at Daily candle open.
⚠️ Original Release Notes ⚠️
The original release of this indicator supports the Forex Factory News Calendar in EST (New York Time). Future updates will include multiple news sources, as well as supporting different Timezones.
Given Data limitations, the Daily chart can omit some data due to the market being close on some days. This will be fixed in the future once an efficient solution is implemented.
Key Features:
Impact-Based News Filtering: Filter news items based on their expected impact (holiday, low, medium, high) to focus on the most market-critical information.
Symbol-Specific News: Automatically filter news to display only what's relevant to the currency pair or trading symbol you are analyzing.
Custom Currency News: Want to see more than the news relevant to the current symbol? Toggle which markets' news you are most interested in.
Chart History: Keep your charts clean by displaying only the drawings of Today's news, or This Week's news.
Custom Lookback: Look further back in Time by choosing a custom number of Lookback Days, allowing you to backtest and keep in mind salient news events from the past.
Line and Label Customization: Both the News Lines and Labels are highly customizable (except the colors), allowing you to make the indicator yours.
Table History: Choose whether to focus on Today's news only, or the news for This Week.
Table Customization: The table colors and position are highly customizable, allowing you to make it fit your visual preference and your layouts' aesthetic.
"Wondering how it's done? 👇"
Technical Description:
This script utilizes Pine Seeds , a service integrated with TradingView for importing custom data. This stunning feature enables users to upload and access custom End Of Day (EOD) data, which can be updated as frequently as five times daily.
This data can be imported in one of two formats:
Single Value: integer or float
Candle Data: open, high, low, close, volume
Upon encountering Pine Seeds, I recognized its potential for importing financial news events. Given that Forex Factory is a primary source of financial news in my personal analysis, integrating it into my layouts seemed like an exciting opportunity. This integration is expected to provide significant value to users looking to integrate additional news feeds all in one place.
Development Challenges:
Format Limitations: News events must be converted into numerical values for import, due to the required Pine Seeds format.
Amount of Data: With all currencies considered, the system may encounter over 40 news events in a single day.
Data Availability: The reliance on End Of Day (EOD) data means that information for the current day is displayed with a delay, and accessing future data is not possible.
Solutions:
Encoding: Each news event is encoded as an integer in the "DCHHMMITYP" format.
D = day of the week
C = currency
HHMM = Time of day
I = news impact
TYP = event ID (see Event Library A and Event Library B )
To ensure data assignment for each candle across the open, high, low, close, and volume series, the value "999" is used as a placeholder:
Importing: Utilizing the encoding system, up to five news events per day can be imported for a singular Pine Seeds custom symbol.
By creating multiple custom Pine Seeds Symbols, efficient imports of a larger number of events is then easily achievable. Nine unique symbols have been established, accommodating up to 45 news events per day.
These symbols are searchable, and accessible as " TOODEGREES_FOREX_FACTORY_SLOT_N " where N ranges from 1 to 9.
The Pine Seeds data feed appears as follows:
Uploading Schedule: To ensure analysts are informed about current and upcoming week's news, events are uploaded one week in advance.
This approach is vital for preparing for potential market impacts across various asset classes and currencies, allowing visibility of an entire week's news ahead of Time.
Data Scraping:
Unfortunately Forex Factory doesn't offer an API to fetch their news feed.
Hence an ad hoc python scraper was developed to read and save news events from January 2007 till the present leveraging Selenium. The scraper algorithm is part of a larger script responsible for scraping data, formatting data, and creating all necessary datasets.
The pseudo-code for the python script is as follows:
Read and save news event data on Forex Factory
Format day of the week, currency, Time of the day, and impact data for the Encoding
Encode and save News Event IDs – Event ID dataset is created
Format news data for Pine Seeds (roll-back date by one week, assign news to open, high, low, close, and volume values)
Create Pine Seeds Datasets
This script is ran everyday at Futures market close (16:00 EST) to update the last part of the each dataset, ensuring accuracy, and taking into account last-minute news additions or revisions.
Once the data (next week's news) is imported by the Live Economic Calendar indicator, it's immediately decoded by leveraging the Forex Factory Decoding Library , and saved into an array.
Upon a new week open, the decoded data is used to plot news events on the chart and in the news table.
See the inner workings of these processes in the Forex Factory Utility Library .
Although these libraries are specifically built for this indicator, feel free to use them to create your own scripts. Looking forward to see what the Pine Script community comes up with!
Thank you for making it this far. Enjoy!
Ciao,
toodegrees
This tool is available ONLY on the TradingView platform.
Terms and Conditions
Our charting tools are provided for informational and educational purposes only and do not constitute financial, investment, or trading advice. Our charting tools are not designed to predict market movements or provide specific recommendations. Users should be aware that past performance is not indicative of future results and should not be relied upon for making financial decisions. By using our charting tools, the user agrees that Toodegrees and the Toodegrees Team are not responsible for any decisions made based on the information provided by these charting tools. The user assumes full responsibility and liability for any actions taken and the consequences thereof, including any loss of money or investments that may occur as a result of using these products. Hence, by using these charting tools, the user accepts and acknowledges that Toodegrees and the Toodegrees Team are not liable nor responsible for any unwanted outcome that arises from the development, or the use of these charting tools. Finally, the user indemnifies Toodegrees and the Toodegrees Team from any and all liability.
By continuing to use these charting tools, the user acknowledges and agrees to the Terms and Conditions outlined in this legal disclaimer.

Altcoin ManagerThe Altcoin Manager is a comprehensive script for identifying the current altcoin narrative by tracking and analyzing of a wide array of altcoins across various blockchain layers and categories, such as DeFi, GameFi, AI, and Meme coins. Ideal for traders looking to get a broad yet detailed view of the altcoin market, covering various sectors and chains.
The Key Features:
Versatile Asset Tracking:
Tracks 40 different cryptocurrencies (as of publishing) across different categories, allowing for a diversified and detailed analysis of the altcoin market.
Customizable Assets and Category Analysis:
Select 20 of your own coins across 4 different categories such as DeFi, GameFi, AI, and Meme coins as well as specifying their individual chains.
Dynamic Layer and Chain Analysis:
Includes options to plot and analyze specific blockchain layers and chains such as Ethereum Chain, Solana Chain, BNB Smart Chain, Arbitrum Chain, and Polygon Chain. The script associates various assets with specific blockchains, providing a clearer picture of how different segments of the altcoin market are performing.
Cumulative and Per-Candle Change:
Switch between viewing the total cumulative change since a set start date or the per-candle change, offering flexibility in analyzing price movements over different timeframes.
Denomination Adjustment:
Includes a functionality to denominate asset prices in other currencies or crypto such as BTC, allowing for a more tailored financial analysis according to your preference.
Moving Averages for Categories and Chains:
Calculates and plots moving averages for each category and chain, aiding in the identification of trends over the selected moving average length.
How do I use it?
This script is not used with any particular chart. Instead, assign it it's own tab and layout.
For a clearer analysis, use multiple different panels to track Categories and Chains separately, both Cumulative for a longer term analysis and Per-Candle to find ongoing breakouts and changes in trend.
You can either use the pre-selected altcoins to represent the market, or you can select your own.
The Layer 1 and Layer 2 are not customizable but consists of 15 popular Layer 1 incl Bitcoin, Ethereum, Solana etc. Layer 2 consists of 5 popular Layer 2.

Megabar Breakout (Range & Volume & RSI)Hey there,
This strategy is based on the idea that certain events lead to what are called Megabars. Megabars are bars that have a very large range and volume. I wanted to verify whether these bars indicate the start of a trend and whether one should follow the trend.
Summary of the Code:
The code is based on three indicators: the range of the bar, the volume of the bar, and the RSI. When certain values of these indicators are met, a Megabar is identified. The direction of the Megabar indicates the direction in which we should trade.
Why do I combine these indicators?
I want to identify special bars that have the potential to mark the beginning of a breakout. Therefore, a bar needs to exhibit high volume, have a large range (huge price movement), and we also use the Relative Strength Index (RSI) to assess potential momentum. Only if all three criteria are met within one candle, do we use this as an identifier for a megabar.
Explanation of Drawings on the Chart:
As you can see, there is a green background on my chart. The green background symbolizes the time when I'm entering a trade. Only if a Megabar happens during that time, I'm ready to enter a trade. The time is between 6 AM and 4 PM CET. It's just because I prefer that time. Also, the strategy draws an error every time a Megabar happens based on VOL and Range only (not on the RSI). That makes it pretty easy to go through your chart and check the biggest bars manually. You can activate or deactivate these settings via the input data of the strategy.
When Do We Enter a Trade?
We wait for a Megabar to happen during our trading session. If the Megabar is bullish, we open a LONG trade at the opening price of the next candle. If the Megabar is bearish, we open a SHORT trade at the opening price of the next candle.
Where Do We Put Our Take Profit & Stop Loss?
The default setting is TP = 40 Pips and SL = 30 Pips. In that case, we are always trading with a risk-reward ratio of 1.33 by default. You can easily change these settings via the input data of the strategy.
Strategy Results
The criteria for Megabars were chosen by me in a way that makes Megabars something special. They are not intended to occur too frequently, as the fundamental idea of this strategy would otherwise not hold. This results in only 37 closed trades within the last 12 months. If you change the criterias for a megabar to a milder one, you will create more Megabars and therefore more trades. It's up to you. I have adapted this strategy to the 30-minute chart of the EURUSD. In the evaluation, we consider a period of 12 months, which I believe is sufficient.
My default settings for the indicators look like this:
Avg Length Vol 20
Avg Multiplier Vol 3
Avg Length Range 20
Avg Multiplier Range 4
Value SMA RSI for Long Trades 50
Value SMA RSI for Short Trades 70
IMPORTANT: The current performance overview does not display the results of these settings. Please change the settings to my default ones so that you can see how I use this strategy.
I do not recommend trading this strategy without further testing. The script is meant to reflect a basic idea and be used as a tool to identify Megabars. I have made this strategy completely public so that it can be further developed. One can take this framework and test it on different timeframes and different markets.

Stock WatchOverview
Watch list are very common in trading, but most of them simply provide the means of tracking a list of symbols and their current price. Then, you click through the list and perform some additional analysis individually from a chart setup. What this indicator is designed to do is provide a watch list that employs a high/low price range analysis in a table view across multiple time ranges for a much faster analysis of the symbols you are watching.
Discussion
The concept of this Stock Watch indicator is best understood when you think in terms of a 52 Week Range indication on many financial web sites. Taken a given symbol, what is the high and the low over a 52 week range and then determine where current price is within that range from a percentage perspective between 0% and 100%.
With this concept in mind, let's see how this Stock Watch indicator is meant to benefit.
There are four different H/L ranges relative to the chart's setting and a Scope property. Let's use a three month (3M) chart as our example and set the indicator's Scope = 4. A 3M chart provides three months of data in a single candle, now when we set the Scope = 4 we are stating that 1X is going to look over four candles for the high/low range.
The Scope property is used to determine how many candles it is to scan to determine the high/low range for the corresponding 1X, 3X, 5X and 10X periods. This is how different time ranges are put into perspective. Using a 3M chart with Scope = 4 would represent the following time windows:
- 1X = 3M * 4 is a 12 Months or 1 Year High/Low Range
- 3X = 3M * 4 * 3 is a 36 Months or 3 Years High/Low Range
- 5X = 3M * 4 * 5 is a 60 Months or 5 Years High/Low Range
- 10X = 3M * 4 * 10 is a 120 Months or 10 Years High/Low Range.
With these calculations, the indicator then determines where current price is within each of these High/Low ranges from a percentage perspective between 0% and 100%.
Once the 0% to 100% value is calculated, it then will shade the value according to a color gradient from red to green (or any other two colors you set the indictor to). This color shading really helps to interpret current price quickly.
The greater power to this range and color shading comes when you are able to see where price is according to price history across the multiple time windows. In this example, there is quick analysis across 1 Year, 3 Year, 5 Year and 10 Year windows.
Now let's further improve this quick analysis over 15 different stocks for which the indicator allows you to watch up to at any one time.
For value traders this is huge, because we're always looking for the bargains and we wait for price to be in the value range. Using this indicator helps to instantly see if price has entered a value range before we decide to do further analysis with other charting and fundamental tools.
The Code
The heart of all this is really very simple as you can see in the following code snippet. We're simply looking for the highest high and lowest low across the different scopes and calculating the percentage of the range where current price is for each symbol being watched.
scope = baseScope
watch1X = math.round(((watchClose - ta.lowest(watchLow, scope)) / (ta.highest(watchHigh, scope) - ta.lowest(watchLow, scope))) * 100, 0)
table.cell(tblWatch, columnId, 2, str.format("{0, number, #}%", watch1X), text_size = size.small, text_color = colorText, bgcolor = getBackColor(watch1X))
//3X Lookback
scope := baseScope * 3
watch3X = math.round(((watchClose - ta.lowest(watchLow, scope)) / (ta.highest(watchHigh, scope) - ta.lowest(watchLow, scope))) * 100, 0)
table.cell(tblWatch, columnId, 3, str.format("{0, number, #}%", watch3X), text_size = size.small, text_color = colorText, bgcolor = getBackColor(watch3X))
Conclusion
The example I've laid out here are for large time windows, because I'm a long term investor. However, keep in mind that this can work on any chart setting, you just need to remember that your chart's time period and scope work together to determine what 1X, 3X, 5X and 10X represent.
Let me try and give you one last scenario on this. Consider your chart is set for a 60 minute chart, meaning each candle represents 60 minutes of time and you set the Stock Watch indicator to a scope = 4. These settings would now represent the following and you would be watching up to 15 different stocks across these windows at one time.
1X = 60 minutes * 4 is 240 minutes or 4 hours of time.
3X = 60 minutes * 4 * 3 = 720 minutes or 12 hours of time.
5X = 60 minutes * 4 * 5 = 1200 minutes or 20 hours of time.
10X = 60 minutes * 4 * 10 = 2400 minutes or 40 hours of time.
I hope you find value in my contribution to the cause of trading, and if you have any comments or critiques, I would love to here from you in the comments.

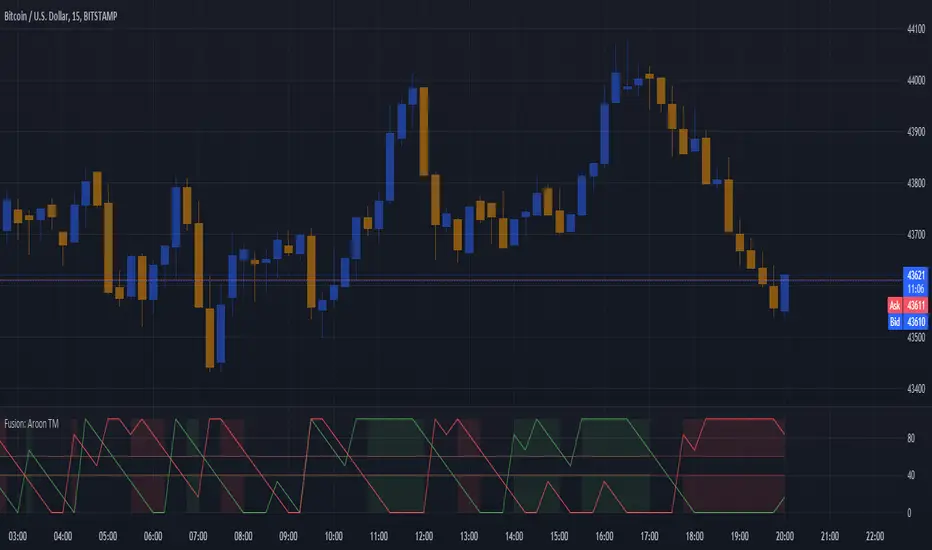
Fusion: Aroon trend matching with dual thresholds 2Same as previous one, just making the code publicly available.
You set an upper and lower threshold and when both are met a direction is determined.
I use this primarily as a confirmation indicator of a trend.
The addition to the normal Aroon is simply the threshold settings and the visuals. There is even an option to see the length you are using which I find useful when the length is long, say 40+ so you don't forget that it's considerably longer than how it's normally used.
Additionally it defaults to the normal colors we are familar with for up and down (long/short) but you can choose Aroon colors if you wish with just a checkbox.
The length is certainly not optimized so set to whatever suits your needs. The Aroon default is 14, I used 6 for one particular case so that's what it ended up being for this indicator.
I default to a dark theme so if you are using a light theme you may need to change some brightness settings.
Finally, if you find value please do make a comment, give a thumbs up etc.
Enjoy and good luck!
SentinelsSentinels is a playful variation on combining different mean averages (MA).
A cross of 2 user-defined MA's (MA 1 & MA 2) initiates the drawing of a sentinel with tentacles, which, on its turn can provide potential support/resistance or entry/stop-loss/take profit zones.
The type of each MA (MA 1, MA 2 and tentacles) can be chosen from following options:
SMA
EMA
SMMA (RMA)
HullMA
WMA
VWMA
DEMA
TEMA
🔹 Examples
Fast & slow MA: HullMA, Tentacles: TEMA
Fast & slow MA: SMA, Tentacles: WMA
Fast & slow MA: WMA, Tentacles: WMA
Fast & slow MA: TEMA, Tentacles: TEMA
🔶 DETAILS
🔹 Head-Body
The head-body is formed by:
the slow MA when there is a crossunder.
the fast MA when there is a crossover.
The color of the head-body is a gradient which can be set. The color of the tentacles (non-gradient) can be set as well.
The head-body of the sentinel will be visible for maximum 60 bars after a cross has occured.
🔹 Tentacles
The length of the 'Tentacles' is calculated by taking the difference between the length of MA 1 and MA 2 , and dividing this by 6 -> diff .
The length of each tentacle is MA 1 + a multiple of diff .
The tentacles will only begin to show from 2 bars after a cross.
Each tentacle will be shown maximum x bars after the cross:
Tentacle 1: 15 bars
Tentacle 2: 20 bars
Tentacle 3: 25 bars
Tentacle 4: 30 bars
Tentacle 5: 35 bars
Tentacle 6: 40 bars
🔹 Switch lengths
By switching lengths the colors get switched too.
Note that the tentacles act differently though.
In that way, this can be an extra option to visualize the tentacles .
🔶 Happy Holidays
Merry Christmas and a Happy New Year!

FlexiMA Variance Tracker - Strategy [presentTrading]█ Introduction and How It Is Different
The FlexiMA Variance Tracker by PresentTrading introduces a novel approach to technical trading strategies. Unlike traditional methods, it calculates deviations between a chosen indicator source (such as price or average) and a moving average with a variable length. This flexibility is achieved through a unique combination of a starting factor and an increment factor, allowing the moving average to adapt dynamically within a specified range. This strategy provides a more responsive and nuanced view of market trends, setting it apart from standard trading methodologies.
BTC 8h L/S
Local
█ Strategy, How It Works: Detailed Explanation
The FlexiMA Variance Tracker, developed by PresentTrading, stands at the forefront of trading strategies, distinguished by its adaptive and multifaceted approach to market analysis. This strategy intricately weaves various technical elements to construct a comprehensive trading logic. Here's an in-depth professional breakdown:
🔶Foundation on Variable-Length Moving Averages:
Central to this strategy is the concept of variable-length Moving Averages (MAs). Unlike traditional MAs with a fixed period, this strategy dynamically adjusts the length of the MA based on a starting factor and an incremental factor. This approach allows the strategy to adapt to market volatility and trend strength more effectively.
Each MA iteration offers a distinct temporal perspective, capturing short-term price movements to long-term trends. This aggregation of various time frames provides a richer and more nuanced market analysis, essential for making informed trading decisions.
🔶Deviation Analysis and Normalization:
The strategy calculates deviations of the price (or the chosen indicator source) from each of these MAs. These deviations are pivotal in identifying the immediate market direction relative to the average trend captured by each MA.
To standardize these deviations for comparability, they undergo a normalization process. The choice of normalization method (Max-Min or Absolute Sum) can significantly influence the interpretation of market conditions, offering distinct insights into price movements and trend strength.
🔹Normalization: Absolute Sum
🔶Composite Oscillator Construction:
A composite oscillator is derived from the median of these normalized deviations. The median serves as a balanced and robust central trend indicator, minimizing the impact of outliers and market noise.
Additionally, the standard deviation of these deviations is computed, providing a measure of market volatility. This volatility indicator is crucial for assessing market risk and can guide traders in setting appropriate stop-loss and take-profit levels.
🔶Integration with SuperTrend Indicator:
The FlexiMA strategy integrates the SuperTrend indicator, renowned for its effectiveness in identifying trend direction and reversals. The SuperTrend's incorporation enhances the strategy's ability to filter out false signals and confirm genuine market trends.
* The SuperTrend Toolkit is made by @QuantiLuxe
This combination of the variable-length MA oscillator with the SuperTrend indicator forms a potent duo, offering traders a dual-confirmation mechanism for trade signals.
🔹Supertrend's incorporation
🔶Strategic Trade Signal Generation:
Trade signals are generated when there is a confluence between the composite oscillator and the SuperTrend indicator. For example, a long position signal might be considered when the oscillator suggests an uptrend, and the SuperTrend flips to bullish.
The strategy's parameters are fully customizable, enabling traders to tailor the signal generation process to their specific trading style, risk tolerance, and market conditions.
█ Usage
To effectively employ the FlexiMA Variance Tracker strategy:
Traders should set their desired trade direction and fine-tune the starting and increment factors according to their market analysis and risk tolerance.
Indicator Length: 5
Indicator Length: 40
The strategy is suitable for a wide range of markets and can be adapted to different time frames, making it a versatile tool for various trading scenarios.
█ Default Settings Impact on Performance: FlexiMA Variance Tracker
1. Trade Direction (Configurable: Long, Short, Both): Determines trade types. 'Long' for buying, 'Short' for selling, 'Both' adapts to market trends.
2. Indicator Source: HLC3: Balances market sentiment by considering high, low, and close, providing comprehensive period analysis.
4. Indicator Length (Default: 10): Baseline for moving averages. Shorter lengths increase responsiveness but add noise, while longer lengths favor trends.
5. Starting and Increment Factor (Default: 1.0): Adjusts MA lengths range. Higher values capture broad market dynamics, lower values focus analysis.
6. Normalization Method (Options: None, Max-Min, Absolute Sum): Standardizes deviations. 'None' for raw deviations, 'Max-Min' for relative scaling, 'Absolute Sum' emphasizes relative strength.
7. SuperTrend Settings (ATR Length: 10, Multiplier: 15.0): Influences indicator sensitivity. Short ATR or high multiplier for short-term, long ATR or low multiplier for long-term trends.
8. Additional Settings (Mesh Style, Color Customization): Enhances visual clarity. Mesh style for detailed deviation view, colors for quick market condition identification.

FlexiMA Variance Tracker [presentTrading]🔶 Introduction and How it is Different
The FlexiMA Variance Tracker (FlexiMA-VT) represents a novel approach in technical analysis, distinctively standing out in the realm of financial market indicators. It leverages the concept of a variable Length Moving Average (MA) to create a versatile and dynamic oscillator. Unlike traditional oscillators that rely on a fixed-length MA, the FlexiMA-VT adapts to market conditions by varying the length of the MA, offering a more responsive and nuanced view of market trends. (*The achieved method took reference from SuperTrend Polyfactor Oscillator)
This innovative design allows the FlexiMA-VT to capture a broader spectrum of market movements, making it highly effective in diverse trading environments. Whether in stable or volatile markets, its adaptability ensures consistent relevance, providing traders with deeper insights into potential market swings.
The proposed oscillator accentuates several key aspects through a distinctive mesh of bars, which are derived from the differences between the price and a set of 20 Moving Averages, each altered by varying factors. The intensity of the mesh's colors serves as an indicator, with brighter hues signifying a greater convergence of Moving Average signals.
Starting Length = 5
Starting Length = 40
🔶 Strategy, How it Works: Detailed Explanation
1. Core Concept:
The FlexiMA-VT operates by comparing the price or an average value (indicator source) against a set of moving averages with varying lengths.
These lengths are dynamically adjusted through a starting factor and multiple increment factors, ensuring a comprehensive analysis over different time scales.
2. Normalization and Standard Deviation Calculation:
Once deviations are calculated, they undergo a normalization process, which can be set to 'None', 'Max-Min', or 'Absolute Sum'.
This step is crucial as it standardizes the deviations, allowing for a consistent scale of comparison.
The standard deviation of these normalized deviations is then calculated, offering insights into the market’s volatility and potential trend strength.
🔹Normalization
3. Median Value and Oscillator Creation:
The median of the normalized deviations forms the core of the FlexiMA-VT oscillator.
This median value provides a balanced central point, reflecting the consensus of various MA lengths.
The standard deviation bands plotted around the median enhance the interpretative power of the oscillator, indicating potential overbought or oversold conditions.
4. Multi-Factor Analysis:
The FlexiMA-VT uses multiple increment factors to generate a range of MAs, each factor representing a different scale of trend analysis.
By averaging the results from these different scales, the FlexiMA-VT forms a more comprehensive and reliable oscillator.
🔹Consensus
5. Practical Application:
Traders can use the FlexiMA-VT for various purposes, including identifying trend reversals, gauging market momentum, and determining overbought or oversold conditions.
Its dynamic nature makes it adaptable to different trading strategies, from short-term scalping to long-term position trading.
🔶 Settings
1. Indicator Source (indicatorSource): Determines the base data for calculations, typically a price average (HLC3).
2. Indicator Length (indicatorLength): Sets the base length for Moving Averages, influencing initial calculations.
3. Starting Factor (startingFactor): Initial multiplier for MA length, impacting the starting point of analysis.
4. Increment Factors (incrementFactor_1, incrementFactor_2, incrementFactor_3): Modulate the rate of change in MA lengths, adding variability.
5. Normalization Method (normalizeMethod): Standardizes deviations, with methods like 'Max-Min' and 'Absolute Sum' for comparability.

41-80 F&O MA ScreenerThis Pine Script is a TradingView indicator named "41-80-F&O EMA Screener." It calculates and displays four moving averages (MA1, MA2, MA3, and MA4) and the Relative Strength Index (RSI) on a chart. The script generates buy and short signals based on certain conditions involving the moving averages and RSI. Additionally, it includes a screener section that displays a table of symbols with buy and short signals.
Here's a breakdown of the key components:
Moving Averages (MAs):
MA1: Simple Moving Average with length len1 (green line).
MA2: Simple Moving Average with length len2 (red line).
MA3: Simple Moving Average with length len3 (orange line).
MA4: Simple Moving Average with length len4 (black line).
Relative Strength Index (RSI):
The RSI is calculated with a length of rsiLengthInput and a source specified by rsiSourceInput.
Conditions for Buy and Short Signals:
Buy Signal: When MA1 is above MA2 and MA3, and RSI is above 50.
Short Signal: When MA1 is below MA2 and MA3, and RSI is below 50.
Signal Plots:
Buy signals are plotted as "B" below the corresponding bars.
Short signals are plotted as "S" above the corresponding bars.
Background Coloring:
Bars are colored based on their opening and closing prices.
Screener Section:
The script defines a watchlist (gticker) with 40 predefined symbols.
It then calls the getSignal function for each symbol to identify buy and short signals.
The results are displayed in a table with long signals in green and short signals in red.
Table Theming:
The script allows customization of the table's background, frame, and text colors, as well as the text size.
The table's location on the chart can also be customized.
Please note that the script uses the Mozilla Public License 2.0. Make sure to review and comply with the terms of this license if you plan to use or modify the script.
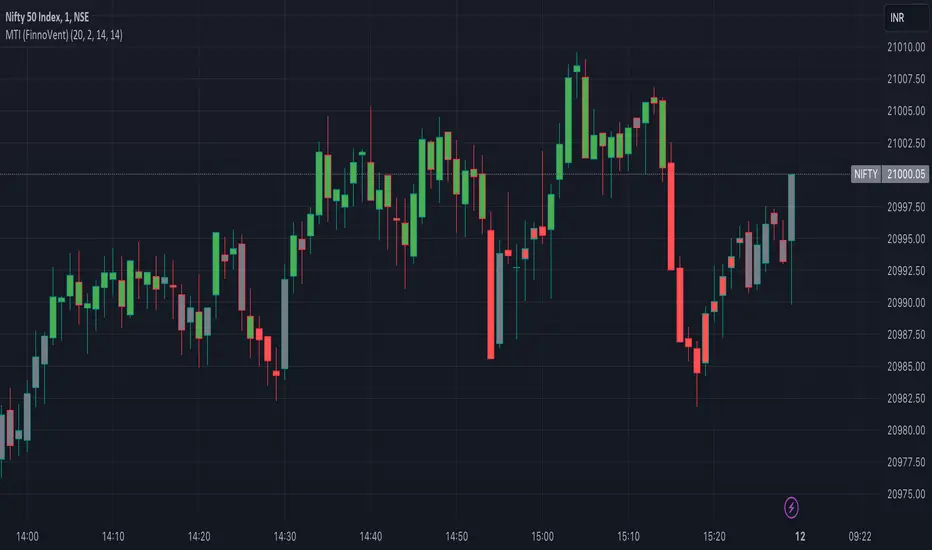
Market Trend Indicator (FinnoVent)The Market Trend Indicator (FinnoVent) is a comprehensive trading tool designed to provide clear visual cues for market trends on TradingView charts. This indicator combines the principles of Exponential Moving Averages (EMAs), Bollinger Bands, the Average Directional Index (ADX), and the Relative Strength Index (RSI) to offer a nuanced view of market movements.
How It Works:
Trend Identification with EMAs: The indicator uses two EMAs (3-period and 30-period) to identify the primary trend. An upward trend is signaled when the 3-period EMA crosses above the 30-period EMA, while a downward trend is indicated when the 3-period EMA crosses below the 30-period EMA.
Sideways Market Detection: To identify sideways trends, the indicator employs Bollinger Bands, ADX, and RSI. A sideways (or consolidating) market condition is identified when:
The price is between the middle 60% of the Bollinger Bands (avoiding the top and bottom 20%).
The ADX is below 30, indicating a lack of a strong trend.
The RSI is between 40 and 60, suggesting a neutral market momentum.
Visual Representation:
Bar Colors: The indicator colors the price bars on the chart based on the identified trend:
Green Bars: Indicate an upward trend.
Red Bars: Indicate a downward trend.
Grey Bars: Indicate a sideways or consolidating market.
How to Use:
Trend Following: Use the colored bars as a guide for trend following. Green bars suggest a potential entry for a long position, while red bars may indicate opportunities for short positions.
Sideways Market Caution: Grey bars signal a sideways market. In such conditions, traders might exercise caution and avoid trend-following strategies, as the market lacks a clear direction.
Complementary Analysis: While the Market Trend Indicator (FinnoVent) provides valuable insights, it's recommended to use it in conjunction with other forms of analysis (like fundamental analysis, other technical indicators, or price action) for comprehensive decision-making.
Suitable for: This indicator is versatile and can be applied to various timeframes and trading instruments, including stocks, forex, commodities, and indices.
Important Notes:
The indicator is designed to minimize repainting but always consider the latest data for the most accurate analysis.
Like all indicators, it is not foolproof. It works best when combined with a solid trading plan and risk management strategies.
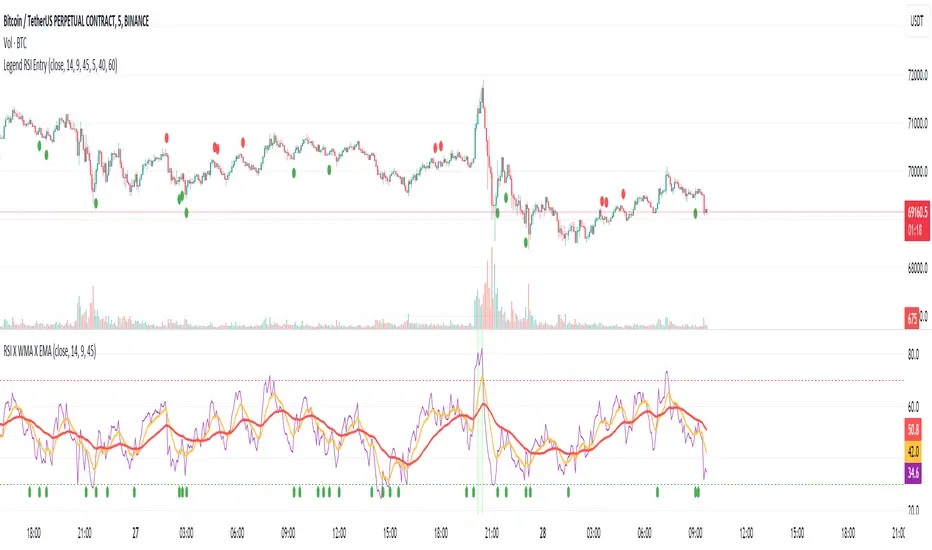
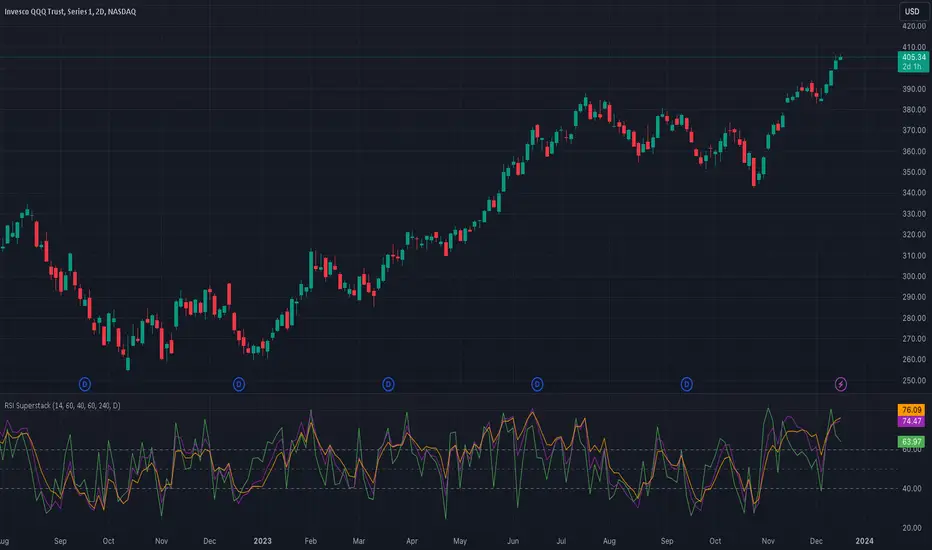
RSI SuperstackThis script integrates three Relative Strength Index (RSI) indicators across multiple time frames, providing a comprehensive overview of oversold and overbought conditions. This holistic approach enhances the precision of entry and exit points on shorter time frames.
As a momentum indicator, the Relative Strength Index assesses a security's strength during upward and downward price movements within the specified time period.
In a broader context, an upward slope in all indicators (green, purple, and orange) signifies an increasing market momentum, suggesting a potential continuation of the upward trend.
More specifically, a collective upward slope reaching or surpassing the 40 level in all indicators serves as a buy signal. Conversely, a uniform downward slope descending to or below the 60 level in all indicators constitutes a sell signal.
The default time frames for analysis include:
- 1 Hour (1H)
- 4 Hours (4H)
- Daily (D)
It is imperative to note that this indicator should not serve as the sole determinant for initiating long or short positions. Instead, it is recommended to consider it as part of a broader analysis, incorporating factors such as trend analysis and significant support levels.
Disclaimer: The utilization of this indicator should complement a comprehensive analysis and not be solely relied upon for decision-making regarding long or short positions.
savitzkyGolay, KAMA, HPOverview
This trading indicator integrates three distinct analytical tools: the Savitzky-Golay Filter, Kaufman Adaptive Moving Average (KAMA), and Hodrick-Prescott (HP) Filter. It is designed to provide a comprehensive analysis of market trends and potential trading signals.
Components
Hodrick-Prescott (HP) Filter
Purpose: Smooths out the price data to identify the underlying trend.
Parameters: Lambda: Controls the smoothness. Range: 50 to 1600.
Impact of Parameters:
Increasing Lambda: This makes the trend line more responsive to short-term market fluctuations, suitable for short-term analysis. A higher Lambda value decreases the degree of smoothing, making the trend line follow recent market movements more closely.
Decreasing Lambda: A lower Lambda value makes the trend line smoother and less responsive to short-term market fluctuations, ideal for longer-term trend analysis. Decreasing Lambda increases the degree of smoothing, thereby filtering out minor market movements and focusing more on the long-term trend.
Kaufman Adaptive Moving Average (KAMA):
Purpose: An adaptive moving average that adjusts to price volatility.
Parameters: Length, Fast Length, Slow Length: Define the sensitivity and adaptiveness of KAMA.
Impact of Parameters:
Adjusting Length affects the base period for efficiency ratio, altering the overall sensitivity.
Fast Length and Slow Length control the speed of KAMA’s adaptation. A smaller Fast Length makes KAMA more sensitive to price changes, while a larger Slow Length makes it less sensitive.
Savitzky-Golay Filter:
Purpose: Smooths the price data using polynomial regression.
Parameters: Window Size: Determines the size of the moving window (7, 9, 11, 15, 21).
Impact of Parameters:
A larger Window Size results in a smoother curve, which is more effective for identifying long-term trends but can delay reaction to recent market changes.
A smaller Window Size makes the curve more responsive to short-term price movements, suitable for short-term trading strategies.
General Impact of Parameters
Adjusting these parameters can significantly alter the signals generated by the indicator. Users should fine-tune these settings based on their trading style, the characteristics of the traded asset, and market conditions to optimize the indicator's performance.
Signal Logic
Buy Signal: The trend from the HP filter is below both the KAMA and the Savitzky-Golay SMA, and none of these indicators are flat.
Sell Signal: The trend from the HP filter is above both the KAMA and the Savitzky-Golay SMA, and none of these indicators are flat.
Usage
Due to the combination of smoothing algorithms and adaptability, this indicator is highly effective at identifying emerging trends for both initiating long and short positions.
IMPORTANT : Although the code and user settings incorporate measures to limit false signals due to lateral (sideways) movement, they do not completely eliminate such occurrences. Users are strongly advised to avoid signals that emerge during simultaneous lateral movements of all three indicators.
Despite the indicator's success in historical data analysis using its signals alone, it is highly recommended to use this code in combination with other indicators, patterns, and zones. This is particularly important for determining exit points from positions, which can significantly enhance trading results.
Limitations and Recommendations
The indicator has shown excellent performance on the weekly time frame (TF) with the following settings:
Savitzky-Golay (SG): 11
Hodrick-Prescott (HP): 100
Kaufman Adaptive Moving Average (KAMA): 20, 2, 30
For the monthly TF, the recommended settings are:
SG: 15
HP: 100
KAMA: 30, 2, 35
Note: The monthly TF is quite variable. With these settings, there may be fewer signals, but they tend to be more relevant for long-term investors. Based on a sample of 40 different stocks from various countries and sectors, most exhibited an average trade return in the thousands of percent.
It's important to note that while these settings have been successful in past performance, market conditions vary and past performance is not indicative of future results. Users are encouraged to experiment with these settings and adjust them according to their individual needs and market analysis.
As this is my first developed trading indicator, I am very open to and appreciative of any suggestions or comments. Your feedback is invaluable in helping me refine and improve this tool. Please feel free to share your experiences, insights, or any recommendations you may have.

TASC 2023.12 Growth and Value Switching System█ OVERVIEW
This script implements a rotation system for trading value and growth ETFs, as developed by Markos Katsanos and detailed in the article titled 'Growth Or Value?' in TASC's December 2023 edition of Traders' Tips . The purpose of this script is to demonstrate how short-term momentum can be employed to track market trends and provide clarity on when to switch between value and growth.
█ CONCEPTS
The central concept of the presented rotation strategy is based on the observation that the stock market undergoes cycles favoring either growth or value stocks. Consequently, the script introduces a momentum trading system that is designed to switch between value and growth equities based on prevailing market conditions. Specifically tailored for long-term index investors, the system focuses on trading Vanguard's value and growth ETFs ( VTV and VUG ) on a weekly timeframe.
To identify the ETF likely to outperform, the script uses a custom relative strength indicator applied to both VTV and VUG in comparison with an index ( SPY ). To minimize risk and drawdowns during bear markets, when both value and growth experience downtrends, the script employs the author's custom volume flow indicator (VFI) and blocks trades when its reading indicates money outflow . Positions are closed if the relative strength of the current open trade ETF falls below that of the other ETF for two consecutive weeks and is also below its moving average. Additionally, the script implements a stop-loss when the ETF is trading below its 40-week moving average, but only during bear markets.
The script plots the relative strengths of the value and growth equities along with the signals triggered by the aforementioned rules. Information about the current readings of the relative strength and volume flow indicators, along with the current open position, is displayed in a table.
█ CALCULATIONS
The script uses the request.security() function to gather price data for both equities and the reference index. Custom relative strength and volume flow indicators are calculated based on the formulas presented in the original article. By default, the script employs the same parameters for these indicators as proposed in the original article for VTV and VUG on a weekly timeframe.

Rate of Change StrategyRate of Change Strategy :
INTRODUCTION :
This strategy is based on the Rate of Change indicator. It compares the current price with that of a user-defined period of time ago. This makes it easy to spot trends and even speculative bubbles. The strategy is long term and very risky, which is why we've added a Stop Loss. There's also a money management method that allows you to reinvest part of your profits or reduce the size of your orders in the event of substantial losses.
RATE OF CHANGE (ROC) :
As explained above, the ROC is used to situate the current price compared to that of a certain period of time ago. The formula for calculating ROC in relation to the previous year is as follows :
ROC (365) = (close/close (365) - 1) * 100
With this formula we can find out how many percent the change in the current price is compared with 365 days ago, and thus assess the trend.
PARAMETERS :
ROC Length : Length of the ROC to be calculated. The current price is compared with that of the selected length ago.
ROC Bubble Signal : ROC value indicating that we are in a bubble. This value varies enormously depending on the financial product. For example, in the equity market, a bubble exists when ROC = 40, whereas in cryptocurrencies, a bubble exists when ROC = 150.
Stop Loss (in %) : Stop Loss value in percentage. This is the maximum trade value percentage that can be lost in a single trade.
Fixed Ratio : This is the amount of gain or loss at which the order quantity is changed. The default is 400, which means that for each $400 gain or loss, the order size is increased or decreased by an amount chosen by the user.
Increasing Order Amount : This is the amount to be added to or subtracted from orders when the fixed ratio is reached. The default is $200, which means that for every $400 gain, $200 is reinvested in the strategy. On the other hand, for every $400 loss, the order size is reduced by $200.
Initial capital : $1000
Fees : Interactive Broker fees apply to this strategy. They are set at 0.18% of the trade value.
Slippage : 3 ticks or $0.03 per trade. Corresponds to the latency time between the moment the signal is received and the moment the order is executed by the broker.
Important : A bot has been used to test the different parameters and determine which ones maximize return while limiting drawdown. This strategy is the most optimal on BITSTAMP:BTCUSD in 1D timeframe with the following parameters :
ROC Length = 365
ROC Bubble Signal = 180
Stop Loss (in %) = 6
LONG CONDITION :
We are in a LONG position if ROC (365) > 0 for at least two days. This allows us to limit noise and irrelevant signals to ensure that the ROC remains positive.
SHORT CONDITION :
We are in a SHORT position if ROC (365) < 0 for at least two days. We also open a SHORT position when the speculative bubble is about to burst. If ROC (365) > 180, we're in a bubble. If the bubble has been in existence for at least a week and the ROC falls back below this threshold, we can expect the asset to return to reasonable prices, and thus a downward trend. So we're opening a SHORT position to take advantage of this upcoming decline.
EXIT RULES FOR WINNING TRADE :
The strategy is self-regulating. We don't exit a LONG trade until a SHORT signal has arrived, and vice versa. So, to exit a winning position, you have to wait for the entry signal of the opposite position.
RISK MANAGEMENT :
This strategy is very risky, and we can easily end up on the wrong side of the trade. That's why we're going to manage our risk with a Stop Loss, limiting our losses as a percentage of the trade's value. By default, this percentage is set at 6%. Each trade will therefore take a maximum loss of 6%.
If the SL has been triggered, it probably means we were on the wrong side. This is why we change the direction of the trade when a SL is triggered. For example, if we were SHORT and lost 6% of the trade value, the strategy will close this losing trade and open a long position without taking into account the ROC value. This allows us to be in position all the time and not miss the best opportunities.
MONEY MANAGEMENT :
The fixed ratio method was used to manage our gains and losses. For each gain of an amount equal to the value of the fixed ratio, we increase the order size by a value defined by the user in the "Increasing order amount" parameter. Similarly, each time we lose an amount equal to the value of the fixed ratio, we decrease the order size by the same user-defined value. This strategy increases both performance and drawdown.
NOTE :
Please note that the strategy is backtested from 2017-01-01. As the timeframe is 1D, this strategy is a medium/long-term strategy. That's why only 34 trades were closed. Be careful, as the test sample is small and performance may not necessarily reflect what may happen in the future.
Enjoy the strategy and don't forget to take the trade :)

ICT Silver Bullet with signals
The "ICT Silver Bullet with signals" indicator (inspired from the lectures of "The Inner Circle Trader" (ICT)),
goes a step further than the ICT Silver Bullet publication, which I made for LuxAlgo :
• uses HTF candles
• instant drawing of Support & Resistance (S/R) lines when price retraces into FVG
• NWOG - NDOG S/R lines
• signals
The Silver Bullet (SB) window which is a specific 1-hour interval where a Fair Value Gap (FVG) pattern can be formed.
When price goes back to the FVG, without breaking it, Support & Resistance lines will be drawn immediately.
There are 3 different Silver Bullet windows (New York local time):
The London Open Silver Bullet (03 AM — 04 AM ~ 03:00 — 04:00)
The AM Session Silver Bullet (10 AM — 11 AM ~ 10:00 — 11:00)
The PM Session Silver Bullet (02 PM — 03 PM ~ 14:00 — 15:00)
🔶 USAGE
This technique can visualise potential support/resistance lines, which can be used as targets.
The script contains 2 main components:
• forming of a Fair Value Gap (FVG)
• drawing support/resistance (S/R) lines
🔹 Forming of FVG
When HTF candles forms an FVG, the FVG will be drawn at the end (close) of the last HTF candle.
To make it easier to visualise the 2 HTF candles that form the FVG, you can enable
• SHOW -> HTF candles
During the SB session, when a FVG is broken, the FVG will be removed, together with its S/R lines.
The same goes if price did not retrace into FVG at the last bar of the SB session
Only exception is when "Remove broken FVG's" is disabled.
In this case a FVG can be broken, as long as price bounces back before the end of the SB session, it will remain to be visible:
🔹 Drawing support/resistance lines
S/R target lines are drawn immediately when price retraces into the FVG.
They will remain updated until they are broken (target hit)
Potential S/R lines are formed by:
• previous swings (swing settings (left-right)
• New Week Opening Gap (NWOG): close on Friday - weekly open
• New Day Opening Gap (NWOG): close previous day - current daily open
Only non-broken lines are included.
Broken =
• minimum of open and close below potential S/R line
• maximum of open and close above potential S/R line
NDOG lines are coloured fuchsia (as in the ICT lectures), NWOG are coloured white (darkmode) or black (lightmode ~ ICT lectures)
Swing line colour can be set as desired.
Here S/R includes NDOG lines:
The same situation, with "Extend Target-lines to their source" enabled:
Here with NWOG lines:
This publication contains a "Minimum Trade Framework (mTFW)", which represents the best-case expected price delivery, this is not your actual trade entry - exit range.
• 40 ticks for index futures or indices
• 15 pips for Forex pairs
The minimum distance (if applicable) can be shown by enabling "Show" - "Minimum Trade Framework" -> blue arrow from close to mTFW
Potential S/R lines needs to be higher (bullish) or lower (bearish) than mTFW.
🔶 SETTINGS
(check USAGE for deeper insights and explanation)
🔹 Only last x bars: when enabled, the script will do most of the calculations at these last x candles, potentially this can speeds calculations.
🔹 Swing settings (left-right): Sets the length, which will set the lookback period/sensitivity of the ZigZag patterns (which directs the trend and points for S/R lines)
🔹 FVG
HTF (minutes): 1-15 minutes.
• When the chart TF is equal of higher, calculations are based on current TF.
• Chart TF > 15 minutes will give the warning: "Please use a timeframe <= 15 minutes".
Remove broken FVG's: when enabled the script will remove FVG (+ associated S/R lines) immediately when FVG is broken at opposite direction.
FVG's still will be automatically removed at the end of the SB session, when there is no retrace, together with associated S/R lines,...
~ trend: Only include FVG in the same direction as the current trend
Note -> when set 'right' (swing setting) rather high ( > 3), he trend change will be delayed as well (default 'right' max 5)
Extend: extend FVG to max right side of SB session
🔹 Targets – support/resistance
Extend Target-lines to their source: extend lines to their origin
Colours (Swing S/R lines)
🔹 Show
SB session: show lines and labels of SB session (+ colour)
• Labels can be disabled separately in the 'Style' section, colour is set at the 'Inputs' section
Trend : Show trend (ZigZag, coloured ~ trend)
HTF candles: Show the 2 HTF candles that form the FVG
Minimum Trade Framework: blue arrow (if applicable)
🔶 ALERTS
There are 4 signals provided (bullish/bearish):
FVG Formed
FVG Retrace
Target reached
FVG cancelled
You can choose between dynamic alerts - only 1 alert needs to be set for all signals, or you can set specific alerts as desired.
💜 PURPLE BARS 😈
• Since TradingView has chosen to give away our precious Purple coloured Wizard Badge, bars are coloured purple 😊😉

Bitcoin Halving Cycle ProfitThe Bitcoin Halving Cycle Profit indicator, developed by Kevin Svenson , unveils a consistent and predetermined profit-taking cycle triggered by each Bitcoin halving event. This indicator streamlines the analysis of halving occurrences, providing explicit signals for both profit-taking and Dollar-Cost Averaging strategies.
Following each Bitcoin halving event, a fixed number of weeks consistently mark the period of maximum profitability for profit-taking:
🔄 Halving Cycle Profit Timeline Explained:
• 40 Weeks (Post-Halving) = Start of the optimal profit-taking zone.
• 80 Weeks (Post-Halving) = "Last Call" for profit-taking before the onset of a bear market.
• 125 Weeks (Post-Halving) = The optimal timeframe to begin Dollar-Cost Averaging.
(Bitcoin Weekly Chart using Halving Cycle Profit)
One standout feature of this indicator is its inherent clarity and comprehensive labeling. This quality makes it exceptionally easy to discern the locations of key factors and turning points, enhancing your understanding of the market dynamics it highlights.
(Bitcoin Daily Chart using Halving Cycle Profit)
🚀 This indicator doesn't limit its effectiveness to just Bitcoin; it seamlessly integrates with top blue-chip altcoins like Ethereum and most household names in the crypto industry.
( Ethereum Weekly Chart using Halving Cycle Profit)
🛠️ Customizable display options are availible. Users have the flexibility to toggle/adjust labels, lines, and color fills according to their preferences.
📑 In summary, the Bitcoin Halving Cycle Profit indicator is a versatile and user-friendly tool, offering clarity and customization for traders navigating both Bitcoin and top altcoins.
⚠️ It's important to note that while the Bitcoin Halving Cycle Profit indicator provides historical insights, past performance does not guarantee future results. Timing profitability in the cryptocurrency market involves inherent risks, and this indicator should not be construed as financial advice. Users are encouraged to exercise caution, conduct thorough research, and make informed decisions based on their individual risk tolerance and financial goals.