Williams %R w/ Bollinger Bands [Loxx]Williams %R w/ Bollinger Bands is a Williams %R indicator with Bollinger bands. The Bollinger bands are used to determine when breakouts/breakdowns occur.
What is Williams %R?
Williams %R , also known as the Williams Percent Range, is a type of momentum indicator that moves between 0 and -100 and measures overbought and oversold levels. The Williams %R may be used to find entry and exit points in the market. The indicator is very similar to the Stochastic oscillator and is used in the same way. It was developed by Larry Williams and it compares a stock’s closing price to the high-low range over a specific period, typically 14 days or periods.
Included:
bar coloring
signals
alerts
Pesquisar nos scripts por "williams"

Williams Fractal (equals fixed)In contrast to the default Williams Fractal generator, this one also shows fractals if the two candles before or after are equal (>=, <=).
Williams Fractals Ultimate (Donchian Adjusted)Williams Fractals Ultimate (Donchian Adjusted)
Understanding Williams Fractals
Williams Fractals are a simple yet powerful tool used to identify potential turning points in the market. They highlight local highs (up fractals) and local lows (down fractals) based on a set period.
An up fractal appears when a price peak is higher than the surrounding prices.
A down fractal appears when a price low is lower than the surrounding prices.
Fractals help traders spot support and resistance levels, potential trend reversals, and price breakout zones.
Why Adjust Fractals with the Donchian Channel?
The standard Williams Fractals method identifies local highs and lows without considering broader market context. This script enhances fractal accuracy by integrating the Donchian Channel, which tracks the highest highs and lowest lows over a set period.
- The Donchian Baseline is calculated as the average of the highest high and lowest low over a selected period.
- Fractals are filtered based on this baseline:
Up Fractals are only shown if they are above the Donchian baseline.
Down Fractals are only shown if they are below the Donchian baseline.
This filtering method removes weak signals and ensures that only relevant fractals aligned with market structure are displayed.
Key Features of the Script
Customizable Fractal & Donchian Periods – Allows traders to fine-tune fractal sensitivity.
Donchian-Based Filtering – Reduces noise and highlights meaningful fractals.
Fractal ZigZag Line (Optional) – Helps visualize price swings more clearly.
Why Is This So Effective?
Stronger trend signals – Filtering with the Donchian baseline eliminates unreliable fractals.
Clearer price action – The optional ZigZag line visually connects significant highs and lows.
Easy trend identification – Helps traders confirm breakout zones and key price levels.
This script is a technical analysis tool and does not guarantee profitable trades. Always combine it with other indicators and risk management strategies before making trading decisions.

Williams %R on Chart w/ Dynamic Zones [Loxx]Williams %R on Chart w/ Dynamic Zones is a Williams %R indicator but instead of being an oscillator it appears on chart. The WPR calculation used here leverages T3 moving average for its calculation. In addition, the WPR is bound by Dynamic Zones.
What is Williams %R?
Williams %R , also known as the Williams Percent Range, is a type of momentum indicator that moves between 0 and -100 and measures overbought and oversold levels. The Williams %R may be used to find entry and exit points in the market. The indicator is very similar to the Stochastic oscillator and is used in the same way. It was developed by Larry Williams and it compares a stock’s closing price to the high-low range over a specific period, typically 14 days or periods.
What is T3 moving average?
Developed by Tim Tillson, the T3 Moving Average is considered superior to traditional moving averages as it is smoother, more responsive and thus performs better in ranging market conditions as well.
What are Dynamic Zones?
As explained in "Stocks & Commodities V15:7 (306-310): Dynamic Zones by Leo Zamansky, Ph .D., and David Stendahl"
Most indicators use a fixed zone for buy and sell signals. Here’ s a concept based on zones that are responsive to past levels of the indicator.
One approach to active investing employs the use of oscillators to exploit tradable market trends. This investing style follows a very simple form of logic: Enter the market only when an oscillator has moved far above or below traditional trading lev- els. However, these oscillator- driven systems lack the ability to evolve with the market because they use fixed buy and sell zones. Traders typically use one set of buy and sell zones for a bull market and substantially different zones for a bear market. And therein lies the problem.
Once traders begin introducing their market opinions into trading equations, by changing the zones, they negate the system’s mechanical nature. The objective is to have a system automatically define its own buy and sell zones and thereby profitably trade in any market — bull or bear. Dynamic zones offer a solution to the problem of fixed buy and sell zones for any oscillator-driven system.
An indicator’s extreme levels can be quantified using statistical methods. These extreme levels are calculated for a certain period and serve as the buy and sell zones for a trading system. The repetition of this statistical process for every value of the indicator creates values that become the dynamic zones. The zones are calculated in such a way that the probability of the indicator value rising above, or falling below, the dynamic zones is equal to a given probability input set by the trader.
To better understand dynamic zones, let's first describe them mathematically and then explain their use. The dynamic zones definition:
Find V such that:
For dynamic zone buy: P{X <= V}=P1
For dynamic zone sell: P{X >= V}=P2
where P1 and P2 are the probabilities set by the trader, X is the value of the indicator for the selected period and V represents the value of the dynamic zone.
The probability input P1 and P2 can be adjusted by the trader to encompass as much or as little data as the trader would like. The smaller the probability, the fewer data values above and below the dynamic zones. This translates into a wider range between the buy and sell zones. If a 10% probability is used for P1 and P2, only those data values that make up the top 10% and bottom 10% for an indicator are used in the construction of the zones. Of the values, 80% will fall between the two extreme levels. Because dynamic zone levels are penetrated so infrequently, when this happens, traders know that the market has truly moved into overbought or oversold territory.
Calculating the Dynamic Zones
The algorithm for the dynamic zones is a series of steps. First, decide the value of the lookback period t. Next, decide the value of the probability Pbuy for buy zone and value of the probability Psell for the sell zone.
For i=1, to the last lookback period, build the distribution f(x) of the price during the lookback period i. Then find the value Vi1 such that the probability of the price less than or equal to Vi1 during the lookback period i is equal to Pbuy. Find the value Vi2 such that the probability of the price greater or equal to Vi2 during the lookback period i is equal to Psell. The sequence of Vi1 for all periods gives the buy zone. The sequence of Vi2 for all periods gives the sell zone.
In the algorithm description, we have: Build the distribution f(x) of the price during the lookback period i. The distribution here is empirical namely, how many times a given value of x appeared during the lookback period. The problem is to find such x that the probability of a price being greater or equal to x will be equal to a probability selected by the user. Probability is the area under the distribution curve. The task is to find such value of x that the area under the distribution curve to the right of x will be equal to the probability selected by the user. That x is the dynamic zone.
Included
Bar coloring
Channels fill
Loxx's Expanded Source Types
35+ moving average types

Williams Accumulation/Distribution (Williams AD) Accumulation is a term used to describe a market controlled by buyers;
whereas distribution is defined by a market controlled by sellers.
Williams recommends trading this indicator based on divergences:
Distribution of the security is indicated when the security is making
a new high and the A/D indicator is failing to make a new high. Sell.
Accumulation of the security is indicated when the security is making
a new low and the A/D indicator is failing to make a new low. Buy.

Williams Fractals - LH/HLSame of original Williams Fractals, but with the following changes
- changed arrow directions
- added option to show Lower Highs and Higher Lows
- added alerts for Lower High and Higher Low
Enjoy~~

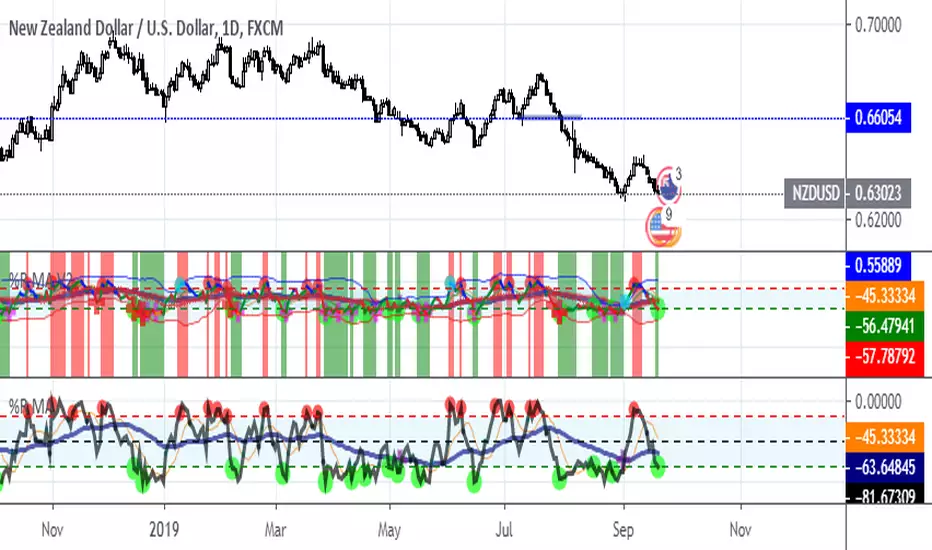
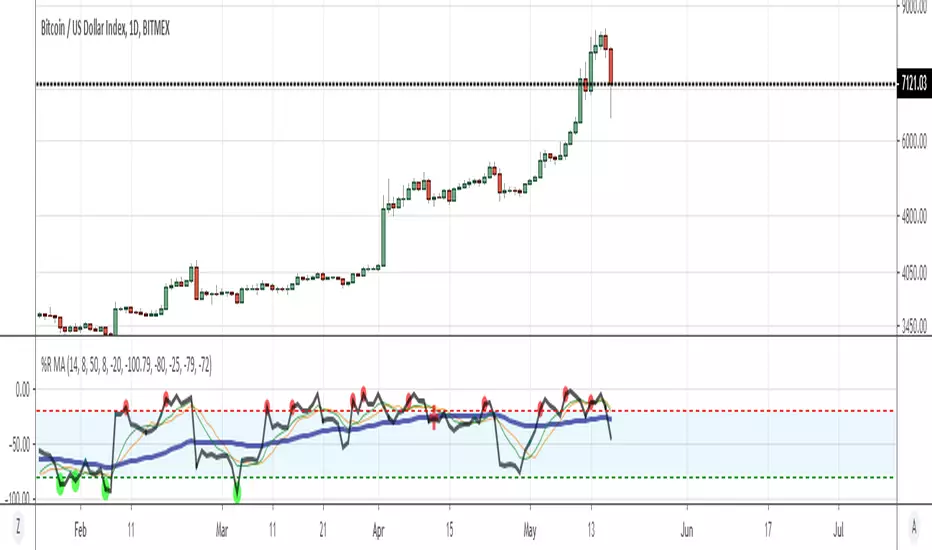
Williams %R /w BollingerWilliams %R V2 with Bollinger Bands
Due to the positive messages i got for the first version of "%R MA" indicator, i decided to develop an extended version of “%R MA” and I introduce you “%R V2 with Bollinger Bands”
Enhanced with additional features, such as Bollinger Bands to analyse waves, which can help traders determine if there is a buy or sell signal about to occur.
What’s changed?
V2 inherits all of the features of the first indicator and contains several additional features such as:
-Bollinger Bands
-Additional type of moving average to help to determine support and resistance levels.
-Background color change in case of possible trend reversal.
-Williams %R line colors to determine if the current is strong enough to continue or it’s a reversal.
-More customization
New Visuals
Background coloring comes by default and transparency level is adjustable, so traders can make it more or less visible any time they want. Background color turns red when Williams crosses overbought level and turns green when it crosses oversold level. This way trader can spot and analyse duration of overbought and oversold phase for the stocks/commodities/currencies they want. Rather than just giving only a signal, background colors also could be useful to determine, how the certain stock/commodity/currency behaved at certain levels before.
Red Line:
Red line is the newly introduced moving average for this indicator, which helps to determine resistance and support levels for Williams moves. It’s very similar to WMA;but it responds to price changes/moves much faster.
Bollinger Bands:
This is the key feature of this indicator. As a standalone indicator, it’s mostly used to monitor volatility and have certain strategies while entering or exiting a trade. Since price changes reflects to Williams indicator, I thought applying Bollinger Bands on Williams would be a good idea. Although, it requires at least basic knowledge of Bollinger Bands, it’s still quite easy to use since there are circles/crosses to warn traders for possible trend changes. Red little crosses at the middle represents Bollinger Bands moving average, so when Williams crossover continue to uptrend, that’s a buy signal. If %R reaches to Bollinger Upper Bands and crosses the band, it’ll draw a circle (aqua) to warn traders that the certain stock/currency is now at overbought area and be ready to sell. If you are using a trailing stop-loss, make sure you move your stop-loss in case if a sudden bearish move happens.
Similar to overbought bands, oversold bands act similar and when %R line crosses Bollinger Lower Bands, it’ll draw a red cross which indicates, trend might make a reversal so if you are in a short position you can either close your position or if you are using a trailing stop-loss method, make sure you have you set your stops at profitable levels, in case if there is a sudden bullish move. If you are waiting for a buy signal, wait for a confirmation both from chart and the indicator.
Also if both Bollinger Bands get closer to moving average in the middle, that usually leads to a huge move for both directions. Although, if that happens where there are several oversold(buy) signals, that usually leads to an explosive uptrend move. Same goes for the overbought(sell) signal.
As for any indicator, traders should always wait for a confirmation to buy and sell. And should not rely on a single indicator. Certain stocks/currencies may make unexpected moves so monitor price and trend changes closely on the chart as well.
Williams Line Colors:
Green line mostly represents an uptrend and as long as it goes up with the same color, that means price is still going up and uptrend still continues. If there are are small moves with red or blue lines in the middle of this move, that might be a small retracement, if that happens, make sure to watch out for the next candle. If move ends up with an overbought signal, trend may make a reversal. If current or upcoming candle manages to close above the previous candle, Williams will continue to draw a green line.
Blue line indication depends on the move length. If that happens during an uptrend, this move might end up with a small retracement. However, if blue line appears after an overbought signal, that means there might be a considerable retracement. Blue lines only appear closer to overbought levels and once it breaks WMA and red line support, color will be changed to red from blue. Blue line should be considered as reversal signal along with the overbought visuals. Also, if prices consolidate around similar prices; but each new bar closes below the previous bar, Williams will continue to draw a blue line, until it reaches to certain lower or upper level.
Red/Orange line appears when prices could not keep up and candles continues to make lower closes. This line is an indication of a downtrend and will appear below -50 level which is somewhat middle for this indicator. Orange lines appear almost at the bottom most of the time if there are no new lower lows at the present, these signals can be used to buy from the low. Although traders should wait for a green line and a green candle confirmation. If there are one or more oversold signals close to both red and orange lines, that will strengthen the possibility of a buy signal.
FX:NZDUSD
COINBASE:ETHUSD
OANDA:XAUUSD
Williams %R with MA-EMA-WMAWilliams %R is a momentum indicator that is the inverse of the Fast Stochastic Oscillator. Also referred to as %R, Williams %R reflects the level of the close relative to the highest high for the look-back period. However, bare-metal version of Williams %R does not indicate where the trend is heading and only gives you buy and sell signals, whenever it crosses over or under certain levels. In order to improve this indicator i decided to add few things, in order to see where the trend is heading while Williams %R giving you buy and sell signals at the same time.
Information:
This indicator comes with adjustable (ma-ema and wma) moving averages, applied on Williams %R signal. So whenever Williams %R crossover SMA or EMA it's an indication of stock/coin price is moving upwards while it crossunder SMA or EMA values, it's an indication of price will go downwards. Convincigly though each crosspoints have their own custom colors, so you can identify if it's going up or down.
Oversold and Overbought Visuals:
Whenever Williams %R crossover overbought area, it will draw an orange circle, which indicates the direction of the trend is about to end and price of that stock/coin may fall. Anything over -20 is considered as Overbought.
Convincigly when Williams %R crossunder oversold area, it will drawn lime color circle, which indicates that the stock/coin may have reached at it's bottom and trend change is expected. Anything below -80 is considered as Oversold and could be used as buying zone.
Trend following with WMA:
As mentioned earlier, while Willams %R gives you reliatively good buy and sell points, it does not show you the whole picture, thanks to it's jagged nature. If the certain stock/coin in a falling trend, Williams %R may give you numerous buy and sell signals; but won't show you if it's going to get lower or higher. Thanks to WMA, it filters most of the jagged signals and gives you an idea of where the trend is heading, also offers key turning points (trend overbought and oversold areas)
Whenever WMA draws a red cross on top, it indicates the following trend is about the change and if you have not sold the stocks/coins you are holding, you may only have small amount of time left to do so. And when WMA draws a green cross at the bottom, it's an indication of strong buy signal and the downtrend is about to end. Although for both of these keypoints, you should always confirm it via Williams %R signals and candlesticks as well.
There is also something called midpoint. Whenever WMA draws purple circle at specific levels(which is also adjustable) it will give you an idea of trend may change it's direction if it's going upwards or downwards. These circles do not offer you a buy or sell signal and only informs you about where trend is heading or where it might make a reversal. You can also adjust overbought-oversold and midpoint levels for your own liking.
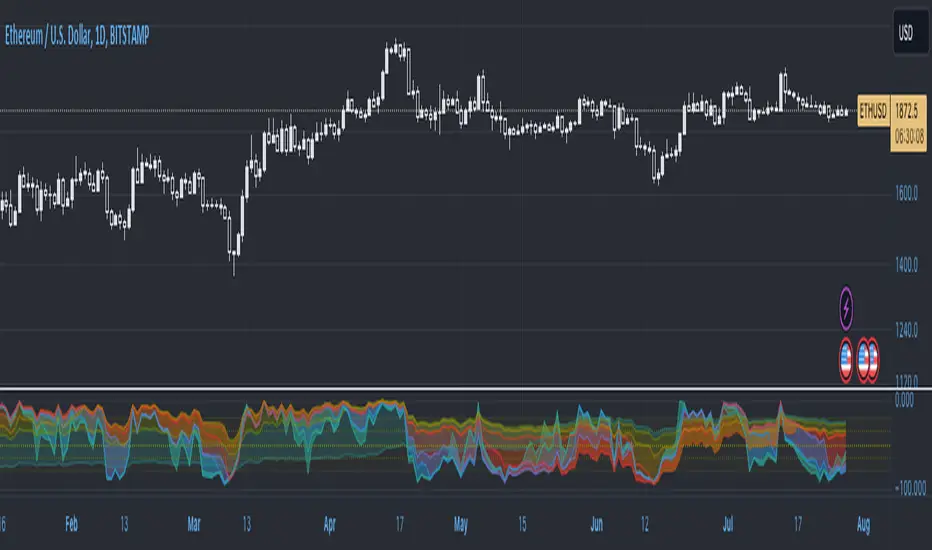
Williams %R Liquidity Sweeps [UAlgo]🔶Description:
The "Williams %R Liquidity Sweeps " designed to identify potential liquidity sweeps based on the Williams %R oscillator. The indicator helps traders spot areas where liquidity may be accumulating or dispersing rapidly, which can signal potential buying or selling opportunities or confluence/confirmation your decisions.
🔶Key Features:
Williams %R Oscillator: The indicator utilizes the Williams %R oscillator, a momentum indicator that measures overbought and oversold levels.
Liquidity Sweep Detection: It identifies liquidity sweeps by detecting pivot highs and lows within the Williams %R oscillator ( Sweeps only occur in Overbought/Oversold zones ).
Customizable Parameters: Traders can adjust various parameters such as oscillator length, overbought/oversold levels, pivot length, and maximum lines to suit their trading preferences.
Visual Representation: Liquidity sweeps are visually represented on the chart with labels and points that waiting for sweep (green and red lines default) are can be used as support and resistance zones. The indicator dynamically manages the display of support and resistance lines. Removing outdated lines to maintain relevance.
Example for Oscillator Liquidity Sweep:
Disclaimer:
This indicator is provided for informational and educational purposes only and should not be considered financial advice. Trading involves risks, and past performance is not indicative of future results. Users are encouraged to conduct their own research and consult with a qualified financial advisor before making any investment decisions based on this indicator.
The effectiveness of the indicator may vary depending on market conditions, trading strategies, and other factors. Traders should exercise caution and practice proper risk management techniques when using this or any other trading tool.

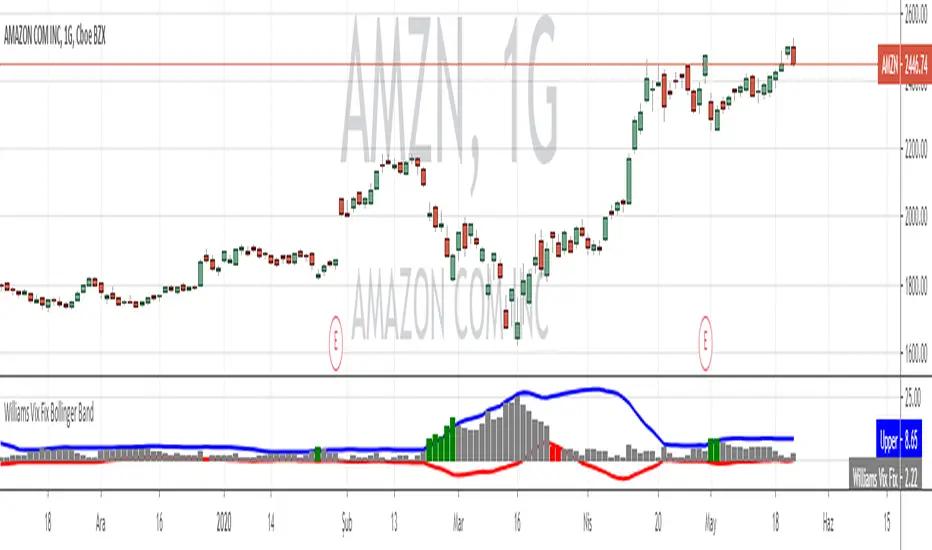
Williams VIX For Bottoms [DCD]Williams VIX Original - Authentic Volatility Fear Gauge
What This Indicator Does
The Williams VIX Fix measures market fear by calculating how far current lows deviate from recent highs, identifying potential market bottoms during high volatility periods. This implementation provides Larry Williams' original formula in its purest form.
How It Works
Core Formula:
VIX Fix = ((Highest High over 22 periods - Current Low) / Highest High over 22 periods) × 100
The calculation process:
Measures Relative Distance: Compares current low to highest high over lookback period
Converts to Percentage: Normalizes values for cross-market comparison
Applies Statistical Analysis: Uses Bollinger Bands (2 std dev) around VIX Fix values
Filters with Percentiles: 85th percentile threshold removes noise
Signal Generation
Green Flash Signals trigger when either condition is met:
VIX Fix exceeds upper Bollinger Band (2 standard deviations above 20-period MA)
VIX Fix exceeds Range High (85th percentile of recent values)
This dual-condition approach reduces false signals while capturing genuine volatility spikes.
What Makes This Original
Pure Formula Implementation: Uses Williams' exact original calculation without modifications
Dual Confirmation System: Combines Bollinger Bands with percentile analysis
Professional Visualization: Histogram display, background highlighting, and live value table
Comprehensive Alerts: Signal start/end notifications plus Green Flash alerts
How to Use
Primary Purpose: Spot high-probability reversal zones during market fear climaxes
Signal Interpretation:
Green triangle + background highlight = High volatility reversal zone
Higher VIX Fix values = Stronger fear/better reversal potential
Use with price action confirmation for best results
Optimal Settings:
Timeframes: 4H, Daily, Weekly
Markets: All (stocks, crypto, forex, commodities)
Combine with support levels and candlestick patterns
Key Parameters:
VIX Fix Length (22): Lookback period for highest high
Std Dev Multiplier (2.0): Bollinger Band sensitivity
Percentile High (0.85): Only top 15% of readings trigger signals
The VIX Fix excels at identifying market fear climaxes that coincide with significant price bottoms, making it valuable for swing traders seeking high-probability entries during market stress.

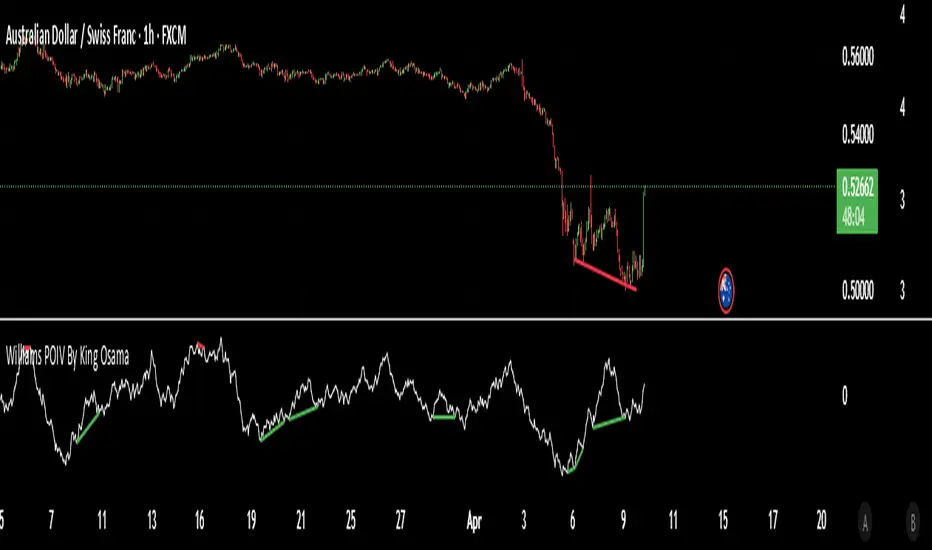
Williams POIV By King OsamaWilliams POIV Indicator
By King Osama
The Williams POIV (Price and Open Interest From COT Data) is a technical indicator designed to combine price movement with open interest data to provide valuable insights into market strength and sentiment. By integrating price changes and open interest (a measure of market participation), the indicator aims to detect shifts in market dynamics and highlight potential turning points.
The Williams POIV works by calculating the relationship between price changes and the true range, combined with open interest data, to generate a composite value that reflects the accumulation or distribution of market positions. This gives traders a deeper understanding of market trends and potential reversals.
Key Features:
Price and Open Interest Integration: Merges price movements with open interest data to assess market strength.
Market Sentiment Insights: Helps identify periods of accumulation or distribution, offering a clearer picture of market conditions.
Trend Analysis: Can be used to spot divergences and potential trend reversals.
This indicator is ideal for traders looking to analyze the interplay between price movements and open interest, offering enhanced insight into market trends and price action.
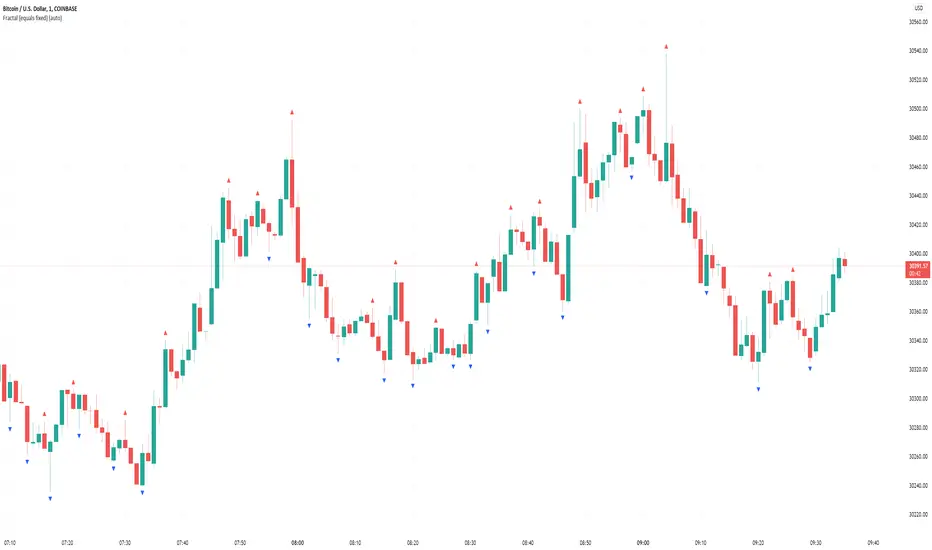
Williams Fractals for ExtremesThis script, written in Pine Script (version 5), implements an indicator for the automatic detection and visualization of fractal extremes on the price chart. The core algorithm is based on Bill Williams' fractal theory and identifies local highs and lows, which are often used to determine potential reversal points and support/resistance levels in the market.
### Key Features:
#### Fractal Detection:
- The indicator identifies a fractal high if the middle candle in a sequence of five candles (two on the left and two on the right) has the highest value.
- A fractal low is identified if the middle candle in the same type of five-candle sequence has the lowest value.
#### Extreme Visualization:
- Fractal highs are displayed as red dots on the chart, signaling potential local peaks.
- Fractal lows are shown as green dots, indicating local troughs.
### Usage:
- The indicator is designed for use across all timeframes and can be applied to both cryptocurrency and traditional financial markets.
- Highlighted points allow traders to quickly spot key levels, aiding in identifying potential zones for trade entry or exit.
### Application in Trading:
#### Identifying Key Levels:
- Fractal highs and lows can serve as resistance and support levels. A breakout beyond a fractal in either direction may signal a continuation of movement in that direction.
#### Finding Reversal Points:
- Fractal extremes indicate potential market reversals, making them useful in counter-trend trading strategies.
#### Adaptability to Market Conditions:
- The indicator updates dynamically with the appearance of new candles, providing traders with real-time fractal extreme levels.
### Settings and Parameters:
- In its current version, the script does not include customizable settings as it implements the standard concept of Williams' fractals.

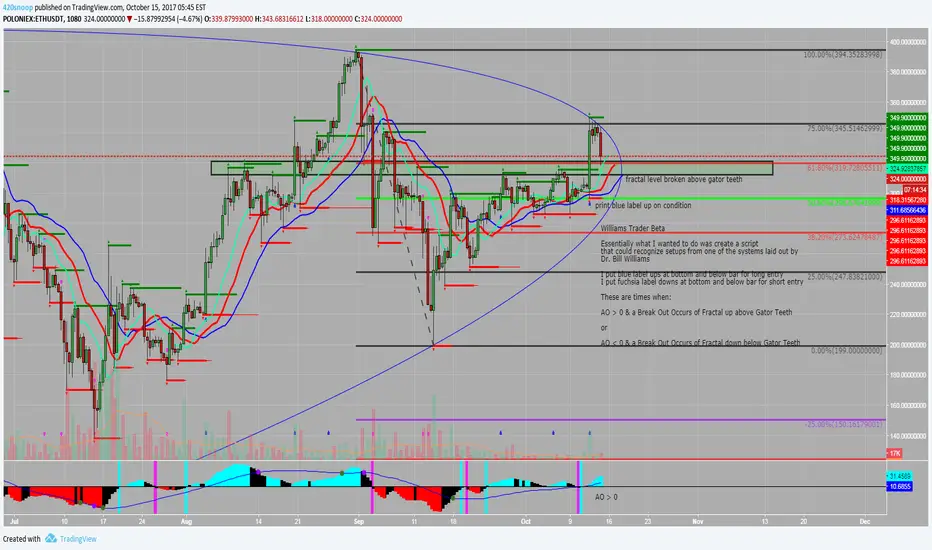
Williams Trader BetaWilliams Trader Beta (not for public use)
Essentially what I wanted to do was create a script that could recognize setups from one of the systems laid out by Dr. Bill Williams
I put blue label ups at bottom and below bar for long entry
I put fuchsia label downs at bottom and below bar for short entry
These are times when:
AO > 0 & a Break Out Occurs of Fractal up above Gator Teeth
or
AO < 0 & a Break Out Occurs of Fractal down below Gator Teeth
These also have alert conditions... be sure to use once per bar on close if using this condition!
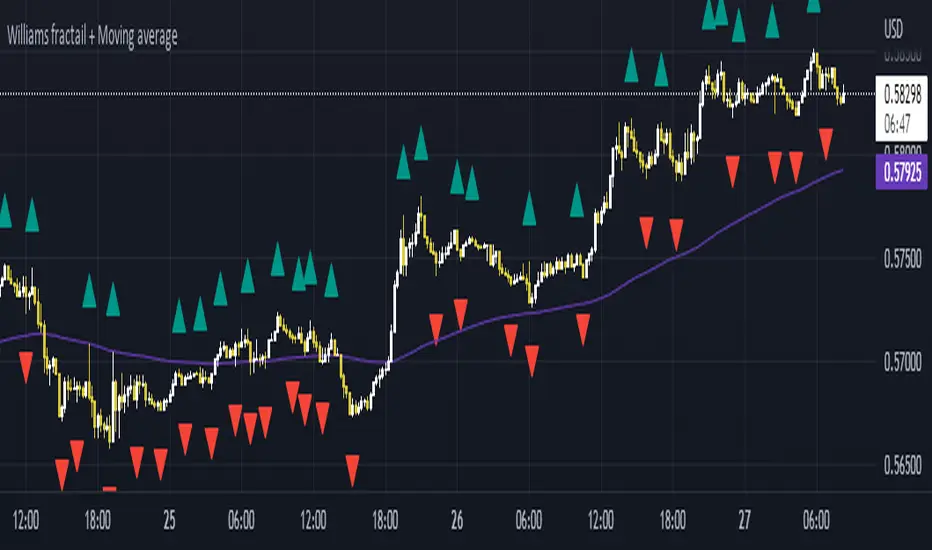
Williams Fractals + SMMAwilliams fractail + moving average. Is for educational . combined indicator of williams fractails and smmothed moving average
Williams %R with multiple periodsWilliams %R technical analysis oscillator by Larry Williams with 8 customizable periods and fills. Default periods: 10, 13, 21, 34, 55, 89, 144, 233. Default colors: "One Half" color scheme by Son A. Pham.
Williams Fractals with Alerts by MrTuanDoanCustom William Fractals for alerts and educational purpose.
Added custom alerts for Williams Fractals.
Also added filter to show less fractals on chart.
The simple idea how I use fractals in Binary Option is to determine temporary resistance and support.
Simple strategy:
- Mark Resistance/Support on higher time frame (e.g. 5M)
- Set an alert for new fractal
- Whenever a new fractal that appears close to your marked Resistance/Support, go to lower time frame (e.g. 1M)
- Wait for rejection at the level that lower than new down fractal (or higher than new up fractal).
- Enter with the same expiry of lower time frame.
Good luck and happy trading. :-)

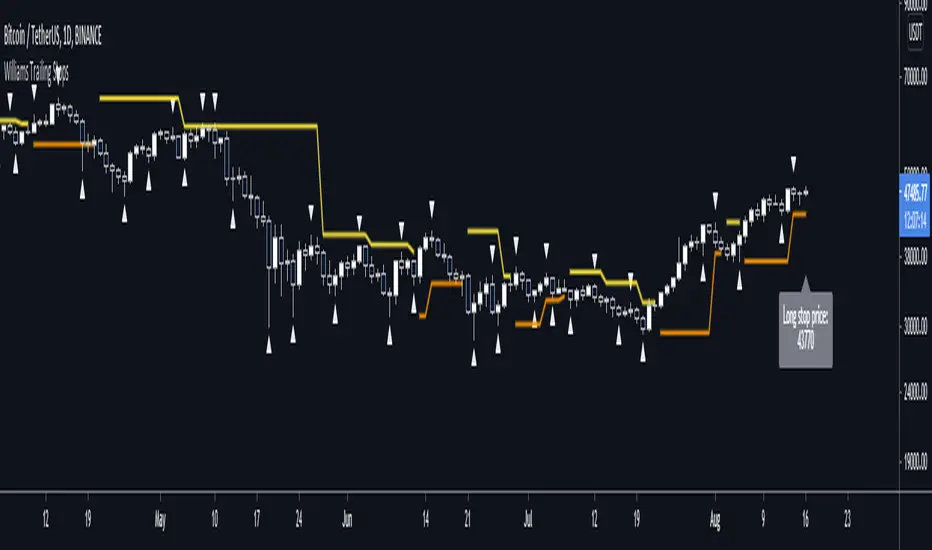
Williams Fractal Trailing StopsUnlike the built-in version, you can configure how many bars it takes to confirm a fractal. This indicator plots all Williams high and low fractals, and a stop line that trails the fractals up and down. Includes long and short stop alerts. You can choose whether the trail flips long-short based on the price being exceeded within a candle or on candle close. This indicator deals only with fractals and doesn't get into the Alligator or anything else.
I've commented it extensively, so that it might be useful for people learning Pinescript. Enjoy!
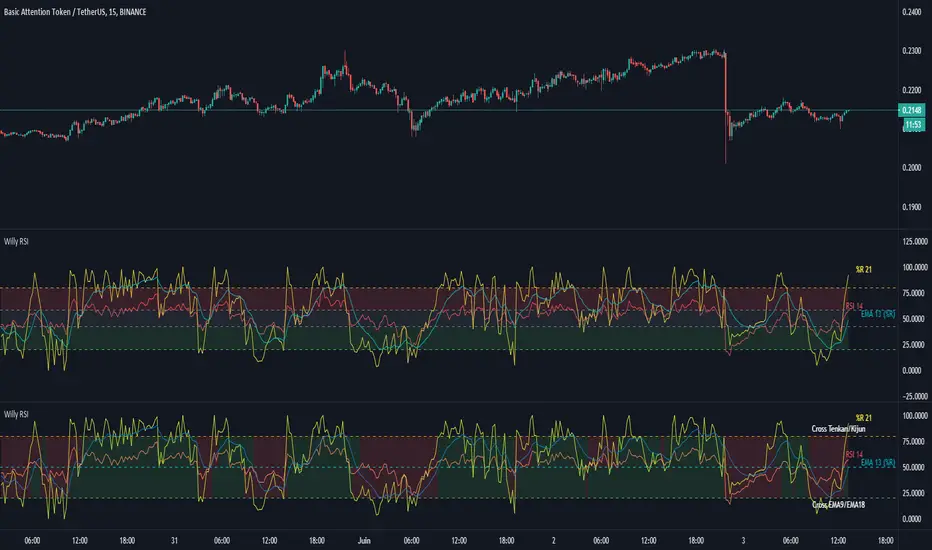
Williams %R + RSI + EMA - [Silver-Wong]
Williams %R + EMA + RSI
Un seul indicateur avec :
- William %R
- RSI
- EMA
- Une ligne médiane
- Les étiquettes des indicateurs
End-pointed SSA of Williams %R [Loxx]End-pointed SSA of Williams %R is an indicator that runes Williams %R SSA calculation through a Singular Spectrum Analysis (SSA) algorithm to derive a smoother final output. The reduction in noise from the traditional Williams %R is significant.
What is Williams %R?
Williams %R , also known as the Williams Percent Range, is a type of momentum indicator that moves between 0 and -100 and measures overbought and oversold levels. The Williams %R may be used to find entry and exit points in the market. The indicator is very similar to the Stochastic oscillator and is used in the same way. It was developed by Larry Williams and it compares a stock’s closing price to the high-low range over a specific period, typically 14 days or periods.
What is Singular Spectrum Analysis ( SSA )?
Singular spectrum analysis ( SSA ) is a technique of time series analysis and forecasting. It combines elements of classical time series analysis, multivariate statistics, multivariate geometry, dynamical systems and signal processing. SSA aims at decomposing the original series into a sum of a small number of interpretable components such as a slowly varying trend, oscillatory components and a ‘structureless’ noise. It is based on the singular value decomposition ( SVD ) of a specific matrix constructed upon the time series. Neither a parametric model nor stationarity-type conditions have to be assumed for the time series. This makes SSA a model-free method and hence enables SSA to have a very wide range of applicability.
For our purposes here, we are only concerned with the "Caterpillar" SSA . This methodology was developed in the former Soviet Union independently (the ‘iron curtain effect’) of the mainstream SSA . The main difference between the main-stream SSA and the "Caterpillar" SSA is not in the algorithmic details but rather in the assumptions and in the emphasis in the study of SSA properties. To apply the mainstream SSA , one often needs to assume some kind of stationarity of the time series and think in terms of the "signal plus noise" model (where the noise is often assumed to be ‘red’). In the "Caterpillar" SSA , the main methodological stress is on separability (of one component of the series from another one) and neither the assumption of stationarity nor the model in the form "signal plus noise" are required.
"Caterpillar" SSA
The basic "Caterpillar" SSA algorithm for analyzing one-dimensional time series consists of:
Transformation of the one-dimensional time series to the trajectory matrix by means of a delay procedure (this gives the name to the whole technique);
Singular Value Decomposition of the trajectory matrix;
Reconstruction of the original time series based on a number of selected eigenvectors.
This decomposition initializes forecasting procedures for both the original time series and its components. The method can be naturally extended to multidimensional time series and to image processing.
The method is a powerful and useful tool of time series analysis in meteorology, hydrology, geophysics, climatology and, according to our experience, in economics, biology, physics, medicine and other sciences; that is, where short and long, one-dimensional and multidimensional, stationary and non-stationary, almost deterministic and noisy time series are to be analyzed.
Included:
Bar coloring
[*Alerts
[*Signals
[*Loxx's Expanded Source Types
Related Williams %R Indicators
Williams %R on Chart w/ Dynamic Zones
Williams %R w/ Bollinger Bands
Intermediate Williams %R w/ Discontinued Signal Lines
Related SSA Indicators
End-pointed SSA of FDASMA
End-pointed SSA of Normalized Price Oscillator
Williams BBDiv Signal [trade_lexx]📈 Williams BBDiv Signal — Improve your trading strategy with accurate signals!
Introducing Williams BBDiv Signal , an advanced trading indicator designed for a comprehensive analysis of market conditions. This indicator combines Williams%R with Bollinger Bands, providing traders with a powerful tool for generating buy and sell signals, as well as detecting divergences. It is ideal for traders who need an advantage in detecting changing trends and market conditions.
🔍 How signals work
— A buy signal is generated when the Williams %R line crosses the lower Bollinger Bands band from bottom to top. This indicates that the market may be oversold and ready for a rebound. They are displayed as green triangles located under the Williams %R graph. On the main chart, buy signals are displayed as green triangles labeled "Buy" under candlesticks.
— A sell signal is generated when the Williams %R line crosses the upper Bollinger Bands band from top to bottom. This indicates that the market may be overbought and ready for a correction. They are displayed as red triangles located above the Williams %R chart. On the main chart, the sell signals are displayed as red triangles with the word "Sell" above the candlesticks.
— Minimum Bars Between Signals
The user can adjust the minimum number of bars between the signals to avoid false signals. This helps to filter out noise and improve signal quality.
— Mode "Wait for Opposite Signal"
In this mode, buy and sell signals are generated only after receiving the opposite signal. This adds an additional level of filtering and helps to avoid false alarms.
— Mode "Overbought and Oversold Zones"
A buy signal is generated only when Williams %R is below the -80 level (Lower Band). A sell signal is generated only when Williams %R is above -20 (Upper Band).
📊 Divergences
— Bullish divergence occurs when Williams%R shows a higher low while price shows a lower low. This indicates a possible upward reversal. They are displayed as green lines and labels labeled "Bull" on the Williams %R chart. On the main chart, bullish divergences are displayed as green triangles labeled "Bull" under candlesticks.
— A bearish divergence occurs when Williams %R shows a lower high, while the price shows a higher high. This indicates a possible downward reversal. They are displayed as red lines and labels labeled "Bear" on the Williams %R chart. On the main chart, bearish divergences are displayed as red triangles with the word "Bear" above the candlesticks.
— 🔌Connector Signal🔌 and 🔌Connector Divergence🔌
It allows you to connect the indicator to trading strategies and test signals throughout the trading history. This makes the indicator an even more powerful tool for traders who want to test the effectiveness of their strategies on historical data.
🔔 Alerts
The indicator provides the ability to set up alerts for buy and sell signals, as well as for divergences. This allows traders to keep abreast of important market developments without having to constantly monitor the chart.
🎨 Customizable Appearance
Customize the appearance of Williams BBDiv Signal according to your preferences to make the analysis more convenient and visually pleasing. In the indicator settings section, you can change the colors of the buy and sell signals, as well as divergences, so that they stand out on the chart and are easily visible.
🔧 How it works
— The indicator starts by calculating the Williams %R and Bollinger Bands values for a certain period to assess market conditions. Initial assumptions are introduced for overbought and oversold levels, as well as for the standard deviation of the Bollinger Bands. The indicator then analyzes these values to generate buy and sell signals. This classification helps to determine the appropriate level of volatility for signal calculation. As the market evolves, the indicator dynamically adjusts, providing information about the trend and volatility in real time.
Quick Guide to Using Williams BBDiv Signal
— Add the indicator to your favorites by clicking on the star icon. Adjust the parameters, such as the period length for Williams %R, the type of moving average and the standard deviation for Bollinger Bands, according to your trading style. Or leave all the default settings.
— Adjust the signal filters to improve the quality of the signals and avoid false alarms, adjust the filters in the "Signal Settings" section.
— Turn on alerts so that you don't miss important trading opportunities and don't constantly sit at the chart, set up alerts for buy and sell signals, as well as for divergences. This will allow you to keep abreast of all key market developments and respond to them in a timely manner, without being distracted from other business.
— Use signals. They will help you determine the optimal entry and exit points for your positions. Also, pay attention to bullish and bearish divergences, which may indicate possible market reversals and provide additional trading opportunities.
— Use the 🔌Connector🔌 for deeper analysis and verification of the effectiveness of signals, connect it to your trading strategies. This will allow you to test signals throughout the trading history and evaluate their accuracy based on historical data. Include the indicator in your trading strategy and run testing to see how buy and sell signals have worked in the past. Analyze the test results to determine how reliable the signals are and how they can improve your trading strategy. This will help you make better informed decisions and increase your trading efficiency.

Williams %R OB/OS Candle Coloring### Description for TradingView Publication
**Title:** Williams %R OB/OS Candle Coloring
**Description:**
This Pine Script indicator enhances the visibility of market conditions by changing the color of the candlesticks based on the Williams %R values. It helps traders quickly identify overbought and oversold conditions without the need to display the Williams %R line or any additional bands.
**How It Works:**
- The script calculates the Williams %R value using a specified lookback period (default is 14 days).
- It then compares the Williams %R value against predefined overbought and oversold levels.
- **Overbought Condition:** When the Williams %R value is greater than the upper band level (-20 by default), the candlestick color changes to blue.
- **Oversold Condition:** When the Williams %R value is less than the lower band level (-80 by default), the candlestick color changes to yellow.
**How to Use:**
1. **Input Parameters:**
- **Length:** The lookback period for calculating Williams %R (default is 14).
- **Upper Band Level:** The threshold for overbought conditions (default is -20).
- **Lower Band Level:** The threshold for oversold conditions (default is -80).
2. **Candlestick Coloring:**
- Blue candles indicate potential overbought conditions.
- Yellow candles indicate potential oversold conditions.
This indicator is designed to provide a visual cue directly on the price chart, making it easier for traders to spot extreme market conditions at a glance.
**Concepts Underlying the Calculation:**
Williams %R, developed by Larry Williams, is a momentum indicator that measures overbought and oversold levels. It compares the current closing price to the highest high and lowest low over a specified period. By using color-coded candles, traders can quickly assess market conditions and make informed decisions without the need to interpret an additional indicator line.
This script is particularly useful for traders who prefer a clean chart but still want to leverage the insights provided by the Williams %R indicator.
---
### ภาษาไทย:
**คำอธิบาย:**
สคริปต์ Pine Script ตัวนี้ช่วยเพิ่มการมองเห็นสภาวะตลาดโดยการเปลี่ยนสีของแท่งเทียนตามค่าของ Williams %R ช่วยให้เทรดเดอร์สามารถระบุสภาวะการซื้อเกินและขายเกินได้อย่างรวดเร็วโดยไม่ต้องแสดงเส้น Williams %R หรือเส้นระดับเพิ่มเติมใดๆ
**วิธีการทำงาน:**
- สคริปต์คำนวณค่าของ Williams %R โดยใช้ช่วงเวลาที่กำหนด (เริ่มต้นที่ 14 วัน)
- จากนั้นเปรียบเทียบค่าของ Williams %R กับระดับการซื้อเกินและขายเกินที่กำหนดไว้
- **สภาวะการซื้อเกิน:** เมื่อค่าของ Williams %R มากกว่าระดับ Upper Band (-20 เริ่มต้น) สีของแท่งเทียนจะเปลี่ยนเป็นสีน้ำเงิน
- **สภาวะการขายเกิน:** เมื่อค่าของ Williams %R น้อยกว่าระดับ Lower Band (-80 เริ่มต้น) สีของแท่งเทียนจะเปลี่ยนเป็นสีเหลือง
**วิธีการใช้งาน:**
1. **ค่าพารามิเตอร์:**
- **Length:** ช่วงเวลาที่ใช้คำนวณ Williams %R (เริ่มต้นที่ 14)
- **Upper Band Level:** ระดับการซื้อเกิน (เริ่มต้นที่ -20)
- **Lower Band Level:** ระดับการขายเกิน (เริ่มต้นที่ -80)
2. **การเปลี่ยนสีแท่งเทียน:**
- แท่งเทียนสีน้ำเงินระบุถึงสภาวะการซื้อเกิน
- แท่งเทียนสีเหลืองระบุถึงสภาวะการขายเกิน
อินดิเคเตอร์นี้ถูกออกแบบมาเพื่อให้สัญญาณภาพตรงบนกราฟราคาช่วยให้เทรดเดอร์สามารถมองเห็นสภาวะตลาดได้อย่างชัดเจนและทำการตัดสินใจได้ง่ายขึ้น
**แนวคิดที่อยู่เบื้องหลังการคำนวณ:**
Williams %R ที่พัฒนาโดย Larry Williams เป็นอินดิเคเตอร์โมเมนตัมที่วัดระดับการซื้อเกินและขายเกิน มันเปรียบเทียบราคาปิดปัจจุบันกับราคาสูงสุดและต่ำสุดในช่วงเวลาที่กำหนด โดยใช้แท่งเทียนที่มีการเปลี่ยนสี เทรดเดอร์สามารถประเมินสภาวะตลาดและทำการตัดสินใจได้อย่างรวดเร็วโดยไม่ต้องตีความเส้นอินดิเคเตอร์เพิ่มเติม
สคริปต์นี้มีประโยชน์โดยเฉพาะสำหรับเทรดเดอร์ที่ต้องการกราฟที่สะอาดแต่ยังต้องการใช้ข้อมูลเชิงลึกจากอินดิเคเตอร์ Williams %R

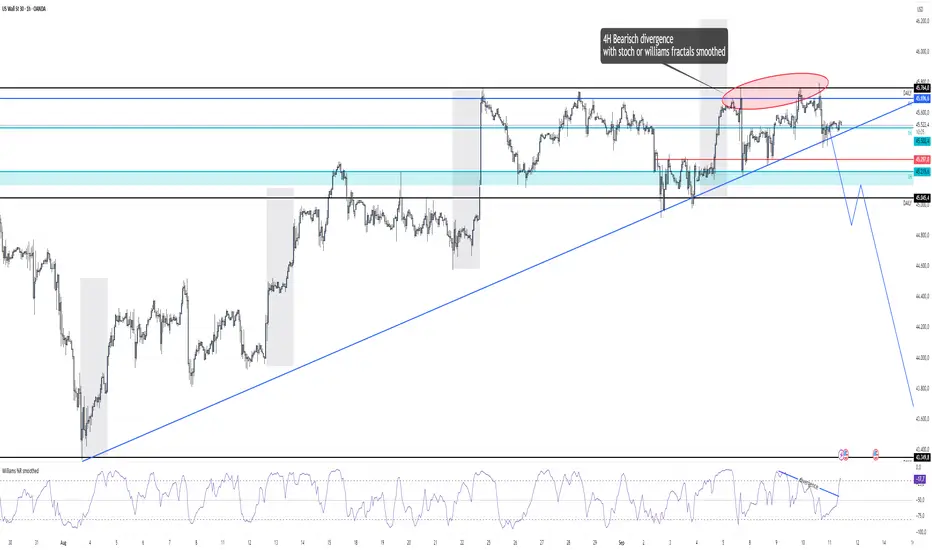
Williams %R smoothed🌍 English Description
Williams %R Smoothed – by Ján Salma
This is the first smoothed version of the Williams %R indicator published on TradingView.
The traditional Williams %R is a momentum oscillator that can be very choppy and noisy. Many traders find it hard to use because of the constant whipsaws.
This indicator solves that problem by applying an EMA smoothing on top of the raw Williams %R values.
Why is this special?
[* ]📉 Reduces noise → much cleaner signal, fewer false spikes.
🔍 Highlights real momentum shifts → easier to spot when the market truly changes direction.
🎯 Customizable smoothing → you decide how sensitive or smooth the curve should be.
⚡ Unique → currently, there is no other smoothed Williams %R available on TradingView.
Settings
Length → default 14 (standard Williams %R period).
Smoothing → default 3 EMA (smooths out the raw values).
Levels: -20 (overbought), -80 (oversold), -50 (mid-level).
This indicator is great for scalpers and swing traders who love Williams %R but hate the noise.
Now you can finally use %R with more confidence and clarity.
--------------------------------------------------------------------
Slovenský popis
Williams %R Smoothed – od Jána Salmu
Toto je prvá vyhladená verzia Williams %R indikátora publikovaná na TradingView.
Klasický Williams %R je oscilátor hybnosti, ktorý je často veľmi „roztrasený“ a plný šumu. Mnoho traderov s ním preto pracuje ťažko, pretože dáva veľa falošných signálov.
Tento indikátor to rieši tak, že na pôvodné hodnoty Williams %R aplikuje EMA vyhladenie .
Čo robí tento indikátor výnimočným?
📉 Redukuje šum → výsledná krivka je čistejšia, s menej falošnými výkyvmi.
🔍 Zvýrazňuje skutočné zmeny hybnosti → jasnejšie vidíš, kedy sa trh naozaj otáča.
🎯 Nastaviteľné vyhladenie → citlivosť indikátora si prispôsobíš podľa seba.
⚡ Unikát → na TradingView zatiaľ neexistuje žiadny iný vyhladený Williams %R.
Nastavenia
Dĺžka → predvolená hodnota 14 (štandardný Williams %R).
Smoothing (EMA) → predvolená hodnota 3 (vyhladenie krivky).
Úrovne: -20 (prekúpený trh), -80 (prepredaný trh), -50 (stredová hodnota).
Tento indikátor je skvelý pre scalperov aj swing traderov, ktorí majú radi Williams %R, ale chcú ho používať s väčšou presnosťou a prehľadnosťou.