|AG| VWAP ANALYSIS|AG| VWAP ANALYSIS
The volume-weighted average price (VWAP) is a trading benchmark used by traders that gives the average price security has traded throughout the day, based on both volume and price.
It is important because it provides traders with insight into both the trend and value of the security.
VWAP is calculated by adding up the $ traded for every transaction (price multiplied by the number of shares traded) and then dividing by the total shares traded.
A detailed formula and calculations could be found here:
-> fanf2.user.srcf.net
Actually, TradingView has an option for Anchored Vwap is a really good implementation for specific analysis.
The following script takes into account the #Time_Period_Change and plots the VWAP calculation.
The #Time_Period Available for this script are:
-> Day
-> Week
-> Monthly
-> Quarter
-> Year
1. The option that we have is the SOURCE:
-> HLC3 (High, Low, Close)/3 is the right way to calculate VWAP.
-> But I included other traditional options:
-> open, high, low, close, hl2, hlc3, ohlc4
2. The option of Turn ON/OFF VWAP
-> Timeframe selection:
-> All, 1. Day, 2. Week, 3. Month, 4. Quarter, 5. Year, 6. >=Weekly, 7. >=Montlhy
-> With this, we could select the time for plotting the VWAP. And some cool features such as >= that we are going to plot different Timeframes VWAP calculations.
-> Vwap Label:
-> We could select if show labels or not
3. The option of Turn ON/OFF Previous VWAP Level
-> VWAP of one selected Time Period is going to end with a final price this level most of the time is retested and gives us a good opportunity for entry into one trade.
Or could be used as Stop Loss.
-> Timeframe selection:
-> 1. Day, 2. Week, 3. Month, 4. Quarter, 5. Year, 6. >=Weekly, 7. >=Montlhy, 8. >=Daily
-> Factor
-> The factor options lead as increment the extension of the previous time period.
-> Example: D is the normal time period and with factor, we change from 1D to 2D in order to extend previous levels of VWAP.
->The Factor option is only available in 1. Day and 2. Week. With a Min Value of 1 and a Maximum Value of 50.
-> Labels:
-> We could select if show labels or not
4. The option of Turn ON/OFF Standard Deviation Bands
-> Label:
-> We could select if show labels or not
-> Timeframe selection:
-> 1. Day, 2. Week, 3. Month, 4. Quarter, 5. Year
5. The option of Turn ON/OFF Previous Standard Deviation
-> Timeframe selection:
-> None, 1. Day, 2. Week, 3. Month, 4. Quarter, 5. Year, 6. >=Weekly, 7. >=Montlhy, 8. Quarter & Year
-> STDEV LEVEL
-> Since there are different options for Standard Deviation I included 4 options
-> 1
-> 2
-> 3
-> User Selection
-> In this option we could select any NUMBER for STVDEV 0.25 of step.
-> Label:
-> We could select if show labels or not
6. The Lockback Setting
-> This Script also includes an option to only plot a certain amount of days back.
The main reason in order to have a more clear chart.
-> We could select between:
-> PLOT ALL
-> CUSTOM
-> If we select Custom Then we could select the Number of Days Back that is going to be plotted.
7. Color Theme
Here we select the color (Visual Desing)
-> Color Theme
-> Text Color
-> Here I use the recent input.color option added for TradingView making the color selection really simple
8. Time Period Highlighter
-> In this option, we could select one time period in order to plot one tiny background and identify the change in the time period.
-> Timeframe selection:
-> 1. Day, 2. Week, 3. Month, 4. Quarter, 5. Year
9. Label Offset
-> Finally, this option leads us to change the position of the labels into the X-axis by default 20.
This script has many options the combinations and the possibilities of making different analyses are bast.
Here some examples of what we could make:
DEFAULT SETTING:
PREVIOUS VWAP FOR TIME PERIOD >= WEEK
(work good as S&D levels)
PREVIOUS VWAP Week WITH A FACTOR OF 4
STANDARD DEVIATION BANDS - DAY
STANDARD DEVIATION BANDS - WEEK
STANDARD DEVIATION BANDS - MONTH
STANDARD DEVIATION BANDS - QUARTER
STANDARD DEVIATION BANDS - YEAR
PREVIOUS STANDARD DEVIATION - DAY SDTV 3
PREVIOUS STANDARD DEVIATION - WEEK SDTV 3
USING STANDARD DEVIATION BANDS - WEEK
WITH LOCKBACK -> PLOT ALL
WITH CUSTOM 30 DAYS
I think the options possibilities of analysis using #VWAP are truly awesome.
I like the relationship that one previous VWAP has with Standard Pivot Points.
Good Luck,
Anderson,
Pesquisar nos scripts por "weekly"

Pivot point with CPR, historical, high low and openThis script generates pivot points up to 10 level with CPR levels for Daily, Weekly, Monthly & Yearly
along with resolution for Daily, Weekly, Monthly & Yearly
along with High, low and close for that resolution
can check historical levels for the resolution as well.
the pivot auto adjusts even when you change the chart pattern to heikin ashi, renko or any other.. unlike system pivot.
change the time frame & resolution to required setting like
"Daily" & "D"
"Weekly" & "W"
"Monthly" & "M"
"Yearly" & "12M"

Gap Modified Moving AverageIdea and Motivation
I am using my Modified Moving Average indicator for a while.
I always wanted to add some more information to moving averages and made some modification to Moving averages.
The additional Information I have added to the Moving Average is How much Price difference it has when it opened current day and closed previous day.
Adding weekly average gaps information to the Moving Averages, Adding Monthly average gaps information to the Moving Averages, Adding Yearly average gaps information to the Moving Averages. It makes the moving average more Informative and Modified.
How is Gap calculated in this code?
gaps may have different meaning for different people but in this code, Gap is calculated as ,Gap=previous bar close-present bar open
Weekly average Gap is defined as Weekly average of Gaps(i.e previous bar close-present bar open) for one week
Monthly average Gap is defined as Monthly average of Gaps(i.e previous bar close-present bar open) for one month
Yearly average Gap is defined as Yearly average of Gaps(i.e previous bar close-present bar open) for one year
you can use EMA or SMA in the input
How to use this Indicator?
When the divergence of the lines occurs it indicate that the the price is going to move much faster in that particular direction.
Best Suitable for 10m, 15m only not good for any other resolution.
what does the plot shows?
Red Plot is plot for Selected Moving Average + Yearly average Gap
lime Plot is plot for Selected Moving Average + Weekly average Gap
blue Plot is plot for Selected Moving Average + Monthly average Gap
will bring More Updates if required.

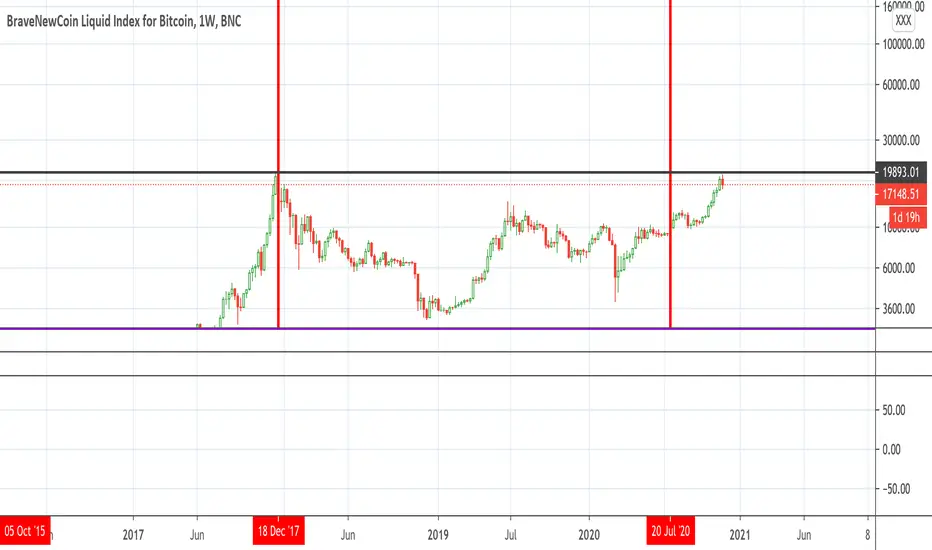
BTC risk gagueThis indicator measures the risk of buying/selling BTC at a certain price. It calculates the percentage difference between the 20 weekly SMA and price at the weekly close. This indicator is designed to be used under weekly scale.
Multi RSI based on Timeframe
This code has been inherited from " 3 RSI Multi Timeframe Inception" by pranjalchaubey and enhanced/modified to include 2 more RSI indicators. The RSIs considered are 15 minutes, 1 Hour, Daily, Weekly and Monthly displayed based on chart time frame.
The number of RSI indicators displayed is context dependant or time frame based, as below,
15min, hourly and daily RSIs are displayed on 15 mins or hourly charts, often used for Intraday trading,
Daily, Weekly and Monthly RSIs are displayed for Daily charts / Swing trading and
Weekly and Monthly RSIs for Weekly time frame / Positional trades.
RSI week/month level on daily Time frame- You can analyse the trend strength on daily time frame by looking of weekly and monthly is greater than 60.
- Divergence code is taken from tradingview's Divergence Indicator code.
#Strategy 1 : BUY ON DIPS
- This will help in identifying bullish zone of the price when RSI on DAILY, WEEKLY and Monthly is >60
-Take a trade when monthly and weekly rsi is >60 but daily RSI is less thaN 40.

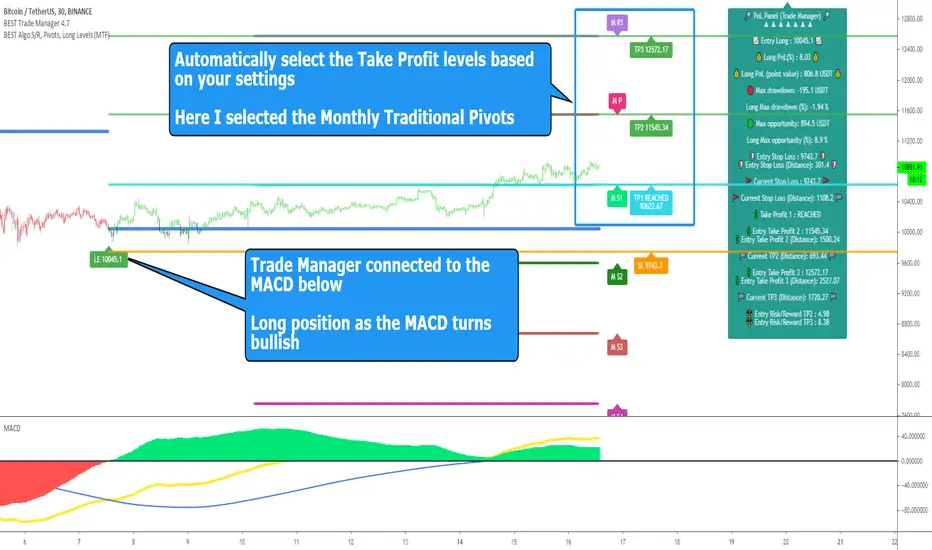
BEST Standalone Trade Manager with Automatic Take ProfitHello BEST traders
The BEST Trade Manager got upgraded with many more features
This version allows setting automatically the TP levels on either Daily/Weekly/Monthly Fibonacci/Traditional/Camarilla/Woodie pivots and Daily/Weekly/Monthly/Intraday Moving Averages
I. 💎 SCRIPTS ACCESS 💎
1. Available only with one-time payment on my website.
2. My website URL is in this script signature at the very bottom (you'll have to scroll down a bit and going past the long description) and in my profile status available here: Daveatt
3. Many video tutorials explaining clearly how all our indicators work are available on your website > guides section.
4. You may also contact me directly for more information
II. 🔎 What is the BEST Trade Manager?🔎
2.1 Concept
The BEST Trade Manager is compatible with any indicator.
Once connected, it adds another layer of good stuff with real-time user custom defined stop loss (8 available options), take profits (4 possible options) + alerts compatible for trading automation.
2.2 How hard is it to update your indicator?
We'll send to our customers, a comprehensive and easy tutorial, to make any indicator compatible.
I guarantee you, it should take no more than 2 minutes per indicator. We made it easy, fun, and awesome. #bolder #statement
III. The amazing benefits of our Plug&Play system
I hope you're ready to be impressed. Because, what I'm about to introduce, is my best-seller feature - and available across many of my indicators.
The BEST Trade manager can be connected to any external indicator
Let's assume you want to connect your RSI divergence to your Trade Manager.
I mentioned an RSI divergence but you may connect any oscillator ( MACD, On balance volume, stochastic RSI, True Strenght index, and many more..) or non-oscillatory (divergence, trendline break, higher highs/lower lows, candlesticks pattern, price action, harmonic patterns, ...) indicators.
THE SKY IS (or more likely your imagination) is the limit :)
Of course, this tool is compatible with my other indicators
We go in-depth on our website why the Plug&Play is an untapped opportunity for many traders out there - URL available on my profile status and signature
IV. 🧰 Features 🧰
Candles can be colored to highlight the trend direction better [/b [
4.1 Stop-Loss Management
For what's following, let's assume that 2 is the stop-loss value you inserted in the indicator, and the Algorithm Builder gives a BUY signal.
This is NOT a recommendation at all, only an example to explain how this feature works.
- %Trailing: The Stop-Loss starts 2% away from the entry price - and will move up (because we're on a BUY trade as per our example) every time your trade will gain 2% profit
- Pips Trailing: Same as above but using a distance in pips/USD value
- Percentage: The Stop-Loss stays static 2% away from the entry price. There is no trailing here
- TP Trailing: Trail your stop-loss every time a Take Profit level is hit
- Supertrend: embedded supertrend use as a trailing stop
- Fixed: Set the Stop-Loss at a fixed position (value should be in currency/units)
- ATR multiple: Set the Stop-loss at a multiple of ATR
- External connector: Let's say your indicator already contains embedded stop-loss levels, you can add them in the Trade Manager
4.2 Take Profits Management
You can manage up to 3 take profit levels defined as a percentage or price value or ATR multiple.
The expected input is in percentage value (for instance, setting the % target of TP1 to 2% will set the TP1 level 2% away from the entry price
This version allows setting automatically the TP levels on either Daily/Weekly/Monthly Fibonacci/Traditional/Camarilla/Woodie pivots and Daily/Weekly/Monthly/Intraday Moving Averages
4.3 Built-in Risk-to-Reward Panel with real-time analytics
The good stuff doesn't stop here.
You'll notice that this sometimes green (when in a LONG), sometimes red (when in a SHORT) panel at the right of your chart.
- Entry Price: the price when the Algorithm Builder will give a signal.
- The Trade PnL in percentage.
- Entry Stop Loss: Distance (in currency/units) between the selected stop-loss algorithm (percent, trailing, TP trailing, etc.) and the entry price.
- Entry TP1/TP2/TP3: Distance (in currency/units) between the entry price and the first take profit
- Risk/Reward TP1/TP2/TP3: Using the Stop-loss distance at entry, and Take Profit 1/2/3 at the entry to compute the risk-to-reward ratio.
- Max drawdown and Max opportunity (value and percentage): respectively the maximum loss and maximum win per trade
For more details, please check the guides section of my website. Links are in my signature and profile status.
V. 🔔 Alerts 🔔
We enabled the alerts on the:
1. Stop-Loss hit
2. Take Profit 1/2/3 hit
3. custom hard exits based on either MACD / RSI divergence/ MM cross
5.1 🤖 Compatible with trading bots? 🤖
It's compatible with all third-parties out there capturing alerts and forwarding them to the brokers.
We enabled TradingConnector and ProfitView alert templates so far.
If you have any doubts or questions, please hit me up directly or ask in the comments section of this script.
BEST regards,
Dave
TBS - Trend Buy and Sell IndicatorTrend Buy and Sell Indicator
TBS identifies trend based on price cross-over/cross-under to a moving average. Confirmed Up-trend is displayed in green and Down-trend in red backgrounds. Before a trend is confirmed price cross-over is displayed in blue and cross-under in orange backgrounds. Once an uptrend is confirmed, TBS suggest buys based on touch downs to a Support moving average by a green arrow under the candle . A sell is suggested by TBS by a red arrow on top of the candle when the price reaches a certain percentage above support moving average. Motivation and Tolerance levels are provided to fine tune buying and selling signals.
Example : Default settings for BTC Weekly charts are Trend Moving Average = 50, Support Moving Average = 21, Motivation Buy = 10, Tolerance Buy = 5, Motivation Sell = 50 and Tolerance Sell = 90. That means in uptrend identified by green background every time the closing price touches 10% higher than 21 week moving average value TBS suggests buy, so a trader can choose to buy 80% of intended position at this level. If the price continues to drop down and touches 5% below 21 week moving average, a trader may choose to buy another 20% at this level. In the likely scenarios of price hike from here a trader may choose to sell 80% at the Motivation Sell level 50% higher than 21 week moving average. If the price reaches Tolerance Sell level at 90% higher than 21 week moving average a trader may choose to sell remaining 20% of the position.
Note 1 : TBS suggest Buys and sells but the execution of buy and sell is up to trader's discretion for example using Stop Buy order or Limit Buy order etc.
Note 2 : TBS is designed to be a medium to long term indicator for example weekly and monthly timescales. Traders might find it useful on shorter term time-frames but its not designed for short term time frame in mind.
Note 3 : Most of the parameters in TBS indicator are configurable as Trend Moving Average and Support Moving Average vary significantly across assets. Default parameters are set for Bitcoin Weekly time frame. Traders should play around with parameters to find best fit for Trend Moving Average and Support Moving Average for the asset of interest. For example TBS is very relevant and useful for Gold Weekly time frame with Trend Moving Average = 100, Support Moving Average = 30, Motivation Buy = 1, Tolerance Buy = 0, Motivation Sell = 11 and Tolerance Sell = 20.

Static + Dynamic LevelsShows static and dynamic levels which can act as support/resistance. These are important as there is a lot of users who are interested in buying/selling at these prices.
Static Levels include -
Daily/Weekly/Monthly/Yearly Open (changes color depending on if below or above price)
Previous Daily/Weekly/Monthly/Yearly Open
Previous day's High/Low
Dynamic Levels include -
100/200 Daily MA
100/200 Weekly MA

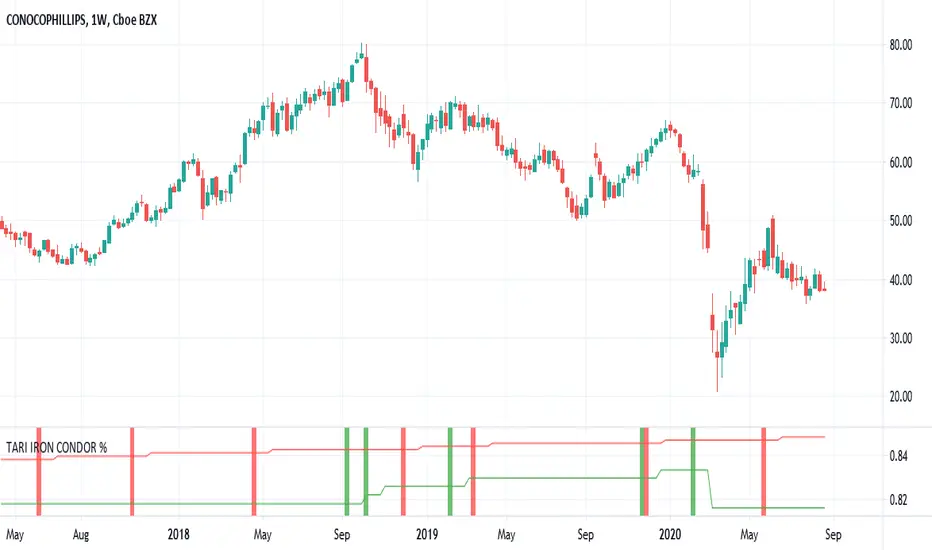
TARI IRON CONDOR %Hi guys!
I give here some details about my new script.
It's a script to find the best opportunity to trade options, sotcks, etf, index, an ocean of securities!
It works it's best on Weekly time frame, and that's how I use it.
There are only 2 settings to do before to dive into the market:
Period: it means how many candles you want to trade before expiration.
Strike: it's where to sell the put and the call, as % of actual price.
It's easier to get it reading about my routine:
Monday morning I open the Weekly chart, I set "period" to match it with next expiring day (if next regular expires in 2 weeks I set period=2, if I prefer to trade a weekly option I can set "period=1"), and I set a Strike. "Strike" 10% means that the short legs must be placed +/-10% from Monday opening price ( we call this price just opening price). If Monday open is 100$ (opening price is 100), and I choose 7%Strike, the short put must be placed @ 93$, the short call @107$.
On the script you can find a green or a red histogram, when it appears it means that there is a good edge to trade iron condor.
On the right side of the indicator you will see the success rate for green and red signal. You can play with Strike to find the better odds, for exemple: XYZ with 10% strike gives 88% success ( so reward / risk ratio is (100-88)/88=12/88= 0.14), and all the trades that gives you by your broker platform a succes rate lower than 88% (that means RR higer than 0.14), is good for us!
So basically we know for each strike and each expiring date, on a given security, our odds by TARI CONDOR, we know our Reward / Risk ratio, and when the market pays more than what we see by the strategy, we have an edge.
If I find a good opportunity I jump on my broker platform and place an order. It's not always possible to find a decent RR, in thoese cases I place a pending order, so maybe after a few days it can be executed as the price moves closer to the wings. But we trade only if we have a real edge! I trade about 10 iron condors in a week.
Once the order has been executed it's time to manage the position, the rules are the basic rules for iron condor: if one candle cloes at the end of the week over one long strike we roll ( up the puts and down the calls) the side that is still in profit, until around the opening price, to collet more credit, raising our RR. If one spread is deep ITM we can close that side, lowering our max loss.
That's it. I will publish my trades over the next days, to better understand the power of this script.
By TARI CONDOR we can trade almost everityhing with options, having a good edge on our side, plus all the benefit in trading options instead trading stocks or etf (levarage is the most important).
Subscribe and Enjoy your wallet!
Tari
PP Dynamic ZonesNSE:BANKNIFTY
So I Came Across the Dynamic Zones Trading System for 20K INR along with Basic course for stock market.
So I decided to Code it. This is only Version 1, I would like this system available for all and also would like to protect the source code for my study purpose and to enhance further versions with Many features like CPR, Automatic Support and resistance area,
Price action range during Market hours and some plans for Version 2 of the indicator for the Trading Community, and I ask for your feedback on anything you find.
What is Dynamic Zones?
Dynamic Zones are nothing but Support and Resistance Zones Calculated from the range of opening price and Close price for past 10 days.
How it will be useful in charts and What time Frame?
Dynamic Zone can be used in all time frame , it will act as support and resistance.
Daily Zone
Wider the Daily zone wider the resistance or support. if Daily Zone are narrow then most of the time it will be trending Day.
Weekly Zone
Weekly Zone is stronger than Daily , When Daily and Weekly Zone overlap Stronger the resistance or Support.
Monthly Zone
Monthly Zone is used when we are working on Swing Trading setup on a Daily Chart than intraday Chart.
Hope you all enjoy this system and get benefited.

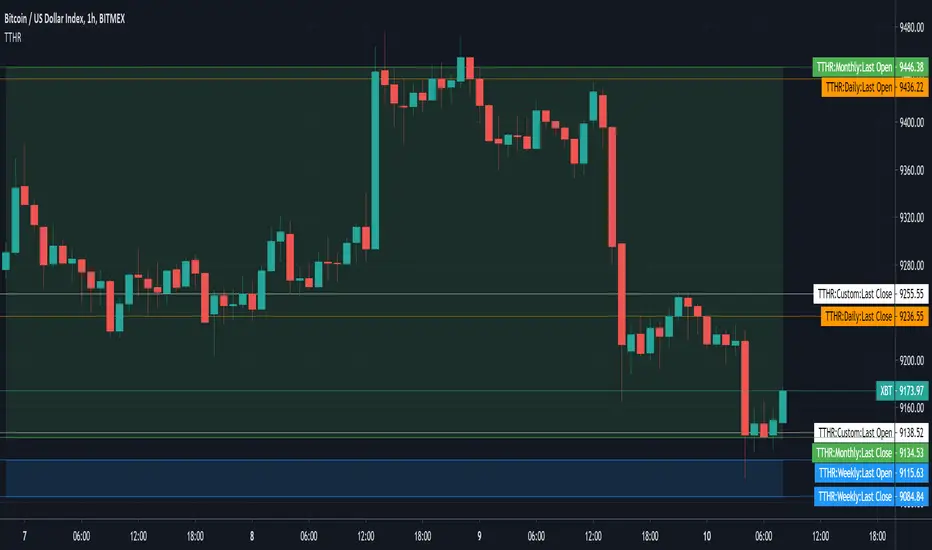
TT Historical RangesBeta - Ongoing Updates
Used to overlay the Open and Close prices and trading range for Last Daily, Weekly and Monthly Candle on your own charts and timeframes.
In the example shown
the green area is showing the last Monthly Candle open and close range
the blue area at the bottom is showing the last Weekly Candle open and close range
the remaining horizontal are for the last Daily Candle (orange lines) and the User Selected Candle of 3 Days (white lines).
NOTE: the labels next to the scale for each price line are only visible if you turn on indicator labels in the scale settings .
Indicator Settings - Daily, Weekly, Monthly and User Selected plots have their own display and style options.
enable or disable last open price line
enable or disable last close price line
enable or disable historical trading range (fill between open/close)
select and your own preferred time frame to display
NOTE: used for my own educational purposes and is not fit for trading advice or strategies.
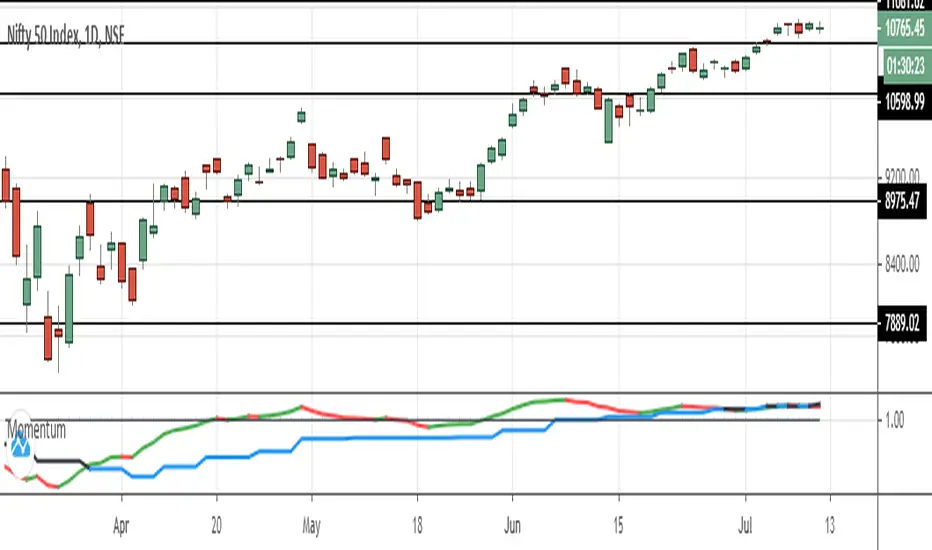
Momentum_GalluThis plots the ratio of 5EMA to 21EMA on current timeframe basis and compares this with plot of the ratio of weekly 4EMA to Weekly 12 EMA
This is in attempt to find if recent momentum beats weekly momentum
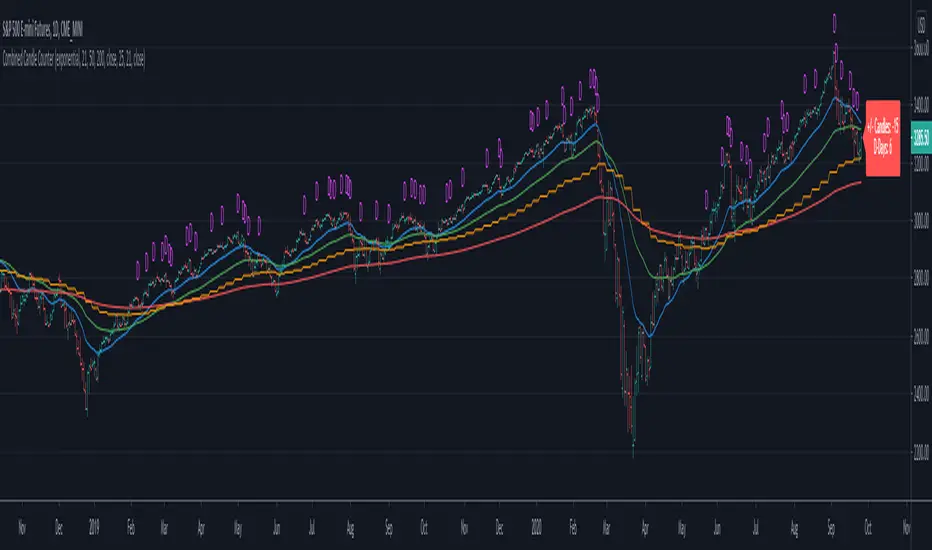
Combined Candle CounterThis script combines multiple indicators and count their results in a label
- Shows the weekly moving average in a daily chart
- Count the days where the underlying is above & below the moving average and shows the figure in a label
- Shows & Count Distribution days in relation to the weekly moving average
- Daily / Weekly Moving Averages can be configured (length, type, reference)
CPR with SMA, EMA, VWAP & Super Trend by GuruprasadMeduriThis script will allow to add CPR with Standard Pivots and 4 Indicators.
Standard Pivot has 9 levels of support and 9 levels of resistance lines. It has CPR , 3 levels of Day-wise pivots , 3 levels of Weekly pivots and 3 Levels of Monthly Pivots .
In Addition to the CPR and Pivot, this script will allow user to Add 4 more Indicators - SMA, EMA, VWAP and SuperTrend as well.
All the Support and resistance levels can be enabled / disabled from settings. It will allow to select multiple combinations of support and resistance levels across 3 levels at any of the 3 time-frames individually and combined.
All 4 Indicators can be can be enabled / disabled from settings. This will allow the indicators to be plotted individually and combined along with any combination of CPR & Pivots.
These number of combinations will allow user to visualize the charts with desired indicators, pivot support & resistance levels on all or any of the 3 time frames.
For Ease of access, listed few points on how the script works..
- CPR and day-wise level 1 & 2 (S1 & R1) enabled by default and can be changed from settings
- Day-wise Level 2 & 3 (S2, R2, S3 & L3) can be enabled from settings
- Weekly 3 levels and Monthly 3 levels can be enabled from settings
- CPR & pivot levels colored in blue lines
- All support levels colored in Green
- All resistance levels Colored in Red
- Day-wise pivot , support & resistance are straight lines
- Weekly pivot , support & resistance are cross (+) lines
- Weekly pivot , support & resistance are circle (o) lines
- SMA, EMA, VWAP and SuperTrend Enabled by Default
- SMA Colored in Orange
- EMA Colored in Red
- EMA Colored in Teal
- SuperTrend Colored in standard Red & Green with triangle arrows
- Any combinations can be selected from settings-> Inputs & style

Elder Impulse SnapshotNASDAQ:AMZN
I've always been intrigued by the Elder Impulse System but found it labour intensive with its flipping back and forth between daily and weekly charts. I also wasn't fond of the way it repainted the candlesticks. So I set out to build a version where you could get every trade signal filtered down in one chart and still see the real price action.
This article provides a decent overview of the original system: www.investopedia.com
Elder Impulse Snapshot uses two EMAs and two MACDs, one of each to process both the daily and weekly data. The daily data gets an EMA of 13 periods and the standard MACD settings. For the weekly info, the EMA is set to 65 periods and all the MACD values are also multiplied by five (60, 130, 45). Buy signals are generated when both EMAs and both MACD histograms are rising. When all four of these elements are falling, sell signals are generated. If any of the indicators disagree, no signal is generated and entering any trade is not advised.
The blue and red arrows are the buy and sell signals. From my reading, it appears Dr. Elder recommended exiting the trade as soon as the system no longer generated a signal, though the case could be made for taking partial profit and moving up your stop loss to ride the trend out longer provided you haven't been stopped out yet.
