Dynamic Elliott Wave By Lucky-CBTIndicator overview
Dynamic Elliott Wave v5 detects and visually labels single-degree Elliott impulse (1–5) and corrective (A–B–C) structures using robust pivot detection and optional Fibonacci validation. It’s designed as a mechanical, configurable helper to identify clear wave structures across timeframes and instruments — useful as a structural guide for analysis and strategy development.
Key features
Mechanical pivot detection (zigzag-style) evaluated on confirmed bars for stability
Automatic detection and persistent drawing of 1–5 impulse and A–B–C corrective structures
Optional Fibonacci-based validation for Wave 2 / Wave 4 retracements with tolerance control
Configurable pivot lookback and minimum move threshold to reduce noise on different timeframes
Visuals: colored lines and labels for impulses (1–5) and corrections (A–B–C)
Lightweight memory use with bounded pivot storage and safe redraw logic
How it works (short)
Detects pivot highs/lows using ta.highestbars / ta.lowestbars over a user-set lookback
Builds candidate 5-pivot sequences and validates alternation, magnitude, and optional Fibonacci relationships
When a valid impulse is found the script stores and draws the 1–5 chain; if a following 3-pivot corrective is found it stores and draws A–B–C
Visuals persist until a new validated structure replaces them so charts remain readable
Inputs and recommended settings
Pivot lookback (bars): controls sensitivity. Lower for faster markets / lower TF (e.g., 3–7), higher for slow markets / higher TF (e.g., 10–30).
Min move size (%): filters tiny swings. Start ~0.5% for volatile symbols, 0.1–0.3% for large-cap equities on daily.
Use Fibonacci checks: on/off. Turn on to enforce common retrace rules; turn off if you prefer looser mechanical counts.
Fibonacci tolerance: widen for noisy markets, tighten for strict validation.
Show lines / Show labels: toggle visuals to reduce clutter.
Practical notes and limitations
Elliott Wave counting remains partly subjective; this script provides a consistent mechanical count, but it will not match every manual analysis. Use as a guide, not a final trading signal.
The script detects single-degree structures only. For nested multi-degree analysis, consider adding recursive detection layers or complementing with manual degree assignment.
Requires sufficient chart history (max_bars_back) to retain older pivots when reviewing long-term structures. Increase max_bars_back if needed.
Test and tune pivot_len and min_move_pct for your instrument and timeframe before relying on counts in live trading.
Change log (high level)
v1.0 — Initial release: mechanical pivot detection, impulse 1–5 and corrective A–B–C detection, persistent visuals, Fibonacci validation.
Future: planned options for ATR-based pivots, multi-degree nesting, manual clear/aging controls, and degree coloring.
Disclaimer
This indicator is provided for educational and analytical purposes only. It does not provide financial, investment, or trading advice. Always combine structural analysis with risk management and validate any strategy on historical data before trading live.
If you want, I can produce: (1) a shorter “one-sentence” blurb for the publish header, (2) example default settings for specific markets (BTC, Nifty, Forex), or (3) release notes formatted for TradingView — tell me which.
Pesquisar nos scripts por "wave"

RC: Optimist Wave 3.6.7Raikar Capital introduces : The Optimist WAVE indicator for TradingView is a dynamic tool designed to help traders analyze market cycles, trends, and price movements while providing clear BUY and SELL signals. Rooted in WAVE theory, this indicator visualizes the natural rhythm of the market, highlighting key areas of support, resistance, trend reversals, and momentum shifts. Integrated with TradingView's advanced charting platform, the Optimist WAVE indicator not only identifies potential entry and exit points but also generates real-time BUY and SELL signals to assist traders in making informed decisions. Whether you're a day trader seeking quick opportunities or a long-term investor tracking broader trends, this tool offers an intuitive approach to enhancing your trading strategy and boosting accuracy.

VMMA Wave Edges [MTF]The VMMA Wave Edges is a multi-timeframe (MTF) overlay indicator that plots dynamic upper and lower edges formed by a band of Volume-Weighted Moving Averages (VWMAs) of varying lengths. It computes N VWMAs with lengths increasing arithmetically from start_len by incr, then plots:The maximum of all VWMAs → Upper Edge
The minimum of all VWMAs → Lower Edge
These edges are calculated on a higher timeframe (mtf_tf) and projected onto the current chart, creating a smooth, volume-sensitive envelope that adapts to volatility and trend strength.Use & InterpretationFeature
Purpose
Upper Edge
Dynamic resistance zone; price often reacts when approaching or breaking above.
Lower Edge
Dynamic support zone; price tends to bounce or consolidate near it.
Edge Contraction
Low volatility → potential breakout setup.
Edge Expansion
High volatility → trend continuation or exhaustion.
MTF Projection
Avoids repainting & noise by using cleaner higher-timeframe data.
Trading ApplicationsMean ReversionBuy near Lower Edge, sell near Upper Edge (especially in ranging markets).
Breakout ConfirmationPrice closing above Upper Edge on MTF → bullish breakout.
Below Lower Edge → bearish.
Trend FilterIn uptrend: price above Upper Edge → strong momentum.
In downtrend: price below Lower Edge → strong bearish control.
Support/Resistance FlipBroken Upper Edge → becomes future support (and vice versa).

Wave Rider [BreakoutOrFakeout]Wave Rider
What It Does
Creates an ultra-smooth trend wave that flows through price action, instantly revealing market direction and momentum strength through elegant visual design. The wave dynamically adapts its color intensity based on trend strength, making it easy to spot high-probability trading opportunities.
Key Features
🌊 Silky Smooth Wave
Double-smoothed calculation eliminates noise
Flows naturally through price action
Adjustable period and smoothing levels
🎨 Dynamic Color Flow
Bright colors = Strong momentum
Faded colors = Weakening trend
Smooth transitions show trend evolution
📊 Optional Ribbon Depth
1-5 translucent layers create visual depth
Shows trend consistency across periods
Beautiful flowing water effect
⚡ Smart Signals
Yellow dots mark potential turning points
Price/wave crossovers for entries
Wave angle analysis (flat/rising/steep)
✨ Clean Design
Minimal chart clutter
Optional candle coloring
Adjustable visual elements
How to Use
Trend Following: Trade in direction of wave color (green up, red down)
Entry Timing: Enter when price crosses above/below wave with momentum
Exit Signals: Watch for yellow dots indicating potential reversals
Momentum Gauge: Bright colors = stay in trade, fading = consider exit
Visual Guide
🟢 Green Wave = Uptrend (brighter = stronger)
🔴 Red Wave = Downtrend (brighter = stronger)
🔵 Blue Wave = Neutral/consolidating
🟡 Yellow Dots = Potential turning points
🌊 Ribbon = Multi-layer trend visualization
Settings
Core
Wave Period (5-50): Main trend sensitivity
Extra Smoothing (1-10): Additional noise reduction
Wave Offset: Shift wave forward/backward
Visual
Toggle wave, ribbon, signals, candle coloring
Adjust thickness, layers, transparency
Why Wave Rider?
Unlike choppy indicators that whipsaw in volatile markets, Wave Rider's double-smoothing creates a flowing trend line that filters out noise while remaining responsive to real moves. The visual design makes trend strength obvious at a glance - no interpretation needed.
Perfect for:
Trend traders wanting clear directional bias
Scalpers needing smooth entry/exit levels
Beginners learning trend-following concepts
Anyone wanting cleaner, more aesthetic charts
Trading Tips
✅ Best in trending markets - ride the wave
✅ Combine with volume for confirmation
✅ Use multiple timeframes for context
✅ Bright colors = high confidence signals
✅ Let the wave guide position sizing
⚠️ DISCLAIMER: For educational purposes only. Trading involves substantial risk of loss. Past performance does not guarantee future results. Always use proper risk management and never risk more than you can afford to lose.
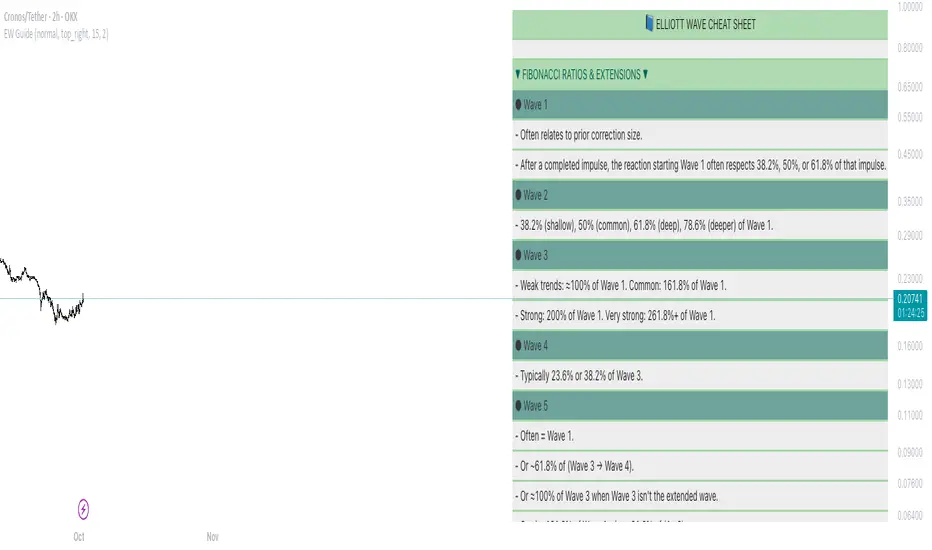
Elliot Wave Cheat SheetThis tool provides a visual cheat sheet summarizing:
Core Impulse Wave Rules
Essential Fibonacci Ratios & Guidelines
Leading and Ending Diagonals
Expanding and Contractive Diagonals
Common Corrective Patterns (Zigzag, Flats, Triangles, WXY)
Key Best Practices & Mistakes to Avoid
You can customize:
Font Size & Color
Background Color & Transparency
Show/Hide individual sections (Rules, Ratios, Corrections, etc.)
Elliott Wave Probability System Pro v2🎯 Major Improvements Made to Elliott Wave Script
Key Changes:
1. Advanced Trend Detection (Lines 55-82)
Uses 5 different methods to determine trend over last 75 bars:
Price position in range
Linear regression slope
Moving average alignment
Higher highs/lows pattern
Up vs down bar count
Combines all methods into a trendScore for accurate direction
2. Adaptive Target Direction
New input: adaptiveTargets (line 28) - can toggle on/off
When ON: Targets follow the 75-bar trend regardless of short-term indicators
When OFF: Works like original (based on current momentum)
3. Improved Target Calculation
Bullish targets use extensions from current price to recent high
Bearish targets use retracements from current price to recent low
More realistic price levels based on actual market structure
4. Enhanced Status Display
Added "Trend (75 bars)" row showing BULLISH/BEARISH/NEUTRAL
Helps you see why targets are pointing a certain direction
5. Better Probability Calculation
Base probability adjusts with trend strength (70% if strong trend, 50% if not)
Gradual probability decay with distance
Minimum 15% probability (more realistic than 10%)
New Features:
Trend-Based Alerts
Alerts when 75-bar trend changes from bullish to bearish (or vice versa)
Trend Weight in Scoring
Added trendWeight to the total score calculation
Makes signals more aligned with larger trend
Visual Improvements
Projection lines now show at 40% probability (was 50%)
Better visibility of likely targets
How It Works Now:
If last 75 bars show a downtrend , targets will be bearish (even if RSI is oversold)
If last 75 bars show an uptrend , targets will be bullish (even if RSI is overbought)
The probability adjusts based on trend strength
This solves the issue where the script was showing bullish targets in a clear downtrend. Now it properly reflects the dominant trend direction while still considering short-term indicators for probability calculations.

Fractal Wave MarkerFractal Wave Marker is an indicator that processes relative extremes of fluctuating prices within 2 periodical aspects. The special labeling system detects and visually marks multi-scale turning points, letting you visualize fractal echoes within unfolding cycles dynamically.
What This Indicator Does
Identifies major and minor swing highs/lows based on adjustable period.
Uses Phi in power exponent to compute a higher-degree swing filter.
Labels of higher degree appear only after confirmed base swings — no phantom levels, no hindsight bias. What you see is what the market has validated.
Swing points unfold in a structured, alternating rhythm . No two consecutive pivots share the same hierarchical degree!
Inspired by the Fractal Market Hypothesis, this script visualizes the principle that market behavior repeats across time scales, revealing structured narrative of "random walk". This inherent sequencing ensures fractal consistency across timeframes. "Fractal echoes" demonstrate how smaller price swings can proportionally mirror larger ones in both structure and timing, allowing traders to anticipate movements by recursive patterns. Cycle Transitions highlight critical inflection points where minor pivots flip polarity such as a series of lower highs progress into higher highs—signaling the birth of a new macro trend. A dense dense clusters of swing points can indicate Liquidity Zones, acting as footprints of institutional accumulation or distribution where price action validates supply and demand imbalances.
Visualization of nested cycles within macro trend anchors - a main feature specifically designed for the chartists who prioritize working with complex wave oscillations their analysis.

Wave N + KDJ + Volumi + SMC + IchimokuWave N + KDJ + Volume + SMC + Ichimoku Indicator
Overview
This script is a multi-layered technical indicator designed to provide traders with enhanced market insights by combining five key methodologies:
• Wave N Pattern (Price Action)
• KDJ Oscillator (Momentum)
• Volume Filtering (Confirmation)
• Smart Money Concepts (Order Blocks) (Institutional Activity)
• Ichimoku Cloud (Trend and Support/Resistance)
By integrating these components, the indicator identifies high-probability trading signals, early warnings of trend shifts, and institutional price zones to improve decision-making in volatile markets.
⸻
How It Works
1️⃣ Wave N Pattern (Price Action Structure)
The Wave N pattern is a classic price action formation that helps spot potential trend reversals and continuations:
• A Bullish Wave N is detected when a higher low and a higher high structure appears.
• A Bearish Wave N is detected when a lower high and a lower low structure forms.
2️⃣ KDJ Oscillator (Momentum & Trend Strength)
The KDJ Indicator is a variation of the Stochastic Oscillator that adds a third line, J, to amplify sensitivity to trend movements.
• J > 50 indicates bullish momentum.
• J < 50 indicates bearish momentum.
• The script includes an early warning signal when J crosses 50, suggesting a possible trend shift.
3️⃣ Volume Filtering (Trade Confirmation)
To avoid false signals, the script integrates volume confirmation:
• A signal is valid only if the volume is above the 20-period EMA of volume.
• This ensures that trade signals are supported by strong market participation.
4️⃣ Smart Money Concepts (Order Blocks)
Order Blocks represent areas of institutional interest, where large traders accumulate or distribute positions.
• The script detects bullish order blocks (potential support) and bearish order blocks (potential resistance).
• These areas help identify optimal entry and exit points.
5️⃣ Ichimoku Cloud (Trend & Dynamic Support/Resistance)
The Ichimoku Cloud is used to confirm trend direction:
• Baseline (Kijun-sen) acts as a key trend filter.
• Senkou Span A & B form the cloud (Kumo), indicating dynamic support/resistance.
• Buy signals require price to be above the baseline, while sell signals require price to be below the baseline.
⸻
Trading Signals & Visual Elements
✅ BUY Signal (Green Arrow)
Occurs when:
• A Bullish Wave N forms
• J > 50 (Bullish KDJ Signal)
• Volume is above EMA threshold
• Price is above the Ichimoku Baseline
❌ SELL Signal (Red Arrow)
Occurs when:
• A Bearish Wave N forms
• J < 50 (Bearish KDJ Signal)
• Volume is above EMA threshold
• Price is below the Ichimoku Baseline
⚠️ Early Warning (Trend Shift Signal)
• An early warning appears when J crosses 50, indicating a possible upcoming trend shift.
• The line color changes based on the potential move:
• Green/Blue → Possible Uptrend
• Red/Orange → Possible Downtrend
⸻
Why This Indicator is Unique?
Unlike simple trend-following indicators, this script:
• Combines Price Action, Momentum, Volume, and Institutional Order Flow for a multi-dimensional approach.
• Filters out weak signals using volume confirmation and Ichimoku.
• Provides early warnings before major trend shifts.
• Visualizes Smart Money Order Blocks, giving traders an edge in spotting institutional zones.
⸻
Best Timeframes & Markets
📊 Recommended Timeframes:
• 1H & 1D (works best on medium/long-term trends)
💹 Markets:
• Crypto, Forex, and Stocks
This indicator is designed for traders who value confluence and strong confirmation in their strategies. Whether you are a trend trader, swing trader, or institutional flow analyst, this tool can help refine your decision-making process.
🚀 Optimize your trades with Wave N + KDJ + Volume + SMC + Ichimoku! 🚀

Wave Trend -V2Wave Trend -V2 is here to give you a serious edge.
This upgraded version of the popular LazyBear script takes wave trend analysis to the next level.
Here's the deal:
Multi-Timeframe Analysis: Beyond Short-Term Noise:
Novice traders often focus solely on the current timeframe (let's say, the 5-minute chart).
Wave Trend -V2 breaks free from this limitation by analyzing price action across multiple timeframes (1-minute to 1-week).
---This holistic view helps you:
Identify larger trends: Are we in a bullish uptrend on the daily chart, even if the hourly chart is showing some short-term weakness? Wave Trend -V2 helps you see the bigger picture.
Avoid false breakouts: Short-term price spikes can create false signals. By looking at higher timeframes, you can filter out these "noise" and focus on sustainable trends.
---Pressure Analysis: Gauging Market Strength:
Wave Trend -V2 goes beyond simple trend identification.
It incorporates "pressure" analysis to gauge the strength and direction of the current market trend.
This helps you:
Enter trades with confidence: When the trend is strong and the pressure is high, you can enter trades with greater conviction.
Minimize risk: If the pressure is waning or conflicting signals arise, you can avoid entering trades or adjust your risk parameters accordingly.
Impact Point Analysis: Predicting Future Price Moves:
Wave Trend -V2 analyzes the price impact of the last four wave trend crossovers.
Let's say the last impact point was "X", the previous one "X-1", the one before that "X-2", and so on.
The indicator calculates the average price movement between these points using the following simplified formula:
Average Impact = (X - X-1) + (X-1 - X-2) + (X-2 - X-3) / 3
This average provides a valuable estimate of the potential price movement of the next crossover.
Multiple Take Profit Levels: Setting Strategic Targets:
Wave Trend -V2 offers three dynamic take profit levels (TP1, TP2, TP3).
TP1: Based on the estimated average impact.
TP2: Twice the estimated average impact.
TP3: Three times the estimated average impact.
This allows you to set your profit targets strategically, maximizing potential gains while managing risk effectively.
Why don't use the Estmated impact point to stop the trade?
In order to eliminated the WHIPSAW effect! There is no other way...
Wave Trend -V2 is designed for traders who seek a deeper understanding of trend dynamics and desire a more sophisticated approach to trading. By combining multi-timeframe analysis, pressure assessment, and advanced impact point calculations, this indicator empowers you to make more informed trading decisions and potentially improve your trading outcomes.
The indicator work best with combination of other trend type indicators.
Please dont forget that indicators are not miracle medicines , it cannot give you exact results , market was always volative , use at your own discretion.
Jason's Simple Moving Averages WaveUnderstanding the Script:
Purpose: This script identifies potential trend direction and momentum using a moving average and wave amplitude calculation. It shows a green line when the price is trending upwards and a red line when trending downwards.
Strategy: This script doesn't provide a complete trading strategy. It's an indicator designed to be used alongside other tools.
Parameters: You can adjust the "Moving Average Length" input to change the sensitivity of the indicator. A shorter length will react quicker to price changes, while a longer length will be smoother but less responsive.
How to Use it:
Load the Script: In TradingView, navigate to the indicator creation section and paste the provided script code.
Adjust Parameters: Set the "Moving Average Length" based on your preferred timeframe and trading style.
Combine with Other Tools: Use the indicator along with other technical indicators or price action analysis to confirm potential entry and exit points for trades.
Here are some additional points to consider:
Crossovers: You could look for buy signals when the price crosses above the green line and sell signals when it crosses below the red line. However, these can be prone to false signals.
Divergence: Look for divergences between the price movement and the wave indicator. For example, a rising price with a falling wave could indicate overbought conditions and a potential reversal.
Confirmation: Don't rely solely on this indicator. Use it alongside other confirmations from price action, volume analysis, or other indicators to identify higher probability trades.
Important Note:

Dynamic Sine Wave The Dynamic Sine Wave is designed to calculate a sine wave that reflects the oscillations between the highest high and lowest low points over a specified period, providing traders with a unique perspective on market trends.
Why a Sine Wave is Relevant:
A sine wave is relevant in this context because it is a mathematical function that represents periodic oscillations, making it suitable for capturing the cyclic nature of price movements in financial markets.
By using a sine wave, this indicator highlights the repetitive patterns of price highs and lows over a specified period, which can assist traders in identifying potential trend reversals or continuations.
The sine wave's amplitude and frequency are adjusted based on the highest high and lowest low points, ensuring that it adapts to market volatility and provides a dynamic representation of price action.
Overall, the "Dynamic Sine Wave" indicator offers a unique perspective on market dynamics, helping traders make informed decisions by visualizing the ebb and flow of prices.

Elliott Wave 3 FinderThis script will attempt to find the location of the third wave in the Elliot Wave Theory. The bars will become highlighted when possible wave 3 criteria is met. Multiple bars in a row may have a painted background. The point at which the bars are no longer painted will potentially be at or near the end of wave 3.
The background paints a baby blue for wave 3s in an overall uptrend, and pink for downtrends.

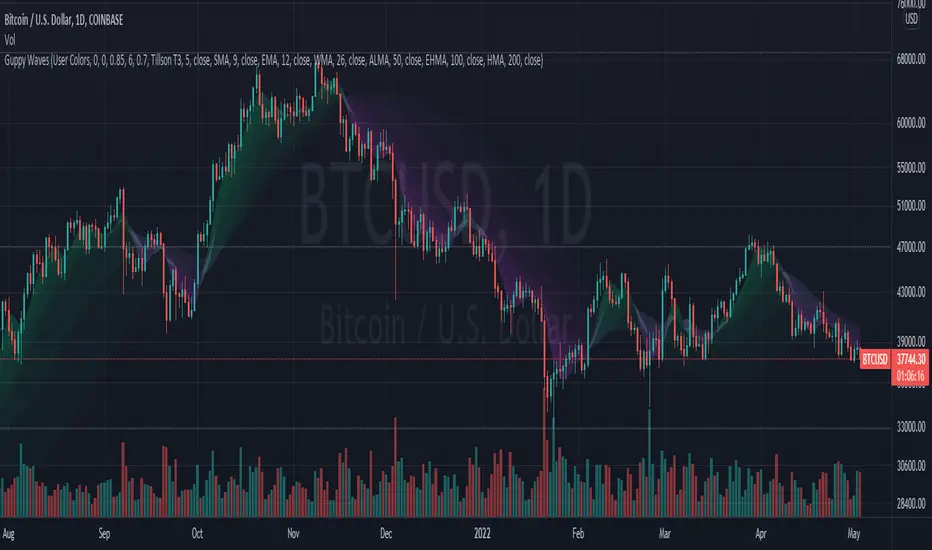
Guppy WavesA lightweight version of the popular "Moving Average Ribbon" or "Guppy" indicators where the visuals are plotted as "waves" rather than moving average lines. As is customary for my indicators, nearly everything about it is user selectable.
Visual Features:
User Customizable Colors
RSI-Based Rainbow Color Scheme
Simple Offset for adjusting transparency
Create great-looking charts very easily
Moving Average Options:
Running (SMoothed) Moving Average (RMA or SMMA ) - very slow/smooth
Simple Moving Average ( SMA )
Exponential Moving Average ( EMA )
Weighted Moving Average ( WMA )
Volume-Weighted Moving Average ( VWMA )
Triple EMA ( TEMA ) - very fast
Exponential Hull Moving Average (EHMA) - Hull with Smoothing (Slower than Hull)
Least Squares Moving Average ( LSMA ) - Simple Linear Regression
Arnaud Legoux Moving Average ( ALMA ) - Adjustable, set offset=1 to be current, offset=0.85 for good smoothing
Hull Moving Average ( HMA ) - very fast
Tillson T3 - very smooth
Donchian Moving Average - plots the average of (lowest, highest) for a given period length
The user can change the source, period, and type of moving average used for every single line on the chart.
Cash Data Chart (Wave Chart)This Indicator is applicable to plot Cash Data Chart in tradingview and it will be very useful for traders who analyze with NEoWave method.
NEoWave analysis method was invented by Glenn Neely and it is a revolutionary style of Elliott Wave Theory.
For analyzing with NEoWave method, we need a particular chart called Wave Chart or Cash Data chart. Wave charts provide a very accurate representation of the Wave movement of the market and allow for much better Wave analysis as a result. To draw this chart, Highs and Lows should be plotted in the order that they occurred. This could be a very challenging and time-consuming task to do for any symbol on any Timeframe. This indicator can calculate and plot Cash Data Charts fast and accurately.
Cash Data Chart is not only useful for people who want to analyze with the NEoWave method, but can also can have a wide range of research areas and can be used in other research and analytical methods.
Some features of this indicator:
- Draw the chart in the desired time frame fast and accurately
- Detect intervals with two duplicate highs or two duplicate lows
- View wave chart and Candlestick chart simultaneously or separately
- Draw charts automatically or draw a chart with the desired interval length and desired start time
- Auto updating Cash Data Charts
- Draw charts on logarithmic and linear price scales
special thanks to www.tradingview.com

Weis Wave With Effort/Reward MatrixThis is based on Weis Wave principle with different customization. Namely
Shows Volume (in thousands) for each wave
Calculates the effort/reward matrix of each wave (proprietary calculation)
Can show either bar count or Effort/Reward (E/R) Matrix with volume for each wave
Default is E/R Matrix only
You can choose what you want to see from the indicator setting. It could be just wave volume, just ER Matrix (default), both ER Matrix and volume, ER Matrix and bar count or all three.
How It Works
BUY - Look for a wave (down) that ends at and around a same level with double or more ER Matrix
SELL- Look for a wave (up) that ends at and around a same level with double or more ER Matrix
There is also a principle called fading E/R Matrix that suggest the dying interest of either buyers or sellers. That also could be a good pointer to initiate fresh trades in the direction against the fading participants.
Points To Note
That said, it is best that you try to align it with your own trading style and existing principles. For example, I use only this indicator and don't even use candle sticks. It's more to do with the way I want to wade away negative and psychological brain fades. I generally use it with E/R Matrix only. As I have mentioned earlier, I always look for a level failure, i.e when I see the price fail to make a new high/low at around the same level with double or more E/R Matrix value. When this happens the price tends to reverse direction. I generally keep the SL 10 pips below/above the last wave end depending on the kind of trade I am into. What I have seen, it has a decent accuracy rate. Of course you ought to have basic price action idea to use this indicator effectively. It is for the people who have prior price action knowledge, so don't expect the script to generate buy/sell signal, because it won't. This indicator itself is an ecosystem of trading and you have to use it based on your trading style.
You can apply it on to your existing charts (bar, candle, line) or can use the wave alone as I do. Just make sure that you keep your opacity of your candles/bars to a level that makes the wave itself more prominent.
The colour combination looks best on a dark background

GODMODE WAVESGODMODE WAVES
Basically used for Trend Direction purpose
Indicator shows Trend direction depending upon price action
Simple to use
Blue/Cyan color shows Trend is Bullish
Red color shows trend is Bearish
Bands acts as support and resistance
lable shows when the crossover happened
Bar colors
Red/Orange = Extremely over bought zone
Green = Extremely over sold zone
(Note = when bar colors appears take profits or wait for the retrace )
DM me for access

R100 Wave v2 (*v*)This is a Wave (or Zig Zag) indicator I made to use in conjunction with the Wave Volume indicator I use.
It uses the Jurik moving average to determine turning points, and will plot the tops and bottoms of the wave based on the most recent high- so you can also use to quickly find pivot highs and lows. If you are using with the R100 Wave Volume indicator, first adjust the wave to fit better (if required) using the Jurik length and/or power, and then use the same settings on the Wave Volume indicator. Default settings work pretty well for most stocks, but adjusting the length between 8 and 14 should be enough for a good fit, or adjust the power between 1 and 3, or get fussy and tweak it with both.
The Jurik MA has been modified to include a VWAP component, so will only work where you have volume. The last "leg" of the wave will move about until the next pivot high or low is found and then will remain fixed.
I hope you find some value with it. Only conditions of use are that if you improve it, let me know and if you publish something that uses it, don't hide the code! Enjoy!
Code pinched and modified from Zero Lag ZigZag by Duyck - thankyou
Jurik Moving Average (for turning points) by Everget - thankyou
and Weis Wave by Modhelius - thankyou

waves advanced developmentwaves advanced development
development version of advanced waves - under development

[volfgang] WAVE ScannerThe Wave Scanner helps you make more informed decisions about when to buy and sell.
This indicator operates on a series of inputs and global variable declarations. Based on the same parameters as the WAVE Indicator. It uses different parameters such as the closing price, Stochastic Momentum Index, and smoothing factors such as the EMA to calculate the potential trade signals.
The scanner allows you to adjust the thresholds for bullish and bearish counts, which can be tailored to your personal trading strategy.
The minimum value is 4 and maximum is 8.
In total you can use 8 different timeframes for your signals from the following;
3D
1D
12h
8h
4h
1h
15m
5m
The scanner's unique ability to scan across multiple timeframes is what makes this indicator unique. This multi timeframe analysis can be incredibly useful for identifying broader trends in the market.
The Wave Scanner settings also includes inputs for you to enter risk management settings, including your total capital and the risk percentage you are willing to take per trade. It uses this information to display data in a label on the chart including;
Position Size
Stop Loss Level
Potential Profit
Risk Reward Ratio
On your chart, the WAVE Scanner will plot the ideal Entry Levels, Stop Loss and Take Profit Levels by calculating Fibonacci Levels, which is a popular tool for identifying potential support and resistance levels.
These are marked as follows;
GREEN Lines: Entry Levels
PINK Line: Stop Loss (can be customized in the settings)
GREY Line: Breakeven Level (move SL to breakeven at this level)
BLUE Line: Take Profit Level
So, if you're a trader looking to level up your strategy, the Wave Scanner is a tool you won't want to miss out on.
Ultimate HODL WaveThe basis for this indicator is the HODL Wave (> 1 Year) developed by Unchained Capital. This represents the percentage of coins that have not been moved for at least a year.
The Hull MA perfectly tracks the HODL Wave and provides an easy bull/bear trend in the mid-term.
The long-term and more macro bull/bear trend is decided by if the Hull MA is above or below the base MA.
I have purposefully chosen the 365 day length for the Hull MA and the 730 day for the base MA on the daily timeframe since they represent 1 year and 2 years respectively.

test - wave collapseexperimental:
translates a gaussian wave to collapse from high/low peaks, slice of a pun intended to the cat in the box :)

Original Wave AnalyzerThis can be applied to Forex, Stocks, and Crypto.
Understanding it
When the buy or sell signal align with the wave, it means the price is heading in the direction of alignment.
This indicator is intended to be used as a confirmation indicator for other algorithms for the best result.
Indicators with specifically tested and chosen settings have been shown to work on a number of timeframes.
How to use on a buy
When you receive a buy signal if it's within the wave or above the wave, it's an indication the market is about to continue that direction. You could aim for 20-50 pips depending on the pair.
When to sell
When you receive a sell signal if it's within the wave or below the wave, it's an indication the market is about to continue that direction. You could aim for 20-50 pips depending on the pair.
When to exit
You can set our indicator to alert you when it's a good time to exit the trade.
How to Access
Gain access to FX Social Entry Finder for your TradingView account by being a active member of FX Social.

Wave Period Oscillator Wave Period Oscillator developed by Akram El Sherbini
Published in article Time Cycle Oscillators in IFTA Journal 2018 (page 66 - 77)
read his article : ifta.org
Entry Long - WPO cross above centerline (Zero Line)
Exit Long - WPO cross below overbought level or cross below centerline(Zero Line)
Entry Short - WPO cross below centerline (Zero Line)
Exit Short - WPO cross above oversold level or cross above centerline(Zero Line)
