Original Wave AnalyzerThis can be applied to Forex, Stocks, and Crypto.
Understanding it
When the buy or sell signal align with the wave, it means the price is heading in the direction of alignment.
This indicator is intended to be used as a confirmation indicator for other algorithms for the best result.
Indicators with specifically tested and chosen settings have been shown to work on a number of timeframes.
How to use on a buy
When you receive a buy signal if it's within the wave or above the wave, it's an indication the market is about to continue that direction. You could aim for 20-50 pips depending on the pair.
When to sell
When you receive a sell signal if it's within the wave or below the wave, it's an indication the market is about to continue that direction. You could aim for 20-50 pips depending on the pair.
When to exit
You can set our indicator to alert you when it's a good time to exit the trade.
How to Access
Gain access to FX Social Entry Finder for your TradingView account by being a active member of FX Social.
Pesquisar nos scripts por "wave"

Wave Period Oscillator Wave Period Oscillator developed by Akram El Sherbini
Published in article Time Cycle Oscillators in IFTA Journal 2018 (page 66 - 77)
read his article : ifta.org
Entry Long - WPO cross above centerline (Zero Line)
Exit Long - WPO cross below overbought level or cross below centerline(Zero Line)
Entry Short - WPO cross below centerline (Zero Line)
Exit Short - WPO cross above oversold level or cross above centerline(Zero Line)

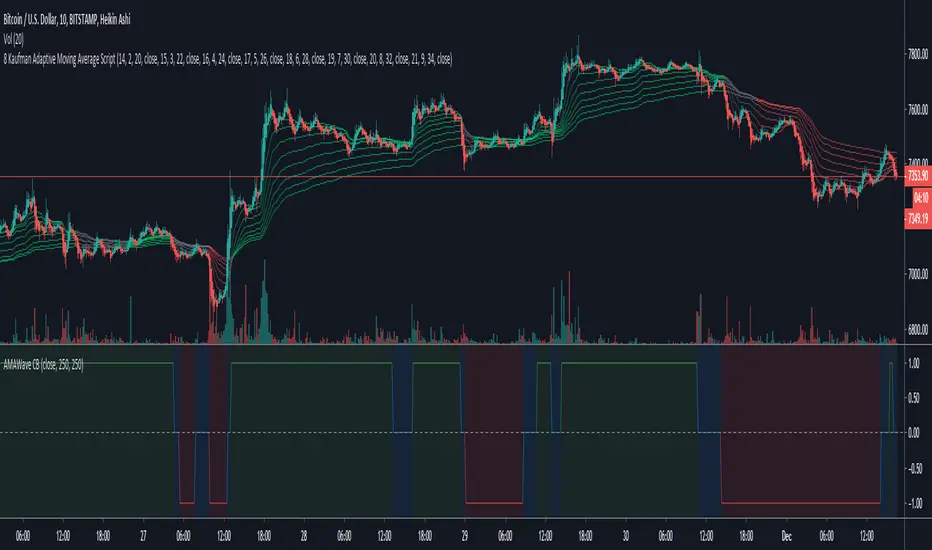
Kaufman AMA Binary Wave [ChuckBanger]This is Kaufman AMA Binary Wave with buy and sell zones. It’s pretty simple: when the line is over zero = buy zone, below zero = sell, at zero = neutral. You can experiment with the filter and length settings to suit your environment.
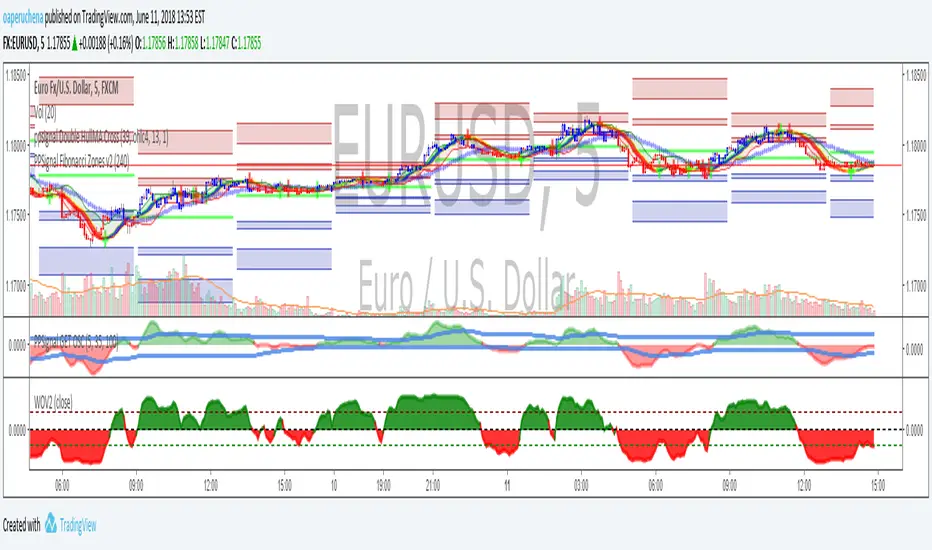
Wave PMWave PM (Whistler Active Volatility Energy Price Mass) indicator is an oscillator described in the Mark Whistler’s book “Volatility Illuminated”.
The indicator attempts to show the relative volatility of the market. This is not a directional indicator, it does give an idea of how much room the trend has to move.

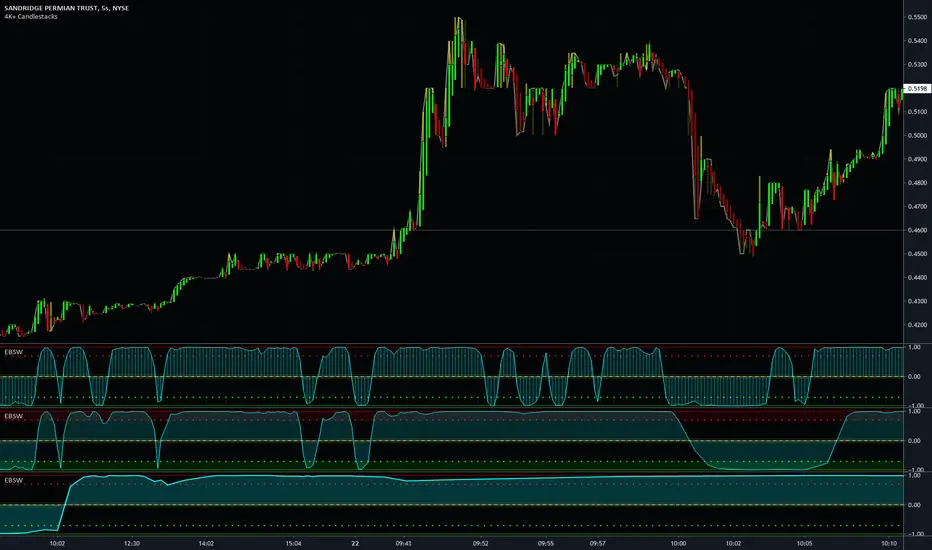
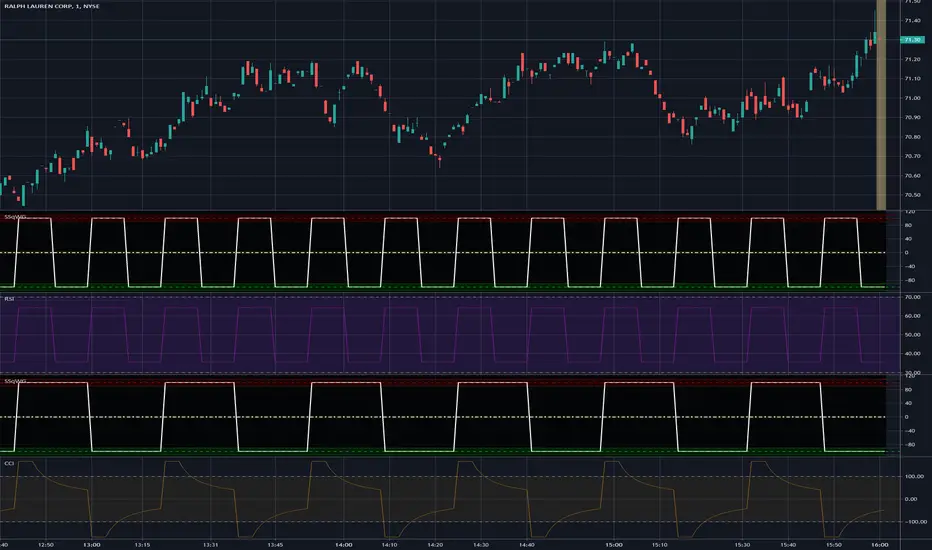
MTF Even Better Sine Wave - Dr. John EhlersThis is my enhanced "MTF Even Better Sine Wave" indicator using Pine Script version 4.0. This originates from the book "Cycle Analytics for Traders" written by Dr. John Ehlers in Chapter 12. While the original was simplistically designed, I enhanced it by adding a multitude of features Pine Script now accommodates.
Most noticeably is the multiple time frame (MTF) features in the indicator "Settings". The three displayed indicators are using 5 second, 30 second, and 7 minute time frames. This may be the first PSv4.0 script to accommodate seconds in MTF adequately, but don't quote me on that. I haven't spent hours extensively looking for them. Be forewarned, second-based time frames are currently for Premium subscribers only, until such time in the future when the prerogative of TV might change. I will be adding second-based time frames to my other indicators where I feel it is beneficial to the indicator.
Unlike Dr. John Ehlers' other Sinewave indicator that is intended for identifying turning points in cycling price fluctuations, the "Even Better Sine Wave", having stochastic like qualities, is intended for trending assets.
Features List Includes:
I.P.O.C.S.(Initial Public Offering Clean Start) Technology
Enable/disable dark background for enhanced visibility
"Source" selection with multiple time frame adjustments - including seconds
"Duration" adjustment
"Super Smoother BandEdge" adjustment
"Display Area" selection for visual mutations displayed above
Ranges and thresholds are enable/disable capable
Upper threshold adjustment
Lower threshold adjustment
Adjustable centered medial zone
Normalized zero mean to +/-1
This is not a freely available indicator, FYI. To witness my Pine poetry in action, properly negotiated requests for unlimited access, per indicator, may ONLY be obtained by direct contact with me using TV's "Private Chats" or by "Message" hidden in my member name above. The comments section below is solely just for commenting and other remarks, ideas, compliments, etc... regarding only this indicator, not others. If you do have any questions or comments regarding this indicator, I will consider your inquiries, thoughts, and concepts presented below in the comments section, when time provides it. When my indicators achieve more prevalent use by TV members, I will implement more ideas when they present themselves as worthy additions. As always, "Like" it if you simply just like it with a proper thumbs up, and also return to my scripts list occasionally for additional postings. Have a profitable future everyone!
(JS) TTM WaveThis is my recreation of the TTM Wave indicator, tried to make it visually appealing - hope you all put it to good use!

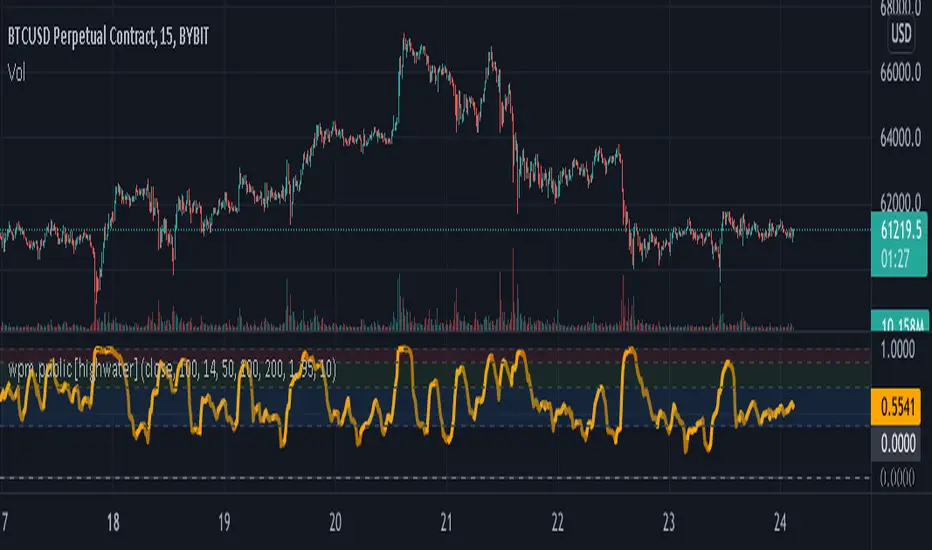
⚛WPO - Wave Period Oscillator by Cryptorhythms⚛WPO - Wave Period Oscillator by Cryptorhythms
Intro
The indicator is based on Akram El Sherbini's article "Time Cycle Oscillators" published in IFTA journal 2018. The third in a series of 4 time cycle indicators I will be publishing.
The WPO is a short-term oscillator that measures the buying and selling period of price cycles over a certain time interval. The leading oscillator indicates a rise in buying period when it moves above the zero line and a rise in selling period when it moves below the zero line.
Description
Centerline Crossover: A bullish centerline crossover occurs when the WPO line moves above the zero level to turn positive. A bearish centerline crossover occurs when the WPO line moves below the zero level to turn negative. When bulls are in control, the price rally begins and the average of the bull’s period T increases to drive the WPO line above the centerline. A buy signal is subsequently triggered. When the bulls start to loose power, prices move sideways and the average period decreases. In this case, the WPO line may flutter near the centerline and cause false signals, whipsaws. To avoid the whipsaws occurring on the centerline, the following trading tactics are proposed.
TL:DR
Bullish signals are generated when WPO crosses over 0
Bearish signals are generated when WPO crosses under 0
OverBought level is 2
OverSold level is -2
ExtremeOB level is 2.7
ExtremeOS level is -2.7
👍 Enjoying this indicator or find it useful? Please give me a like and follow! I post crypto analysis, price action strategies and free indicators regularly.
💬 Questions? Comments? Want to get access to an entire suite of proven trading indicators? Come visit us on telegram and chat, or just soak up some knowledge. We make timely posts about the market, news, and strategy everyday. Our community isn't open only to subscribers - everyone is welcome to join.
For Trialers & Chat: t.me


Simple Square Wave GeneratorThe title pretty much sums up what purpose this tool serves. It is NOT an indicator, just a simple square wave generator. I built this from scratch to test transient responses of filters I have devised to visually inspect the performance of smoothers, moving averages, lag, etc... I'm not sure if anyone may find it useful, but I figured you might be able to source the square wave TO another indicator as long as your indicator/filter you have has: price = input(close, "Source", source), plot(yourMovingAverageOrFilter(price, integerFromInput)). Look for the lowest "SSqWG" in your source selection. I coupled the built-in CCI and RSI to show how it's easily possible. Features include a "Wave Length (Bars)" setting in the "Format" panel, the square wave phase is shift-able to the left and the right, and there is also an amplitude adjustment as well. Let me know if you have any ideas on how you may personally use this if you wish to elaborate briefly. I would like to thank the entire TV development team for making the "Apply Indicator to" feature. That's some really cool tech for tethering indicator windows together, so we can now Frankenstein our scripts together while inspecting the different wave form results in separate windows. That's some revolutionary thinking, awesome job Tradingview DEV team!
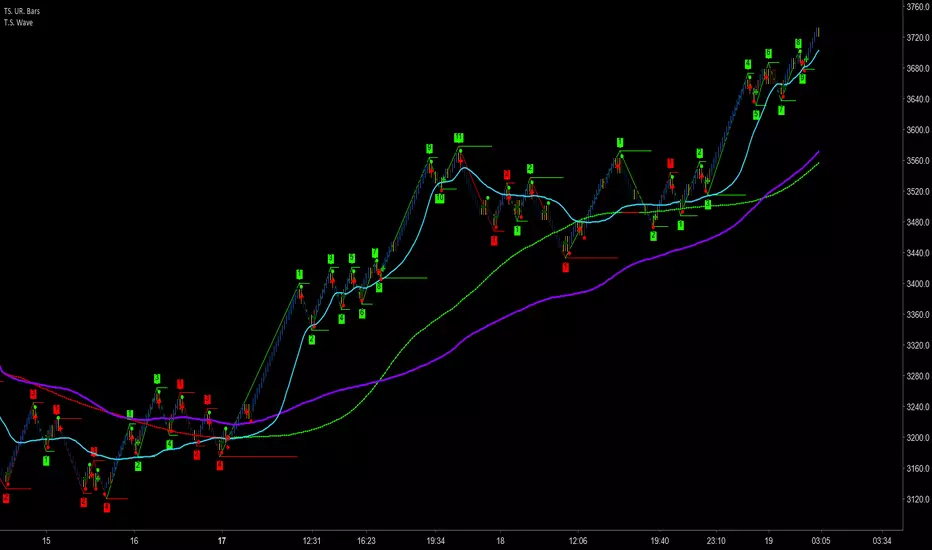
Trader Set - Wave CountThis is a wave counting tool for my methodology with little addition of drawing high low sections of wave reversal as local support / resistance.
Please don't contact me for getting access, these tools are only available for my students. The English version of website and learning materials are under development and soon they will be ready. I will announce it under every script related to my methodology so that you get informed and participate in the course if you want to.

Weis Wave ChartThis indicator is based on the Weis Wave described by David H. Weis in his book Trades About to Happen: A Modern Adaptation of the Wyckoff Method, more info how to use this indicator can be found in this video . The Weis Wave is an adaptation of Richard D. Wyckoff’s method Wave Charts. It works in all time periods and can be applied to all asset types.
Unlike other implementations I found here on TradingView, this implementation make use of a Renko-like zig zag pattern, very similar to how it is described in David H. Weis' book. The settings for the zig zag pattern are very similar to the standard Renko settings here on TradingView, in the "Renko Assignment Method" you either chose "ATR" or "Traditional" (read more about it here ). The ATR length or the brick size is then entered in the textbox "Value". You can also chose another setting in the "Renko Assignment Method" drop down named "Part of Price" which calculate the brick size from the current close and divide it by the value in the text box "Value". It is also possible to chose if the zig zag pattern shall use the high/low, the open/close or just the close as the most extreme values in its calculation, you select this in the drop down "Price Source".
TradingView's pine script does currently not support to print non-static text on the chart, so it is not possible at this point to write out the volume on the zig zag chart. It is also not possible to have both an overlay and separate chart pane in the same indicator, therefor this indicator is split up in two.
You can find the volume indicator here:

Weis Wave VolumeThis indicator is based on the Weis Wave described by David H. Weis in his book Trades About to Happen: A Modern Adaptation of the Wyckoff Method, more info how to use this indicator can also be found in this video . The Weis Wave is an adaptation of Richard D. Wyckoff’s method Wave Charts. It works in all time periods and can be applied to all asset types. For assets that do not support volume Weis propose in his book to use the true range instead, so if you want to use this indicator for assets that do not support volume, make sure to enable the checkbox "Use True Range instead of Volume".
Unlike other implementations I found here on Trading, this implementation make use of a Renko-like zig zag pattern, very similar to how it is described in David H. Weis' book. The settings for the zig zag pattern are very similar to the standard Renko settings here on TradingView, in the "Renko Assignment Method" you either chose "ATR" or "Traditional" (read more about it here ). The ATR length or the brick size is then entered in the textbox "Value". You can also chose another setting in the "Renko Assignment Method" drop down named "Part of Price" which calculate the brick size from the current close and divide it by the value in the text box "Value". It is also possible to chose if the zig zag pattern shall use the high/low, the open/close or just the close as the most extreme values in its calculation, you select this in the drop down "Price Source". If you want the price to oscillate around a zero value, enable the "Oscillating" checkbox.
TradingView's pine script does currently not support to print non-static text on the chart, so it is not possible at this point to write out the volume on the zig zag chart. It is also not possible to have both an overlay and separate chart pane in the same indicator, therefor this indicator is split up in two.
You can find the zig zag indicator here:

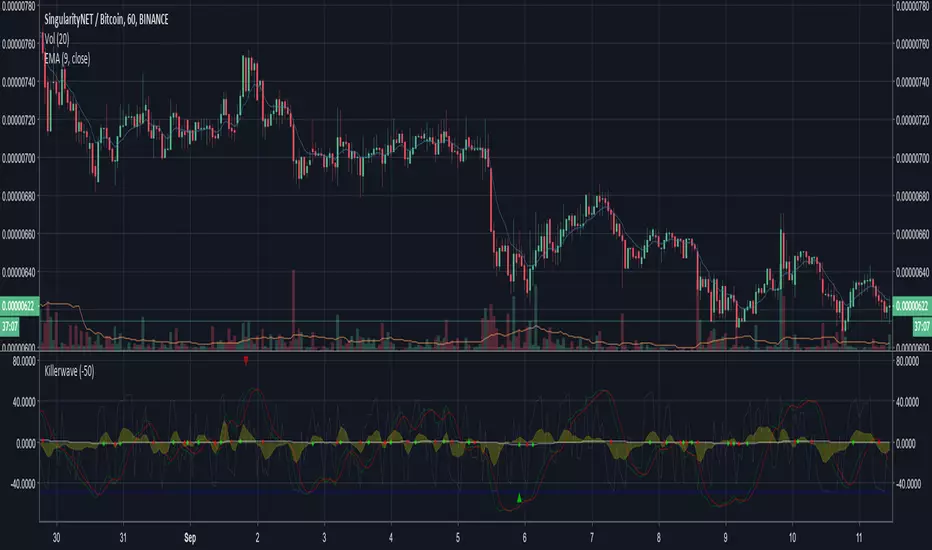
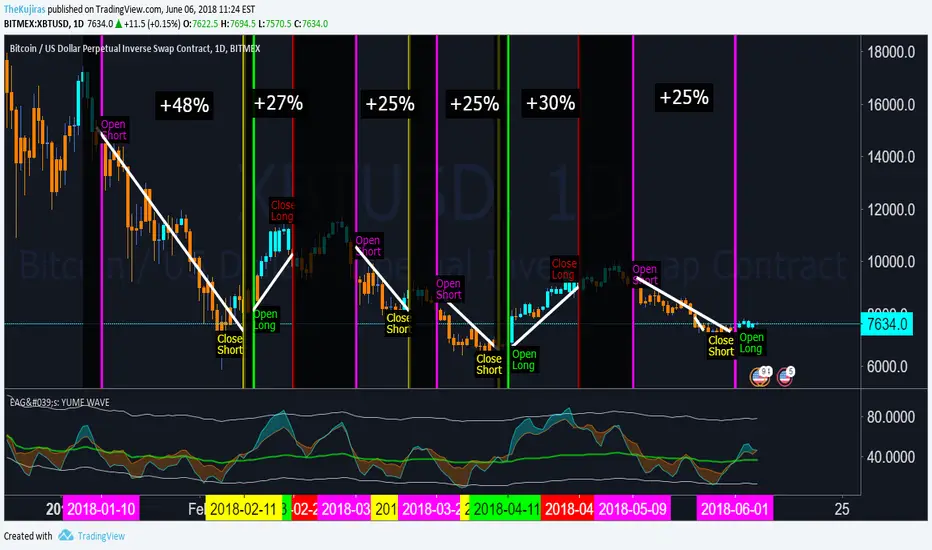
EdgeAnalysisGroup: Yume WaveDONATIONS APPRECIATED
--------------------------------
ETH: 0x862E6C54397Cf681887136472d5F16cCA22C80Fe
BTC: 16wnhEyNB5zx7ErwNi5KyszNeHhtjH2syx
ABOUT
-----------------
Yume (aqua line) is a modified high moving average of RSI
Akume (orange line) is a modified low moving average of RSI
Miaku line (green line) is a variable median line that determines market outlook
Nami is the wave (aka: cloud) that the Yume Akume lines create.
BAR COLORS are based on market sentiment using volume + price action to determine the overall health of the market and probable direction.
MODERATE RISK STRATEGY
-----------------
Bullish Long indicator:
Yume crossing above Akume over the Miaku Line (aqua wave twist)
Close Long Indicator:
Akume crosses above Yume over the Miaku Line (orange wave twist)
Bearish Short indicator:
Akume crossing above Yume under the Miaku Line (orange wave twist)
Close Short Indicator:
YUME crosses above Akume under the Miaku Line (aqua wave twist)
-----------------
DONATIONS APPRECIATED:
ETH: 0x862E6C54397Cf681887136472d5F16cCA22C80Fe
BTC: 16wnhEyNB5zx7ErwNi5KyszNeHhtjH2syx
Fibonacci EMA Wave 13 21 34 55 89 1446 Fibonacci EMAs in one indicator!
Fibonacci EMA Wave / 13 21 34 55 89 144 EMAs
by StokedStocks
Fibonacci numbers are the numbers in the following integer sequence, called the Fibonacci sequence, and characterized by the fact that every number after the first two is the sum of the two preceding ones Example
1 , 1 , 2 , 3 , 5 , 8 ..13 21 34 55 89 144

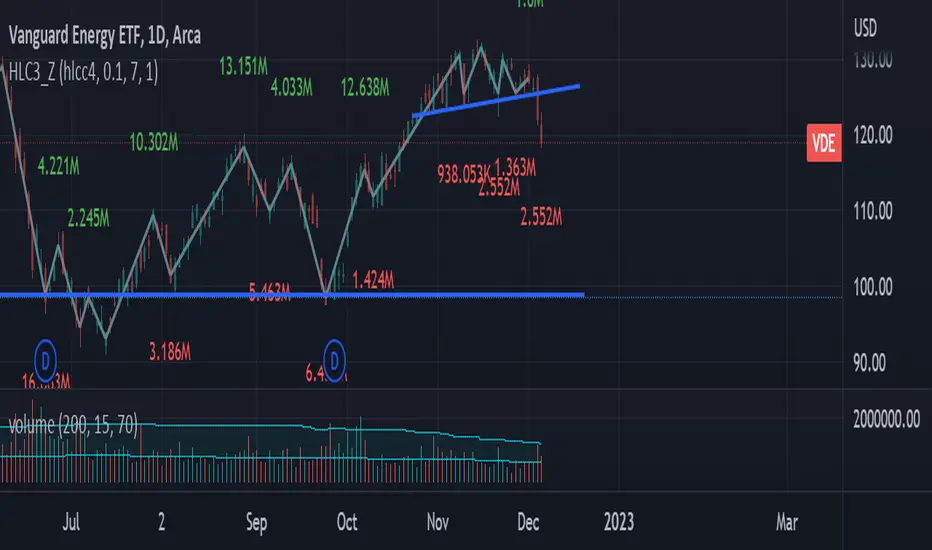
HLC3_ZThis indicator uses a single price point for each session (HLC3 by default) to draw waves.
This helps to filter out small or high frequency fluctuation in the price, and focus on the trend.
There are also options to display cumulative volume for each wave, or to overlay the price source to draw the wave on the chart.
I find using this indicator helps with finding the wave structures or the head or bottom structures such as head-and-shoulder.
HTF Anchor DotsHigh Time Frame Anchor Dots is designed for traders who use the 15m or 1H chart and want a clear visual of higher-timeframe momentum conditions without constantly switching timeframes. The script builds on the Wave Anchor Indicator concept and is intended to complement the TP Mint Trading Strategy.
Using the momentum waves (similar to VuManChu Cipher B / Market Cipher B), the script identifies “anchor” states on higher timeframes (1H, 4H, Daily) and plots colored dots on your current chart:
• Yellow Dots: TP1 timeframe is anchored (overbought/oversold)
• Red Dots: TP2 timeframe is anchored (overbought/oversold)
• Orange Dots: Both TP1 and TP2 timeframes are simultaneously anchored, indicating a significant confluence.
Dots above the price indicate overbought anchors; dots below indicate oversold anchors. Because the indicator checks these conditions at the close of your entry timeframe candles, you may occasionally see a dot even though the higher-timeframe candle later closes out of anchor. Remember, this indicator offers no direct entry signals; it merely highlights potential confluence or caution zones.
Why Use It?
- Quickly assess if momentum on higher timeframes is stretched in one direction.
- Avoid entering a new position when a higher timeframe has just hit a potential turning point.
- Spot patterns in anchor dot clusters that can refine your trading entries or exits.
If you have questions or suggestions, feel free to share them! The script is open to improvements, and I appreciate all feedback. As with any indicator, this tool is not guaranteed to be an accurate prediction of future price action. Most successful traders combine indicators with sound risk management practices and their own personal analysis.

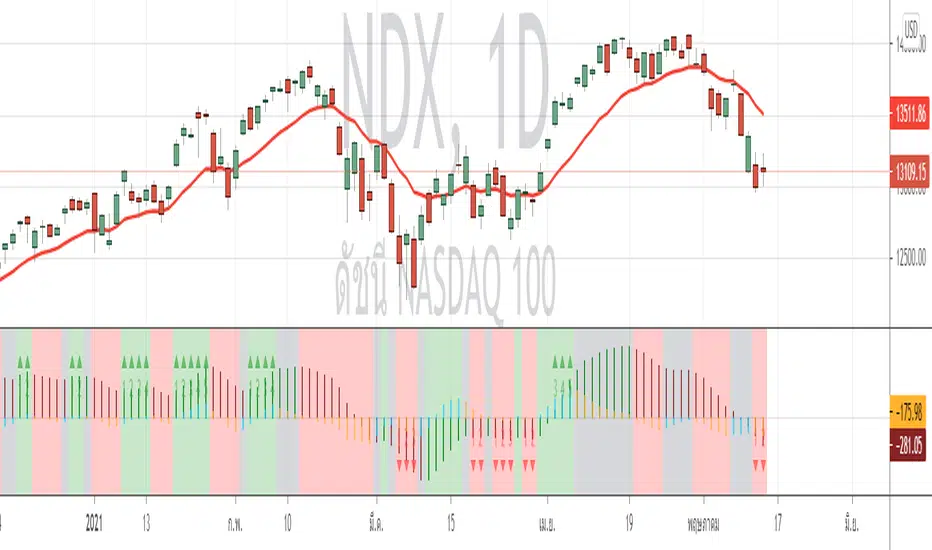
AO-ZoneThe Zone is mention in New Trading Dimensions by Bill Williams,PhD.
The Zone is used for Entry Signal
Green Zone are painting Green when Awesome Oscillator (AO) and Accelerater/Decelerator (AC) are both increasing.
Red Zone are painting Red when Awesome Oscillator (AO) and Accelerater/Decelerator (AC) are both decreasing.
Gray Zone are painting Gray when AO and AC in difference changing
Gray Zone are indicate the indecision between bulls and bears.
Bill Williams, PhD. mention that Green Zone or Red Zone usually happen 6-8 bars Continuously.
(in my opinion, it happen lower than in intraday time frame)
The First Bar that change to be Green or Red color is the Signal Bar.
Entry Signal is the second bar in the same color as the Signal bar happen with Volume
Price go higher the high of previous Green Bar is Buy Signal. Entry Buy (Long) and place Stop at 1 tick lower the Low of previous bar.
Price go lower the Low of previous Red Bars is Sell Signal. Entry Sell (Short) and place Stop at 1 tick higher the High of previous bar.
Can Entry from 2nd bar to 5th bar.
Do not Entry if Green Bars or Red Bars completed 5 bars continuously.
This indicator have AO , AC and Zone in 1 tools and there are counter to show the number of Green bar or Red bar.
Green counter will happen when AO >0 and Green zone because AO > 0 show uptrend condition.
Red Counter will happen when AO < 0 and Red Zone because AO <0 show downtrend condition.
When we entry , we should follow the trend. So I design to non-show the counter if zone is against the trend.
#WaveRiders
RSI with Bull/Bear Resistant -SupportRSI with Bull/Bear Resistant -Support
RSI 14 , Overbought = 70 , Oversold = 30 as original signal use.
RSI line change to be Red when higher 70 and change to be Aqua when lower 30
Bullish or Uptrend use Lime color area.
RSI 80-90 is Bullish Resistant Area.
When RSI hit this area, price are hardly to move up more
RSI 40-50 is Bullish Support Area.
When RSI down from Overbought area to this area, to be alert.
If Price flip up and RSI still in Bullish Support Area, Price have enough momentum to return high.
If Price fall down and RSI break down lower Bullish Support Area, Price change to be down trend.
Bearish or Downtrend use Pink color area.
RSI 15-25 is Bearish Support Area.
When RSI hit this area, price are hardly to move down more.
RSI 55-65 is Bearish Resistant Area.
When RSI go up from Oversold are to this area, to be alert.
If Price flip down and RSI still in Bearish Resistant Area, Price have enough momentum to go more low.
If Price go up and RSI break up higher Bearish Resistant Area, Price change to be uptrend.
..
#WaveRiders

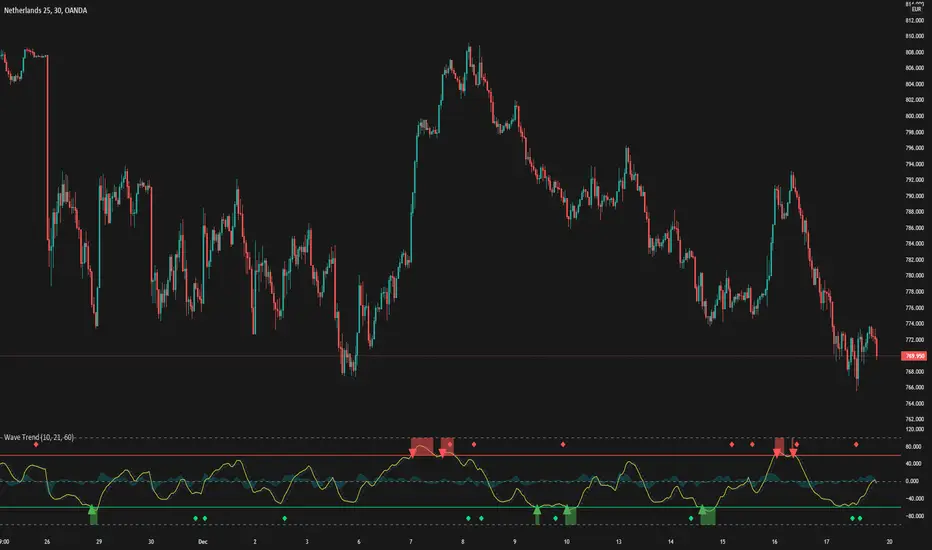
WaveTrendThis is a trend Analysis indicator request by Taleeto
To fully use this script, you will need a security key from him.
It alerts you when to buy or sell based on the market conditions