VMACD - CUMULATIVEThis measures positive and negative volume flow throughout all the noise of price change. Helps find the true flow of the trend.
* Positive movement upward is accumulation
* Negative movement downward is distibution
** Expect heavy activity whenever it hits a crossing point above or below 0
Works by taking the cumulative change of VMACD
Part of the VMACD Strategy, specifically engineered for Forex Markets, contact me if interested it is a high costing indicator.
Pesquisar nos scripts por "volume"

Altcoins StrategyBuy/Sell Altcoins strategy. Based on moving averages, divergences, price and volume

MCI and VCI - Modified CCI FormulasFor private peeps only
- Takes a modified version of the CCI formula into 2 parts
VCI - Volume Channel Index (Yellow Histogram)
- Measures accurate accumulation and distribution levels and times
MCI - Modified Channel Index
- Measures (when compared to VCI) levels where clearly buys are interested vs not interested.
Example:
If VCI > MCI
- Shows buyer's are more than interested in buying, you've either hit a bottom or heavy resistance
if MCI > VCI
- Show's buyer's aren't interested and will most likely result in a dump/lower price
Great for monitoring accumulation and distribution, these auto buy and sells look for the transition points over 0, works on EVERY commodity/stock/FOREX/Crypto
Results are from trading 1 BTC x25 leveraging. Not all trades will get in if put in at limit, but it does survive with profits after the massive 0.075 fee (results shown are after fees)

Strategy testingCombining concept of Bollinger Band and volume analysis.
it looks like strategy direction should be long only.

Altcoin-BTC TidesRider (beats Buy & Hold) BINANCE:EOSBTC
参数基于Binance的EOSBTC。不同交易对有不同DNA,没有万金油策略,需要调整参数。
基于均线
双均线过滤信号
Haiken Ashi蜡烛图过滤信号
通过量能放大来“偷鸡”赚取利润
不断改进中.
Based on Moving Average
Use dual SMA to filter false signals
Use Haiken Ashi candlesticks to filter false signals
Volume sensitive buy and sell to obtain higher profit
Default settings are based on EOSBTC on Binance and are overfitted to produce good backtest results, however this is normal as each trading pair has its own DNA hence optimal settings.
I welcome suggestions of improvements.
Ongoing improvement.
Contact me for subscription.
Disclaimer: The strategy does not form or provide financial advice regarding investment. Use at your own risk.

S&P 500 Benchmark Strategy
This strategy is a Benchmark Trend trading strategy. I used it primarily to measure my private algorithms against. It works on a variety of instruments at intervals between 1m and 1d (you'll have to play with some of the ranged variables in these cases). It was primarily designed to trade the 15 minute interval on SPX derived products. S&P E-Mini contract featured above.
It hits what I consider to be key targets when developing an algo:
1. Avg Trade is above $50
2. Profit Factor is above 1.2 (preferably above 1.5)
3. Has a relatively small draw-down
4. Is able to be traded both long and short
Notes/Options:
Can trade within market hours (default), outside market hours (with open inside), or anytime
Can adjust lengths for trend calculations
Algo tries its best to avoid fake-outs by using a volume component, this means that it misses 'slow rises' sometimes
By default it tries to only enter trades between 0930 and 1600. If the trade has left the station, it will wait for the next setup.
Stop loss level has a big impact on performance per instrument - default is 20 ticks but this has to be changed per instrument (I plan on updating this with code to auto-magically generate appropriate stop levels
As a Trend Following algorithm, it is vulnerable to chop zones but has been particularly resilient over the past few months when traded at 15m or 1h intervals. It is designed to trade against the 'current' market that has more frequent whipsaws. When used over generic bull market periods, it fails due to the high number of failed short trades and trimmed long trades. It works in a medium/high volatility environment.

BOLLedOverIntroduction
BOLLedOver leverages classic signal strategies typically seen in equity program trading algos. Interestingly, in the crypto world, these statistical methods don’t mean quite as much as crypto is generally random and spastic. (I find some of the online analysis humorous—“setting bottom when we cross the 50 day moving average”—really? Trend following is measured in minutes, hours or days, not weeks or months. BOLLedOver uses the Bollinger Band method with various filters to insure good buying and selling opportunities. These scripts use the same framework with different signaling strategies as I have found this a very useful way to “test and learn”. The framework allows configuration for “interesting” parameters to their underlying statistical functions. Trade execution strategies are equally as important than getting the right signals in place. In the live BOT version, the framework allows for MARKET orders only, and “chasing the book” which insures that you can place LIMIT orders attempting to be a “market maker” not “taker”. In addition, the framework takes a trailing STOP approach which eliminates a lot of risk on the down side.
FOR BOT RENTERS ONLY: With so much trading, fees and slippage can really make a difference. Some exchanges provide free trades (GDAX) if you make markets with your trading. This applies to both the BUY and SELL sides and proves very useful. A big mistake with newbies in this area is not considering cost (and slippage). The framework has yielded approximately 70-80% free trades (mileage varies based on statistical settings) with exchanges that have the market maker policy. Always, be conservative in back-testing the strategies with fee settings—this can quickly destroy profits. I have tested extensively on Binance, Bitfinex and GDAX and leave it to you to backtest your favorite exchange—BOLLedOver trades a lot with some settings, so if your exchange isn’t quite as reliable or has holes in the data the BOT may not perform as advertised.
Key Features
• Designed for market maker trading
• Leverages classic statistical models in a unique crypto way
• Trades when market is sideways or heading up, sleeps when heading down
• Two to three trades daily (depending on settings and market action)
• Tune-able with ample knobs and levers.
Parameters
Stop Loss % (default 97%) STOPs will be placed and ratchet up following stops with each 1% increase in price action.
Stop Loss Trail % (default 96%) Second STOP starts here.
Bollinger Bands Time Period (default 6) indicates 6 candles in calculation. BOLLedOver runs best at 15 minutes periods. Try your own setting with plenty of backtesting.
Average Volume (default 18) filters buy and sell signals
Buy ROC Length (default 75) number of candles averaged for positive rate of change , which gives the go ahead to act on a BUY signal. When markets are heading south the BOT goes to sleep. You might get a STOP LOSS haircut (default 3%, 2 to 1 chance if you are in a position), but no trade chattering in whipsaw downward spirals after that.
Sell ROC Length (default 85) number of candles averaged for a negative rate of change , which gives the go ahead to act on a SELL signal. Note: the tighter the Bollinger Bands (e.g. 5) the less likely a SELL will process before a STOP LOSS is reached making this parameter useless in those cases.
MACD – the moving average convergence/divergence is used to check the validity of BUY and SELL signals
MACD Fast Period (default 13)
MACD Slow Period (default 24)
MACD Signal Smoothing (default 8)
Candles to Wait After Trade (default 4) set to 0 to turn off. Keeps trades from occurring consecutively in pump and dump environment.
This script logic is available on cryptotrader.org as a rentable BOT. You will need API keys for automated trading.

BOLLedOverIntroduction
BOLLedOver leverages classic signal strategies typically seen in equity program trading algos. Interestingly, in the crypto world, these statistical methods don’t mean quite as much as crypto is generally random and spastic. (I find some of the online analysis humorous—“setting bottom when we cross the 50 day moving average”—really? Trend following is measured in minutes, hours or days, not weeks or months. BOLLedOver uses the Bollinger Band method with various filters to insure good buying and selling opportunities. All my scripts use the same framework with different signaling strategies as I have found this a very useful way to “test and learn”. The framework allows configuration for “interesting” parameters to their underlying statistical functions. In addition, I have found that trade execution strategies are far more important than getting the right signals in place. In the live BOT version, my framework allows for MARKET orders only, and “chasing the book” which insures that you can place LIMIT orders attempting to be a “market maker” not “taker”. In addition, the framework takes a trailing STOP approach which eliminates a lot of risk on the down side.
With so much trading, fees and slippage can really make a difference. Some exchanges provide free trades (GDAX) if you make markets with your trading. This applies to both the BUY and SELL sides and proves very useful. A big mistake with newbies in this area is not considering cost (and slippage). My BOTs have yielded approximately 70-80% free trades (mileage varies based on statistical settings) with exchanges that have the market maker policy. Always, be conservative in back-testing the strategies with fee settings—this can quickly destroy profits.
I have tested extensively on Binance, Bitfinex and GDAX and leave it to you to backtest your favorite exchange—BOLLedOver trades a lot with some settings, so if your exchange isn’t quite as reliable or has holes in the data the BOT may not perform as advertised.
Key Features
• Designed for market maker trading
• Leverages classic statistical models in a unique crypto way
• Trades when market is sideways or heading up, sleeps when heading down
• Two to three trades daily (depending on settings and market action)
• Tune-able with ample knobs and levers.
Parameters
Stop Loss % (default 98%) STOPs will be placed and ratchet up following stops with each 1% increase in price action.
Stop Loss Trail % (default 96%) Second STOP starts here.
Bollinger Bands Time Period (default 6) indicates 6 candles in calculation. BOLLedOver runs best at 15 minutes periods. Try your own setting with plenty of backtesting.
Average Volume (default 18) filters buy and sell signals
Buy ROC Length (default 75) number of candles averaged for positive rate of change, which gives the go ahead to act on a BUY signal. When markets are heading south the BOT goes to sleep. You might get a STOP LOSS haircut (default 3%, 2 to 1 chance if you are in a position), but no trade chattering in whipsaw downward spirals after that.
Sell ROC Length (default 85) number of candles averaged for a negative rate of change, which gives the go ahead to act on a SELL signal. Note: the tighter the Bollinger Bands (e.g. 5) the less likely a SELL will process before a STOP LOSS is reached making this parameter useless in those cases.
MACD – the moving average convergence/divergence is used to check the validity of BUY and SELL signals
MACD Fast Period (default 10)
MACD Slow Period (default 24)
MACD Signal Smoothing (default 10)
Candles to Wait After Trade (default 10) set to 0 to turn off. Keeps trades from occurring consecutively in pump and dump environment.

[Strategy] CoinDog - colored bars, RSI & EMA buy entry - v0.2Proof of Concept for algorithmic trading with Cryptocurrencies.
Could be used manually as swiss knife for trading or as automatic trading system for trade automation.
Main features:
has collored candle bars
draws main MAs - EMA for 10, 20, 60, SMA for 200
draws custom Boilinger Bands
draws RSI undersold, overbought
draws price change more then delta
draws volume change more then delta and xyz BTC

Momentum Trader Strategy 3.0Momentum Trader 3.0 is a momentum trading strategy which uses volume to confirm market momentum driven moves.
By default it only trades between 0900 and 1530 (designed for futures trading and can be toggled to 24/7)
No repaint issues, what you see is real
Toggles allow you to enable Long or Short independently which may work better or worse for your market
Designed primarily for Day Trading (1-15m interval)
Presently only the Short side is optimized, the Long works but overtrades a bit. I will be adding an option to remove the less useful signals and improve performance.
Momentum Trader is a real and successful momentum strategy (which I use myself). It isn't a miracle 'always win' strategy but it is a steady workhorse. By combining high probability momentum trades and auto stop-losses, it takes a good slice of most rallies, a big slice of the grand drops, and avoids heavy sudden losses.
Momentum Trader can be used in any timeframe. Your success depends on the volatility of the individual market. I recommend trading at 10m and below for high volatility instruments like ES/SPX while low volatility instruments can be traded at the 1h and beyond. At the level of 1D+ it also works as well but naturally as a momentum strategy it may take a while to pivot.
Momentum Trader provides you with 3 long and 2 short entries which represent different levels of risk/reward. Like any real strategy, there can be periods of chop where the strategy will lose (small based on stop-loss) if the market is chopping very quickly back and forth or pivoting suddenly. As a rule, Momentum Trader attempts to avoid most of that by typically flagging trends which are established and confirmed. Different signals give you different degrees of confirmation and thus different risk/reward.

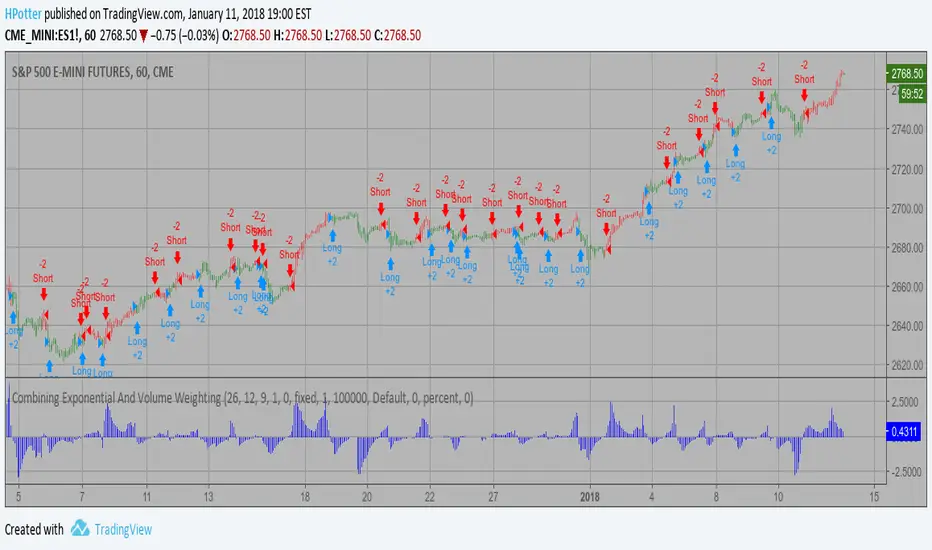
Combining Exponential And Volume Weighting Backtest The related article is copyrighted material from Stocks & Commodities 2009 Oct
You can change long to short in the Input Settings
WARNING:
- For purpose educate only
- This script to change bars colors.
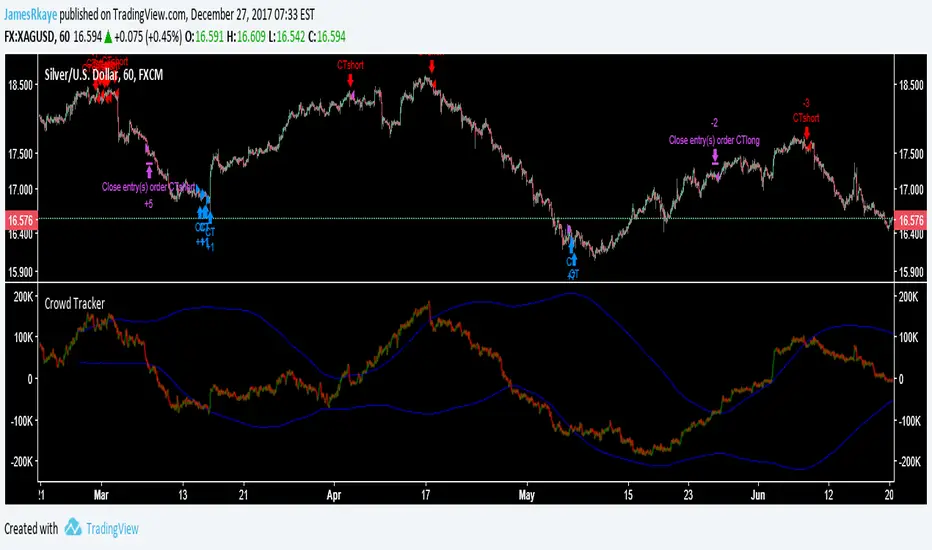
Crowd Tracker (work in progress)This indicator/strategy should be used similarly to how you would analyse sentiment data, when the crowd is bullish look to be short, when the crowd is bearish look to be long. It is also is inspired by Elliott wave, as it is looking for ending waves. The crowd tracker uses volume and price data to estimate how many people went long or short in a candle, then adds the candles over a 500 candle period together. A spike in bullishness on the indicator indicates that a bull trend may be over because ending Elliott waves, for example 5s and Cs, are when the crowd are most on board with the trend. The blue lines are a standard deviation (Bollinger Band), between these lines is where a healthy trend would be found. When the Crowd Tracker leaves and re-enters the blue lines this is a sign of a change in trader psychology, as they have reached their maximum confidence in a trend then reversed.
This is still work in progress because I want to find a better way to find the tops and bottoms of the Crowd Tracker, so it is set to invite only, after I have completed it I will probably release it in protected so follow me if you want to use it later on :) It is good at spotting entries for cryptos and stock indexes however the exits still need work.
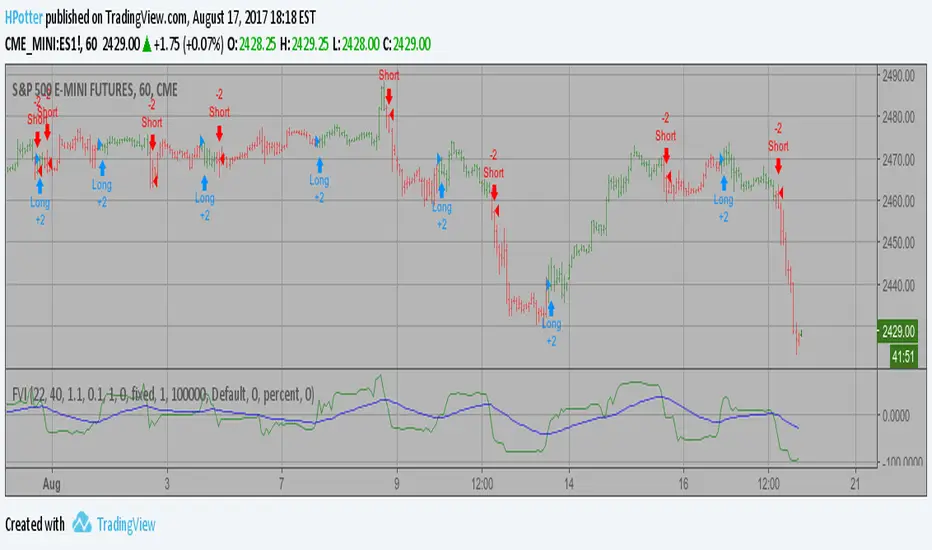
Volatility Finite Volume Elements Backtest This version has an important enhancement to the previous one that`s
especially useful with intraday minute charts.
Due to the volatility had not been taken into account to avoid the extra
complication in the formula, the previous formula has some drawbacks:
The main drawback is that the constant cutoff coefficient will overestimate
price changes in minute charts and underestimate corresponding changes in
weekly or monthly charts.
And now the indicator uses adaptive cutoff coefficient which will adjust to
all time frames automatically.
You can change long to short in the Input Settings
Please, use it only for learning or paper trading. Do not for real trading.
RSI, Volume, MACD, EMA ComboRSI + Volume + MACD + EMA Trading System
This script combines four powerful indicators—Relative Strength Index (RSI), Volume, Moving Average Convergence Divergence (MACD), and Exponential Moving Average (EMA)—to create a comprehensive trading strategy for better trend confirmation and trade entries.
How It Works
RSI (Relative Strength Index)
Helps identify overbought and oversold conditions.
Used to confirm momentum strength before taking a trade.
Volume
Confirms the strength of price movements.
Avoids false signals by ensuring there is sufficient trading activity.
MACD (Moving Average Convergence Divergence)
Confirms trend direction and momentum shifts.
Provides buy/sell signals through MACD line crossovers.
EMA (Exponential Moving Average)
Acts as a dynamic support and resistance level.
Helps filter out trades that go against the overall trend.
Trading Logic
Buy Signal:
RSI is above 50 (bullish momentum).
MACD shows a bullish crossover.
The price is above the EMA (trend confirmation).
Volume is increasing (strong participation).
Sell Signal:
RSI is below 50 (bearish momentum).
MACD shows a bearish crossover.
The price is below the EMA (downtrend confirmation).
Volume is increasing (intense selling pressure).
Backtesting & Risk Management
The strategy is optimized for scalping on the 1-minute timeframe (adjustable for other timeframes).
Default settings use realistic commission and slippage to simulate actual trading conditions.
A stop-loss and take-profit system is integrated to manage risk effectively.
This script is designed to help traders filter out false signals, improve trend confirmation, and increase trade accuracy by combining multiple indicators in a structured way.

MACD Volume Strategy for XAUUSD (15m) [PineIndicators]The MACD Volume Strategy is a momentum-based trading system designed for XAUUSD on the 15-minute timeframe. It integrates two key market indicators: the Moving Average Convergence Divergence (MACD) and a volume-based oscillator to identify strong trend shifts and confirm trade opportunities. This strategy uses dynamic position sizing, incorporates leverage customization, and applies structured entry and exit conditions to improve risk management.
⚙️ Core Strategy Components
1️⃣ Volume-Based Momentum Calculation
The strategy includes a custom volume oscillator to filter trade signals based on market activity. The oscillator is derived from the difference between short-term and long-term volume trends using Exponential Moving Averages (EMAs)
Short EMA (default = 5) represents recent volume activity.
Long EMA (default = 8) captures broader volume trends.
Positive values indicate rising volume, supporting momentum-based trades.
Negative values suggest weak market activity, reducing signal reliability.
By requiring positive oscillator values, the strategy ensures momentum confirmation before entering trades.
2️⃣ MACD Trend Confirmation
The strategy uses the MACD indicator as a trend filter. The MACD is calculated as:
Fast EMA (16-period) detects short-term price trends.
Slow EMA (26-period) smooths out price fluctuations to define the overall trend.
Signal Line (9-period EMA) helps identify crossovers, signaling potential trend shifts.
Histogram (MACD – Signal) visualizes trend strength.
The system generates trade signals based on MACD crossovers around the zero line, confirming bullish or bearish trend shifts.
📌 Trade Logic & Conditions
🔹 Long Entry Conditions
A buy signal is triggered when all the following conditions are met:
✅ MACD crosses above 0, signaling bullish momentum.
✅ Volume oscillator is positive, confirming increased trading activity.
✅ Current volume is at least 50% of the previous candle’s volume, ensuring market participation.
🔻 Short Entry Conditions
A sell signal is generated when:
✅ MACD crosses below 0, indicating bearish momentum.
✅ Volume oscillator is positive, ensuring market activity is sufficient.
✅ Current volume is less than 50% of the previous candle’s volume, showing decreasing participation.
This multi-factor approach filters out weak or false signals, ensuring that trades align with both momentum and volume dynamics.
📏 Position Sizing & Leverage
Dynamic Position Calculation:
Qty = strategy.equity × leverage / close price
Leverage: Customizable (default = 1x), allowing traders to adjust risk exposure.
Adaptive Sizing: The strategy scales position sizes based on account equity and market price.
Slippage & Commission: Built-in slippage (2 points) and commission (0.01%) settings provide realistic backtesting results.
This ensures efficient capital allocation, preventing overexposure in volatile conditions.
🎯 Trade Management & Exits
Take Profit & Stop Loss Mechanism
Each position includes predefined profit and loss targets:
Take Profit: +10% of risk amount.
Stop Loss: Fixed at 10,100 points.
The risk-reward ratio remains balanced, aiming for controlled drawdowns while maximizing trade potential.
Visual Trade Tracking
To improve trade analysis, the strategy includes:
📌 Trade Markers:
"Buy" label when a long position opens.
"Close" label when a position exits.
📌 Trade History Boxes:
Green for profitable trades.
Red for losing trades.
📌 Horizontal Trade Lines:
Shows entry and exit prices.
Helps identify trend movements over multiple trades.
This structured visualization allows traders to analyze past performance directly on the chart.
⚡ How to Use This Strategy
1️⃣ Apply the script to a XAUUSD (Gold) 15m chart in TradingView.
2️⃣ Adjust leverage settings as needed.
3️⃣ Enable backtesting to assess past performance.
4️⃣ Monitor volume and MACD conditions to understand trade triggers.
5️⃣ Use the visual trade markers to review historical performance.
The MACD Volume Strategy is designed for short-term trading, aiming to capture momentum-driven opportunities while filtering out weak signals using volume confirmation.

McClellan A-D Volume Integration ModelThe strategy integrates the McClellan A-D Oscillator with an adjustment based on the Advance/Decline (A-D) volume data. The McClellan Oscillator is calculated by taking the difference between the short-term and long-term exponential moving averages (EMAs) of the A-D line. This strategy introduces an enhancement where the A-D volume (the difference between the advancing and declining volume) is factored in to adjust the oscillator value.
Inputs:
• ema_short_length: The length for the short-term EMA of the A-D line.
• ema_long_length: The length for the long-term EMA of the A-D line.
• osc_threshold_long: The threshold below which the oscillator must drop for an entry signal to trigger.
• exit_periods: The number of periods after which the position is closed.
• Data Sources:
• ad_advance and ad_decline are the data sources for advancing and declining issues, respectively.
• vol_advance and vol_decline are the volume data for the advancing and declining issues. If volume data is unavailable, it defaults to na (Not Available), and the fallback logic ensures that the strategy continues to function.
McClellan Oscillator with Volume Adjustment:
• The A-D line is calculated by subtracting the declining issues from the advancing issues. Then, the volume difference is applied to this line, creating a “weighted” A-D line.
• The short and long EMAs are calculated for the weighted A-D line to generate the McClellan Oscillator.
Entry Condition:
• The strategy looks for a reversal signal, where the oscillator falls below the threshold and then rises above it again. The condition is designed to trigger a long position when this reversal happens.
Exit Condition:
• The position is closed after a set number of periods (exit_periods) have passed since the entry.
Plotting:
• The McClellan Oscillator and the threshold are plotted on the chart for visual reference.
• Entry and exit signals are highlighted with background colors to make the signals more visible.
Scientific Background:
The McClellan A-D Oscillator is a popular market breadth indicator developed by Sherman and Marian McClellan. It is used to gauge the underlying strength of a market by analyzing the difference between the number of advancing and declining stocks. The oscillator is typically calculated using exponential moving averages (EMAs) of the A-D line, with the idea being that crossovers of these EMAs indicate potential changes in the market’s direction.
The integration of A-D volume into this model adds another layer of analysis, as volume is often considered a leading indicator of price movement. By factoring in volume, the strategy becomes more sensitive to not just the number of advancing or declining stocks but also how significant those movements are based on trading volume, as discussed in Schwager, J. D. (1999). Technical Analysis of the Financial Markets. This enhanced version aims to capture stronger and more sustainable trends in the market, helping to filter out false signals.
Additionally, volume analysis is often used to confirm price movements, as described in Wyckoff, R. (1931). The Day Trading System. Therefore, incorporating the volume of advancing and declining stocks in the McClellan Oscillator offers a more robust signal for trading decisions.

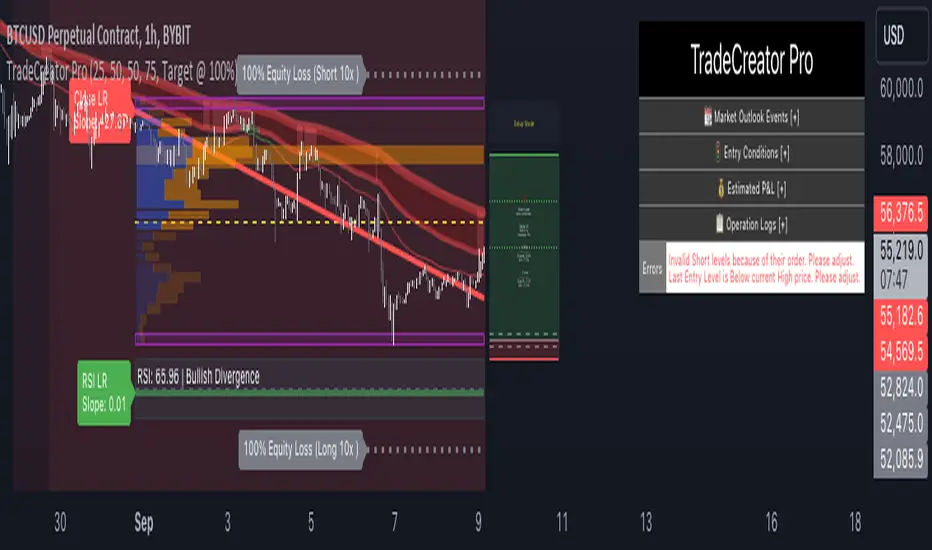
TradeCreator Pro - Moving Averages, RSI, Volume, Trends, Levels█ Overview
TradeCreator Pro is designed to help you build successful trades by streamlining the processes of trade planning, evaluation, and execution. With a focus on data accuracy, speed, precision, and ease of use, this all-in-one tool assists in identifying optimal entry and exit points, calculating risk/reward ratios, and executing trades efficiently. Whether you’re a beginner or an experienced trader, TradeCreator Pro empowers you to make informed, data-driven decisions with real-time signals and fully customizable settings.
█ Key Benefits & Use Cases
TradeCreator Pro is designed to help you effortlessly discover profitable trades by evaluating and testing multiple setups across different assets and timeframes. Key use cases include:
Quick Strategy Testing: Rapidly test multiple setups and strategies, gaining immediate insights into their potential outcomes.
Risk/Reward Evaluation: Quickly identify which trade ideas are worth pursuing based on their profitability and associated risk.
Multi-Timeframe Testing: Seamlessly test the same trading setup across various timeframes and tickers.
Backtesting: Analyze the historical performance of specific setups to gauge their effectiveness.
Key Level Identification: Instantly spot critical support and resistance levels, improving your decision-making process.
Custom Alerts: Set personalized notifications for key levels, ensuring timely action on potential trade opportunities.
█ Core Features
Dashboard: A real-time view of critical metrics such as trend strength, support/resistance levels, volume profiles, RSI divergence, and trade scoring. Designed to provide a comprehensive snapshot of your trading environment and potential trading outcome.
Trend Analysis: Detect prevailing trends by analyzing multiple moving averages, support/resistance zones, volume profile and linear regressions for RSI and closing prices.
Support & Resistance Identification: Automatically identify support and resistance levels.
Volume Profile: Visualize volume profile and its point of control across support/resistance ranges, helping you spot key consolidation areas.
RSI & Price Divergence Detection: Identify potential divergences between RSI and price through linear regressions, providing valuable trade signals.
Risk Management Tools: Set equity loss levels based on specified leverage, allowing you to manage risk effectively for both long and short trades.
Entry & Exit Recommendations: Identify multiple options for optimal entry and exit levels based on current market conditions.
Trade Scoring: Score each trade setup on a 0-100 scale, factoring in potential ROI, ROE, P&L, and Risk-Reward Ratios to ensure high-quality trade execution.
Dynamic Execution & Monitoring: Benefit from multi-stage exit strategies, dynamic trailing stop losses, and the ability to backtest setups with historical data.
Alerts & Automation: Customize alerts for key market movements and opt for manual or automated trading through TradingView’s supported partners.
█ How to Use
Installation: Add TradeCreator Pro to your TradingView chart.
Trend Adjustment: The system automatically detects the current market trend, but you can fine-tune all trend detection parameters as needed.
Trading Parameter Configuration: Customize entry, exit, profitability, and risk-reward settings to match your trading style.
Entry and Exit Level Refinement: Use the automated suggestions, or choose from conceptual or arbitrary levels for greater control.
Stop Loss and Profit Target Fine-Tuning: Apply the system’s recommendations or adjust them by selecting from multiple available options.
Backtest Setup: Run the backtester to analyze past performance and assess how the strategy would have performed historically.
Set Alerts: Stay informed by setting alerts to notify you when a trade setup is triggered.
█ Notes
The first time you apply the indicator to a chart, it may take a few moments to compile. If it takes too long, switch timeframes temporarily to restart the process.
█ Risk Disclaimer
Trading in financial markets involves significant risk and is not suitable for all investors. The use of TradeCreator Pro, as well as any other tools provided by AlgoTrader Pro, is purely for informational and educational purposes. These tools are not intended to provide financial advice, and past performance is not indicative of future results. It is essential to do your own research, practice proper risk management, and consult with a licensed financial advisor before making any trading decisions. AlgoTrader Pro is not responsible for any financial losses you may incur through the use of these tools.
MACD, RSI, & RVOL Strategy
This strategy combines the use of MACD (12, 26, 9), RSI (14, 30, 70), and RVOL (14) to create Long Buy and Sell signals. This works well with many different time intervals but was developed with 15-minute intervals in mind.
Using MACD as a reference, the strategy identifies when the MACD line crosses over (a factor in a buy signal) and under (a factor in a Sell signal) the Signal line. This shows a shift in positive (cross over) and negative (cross under) of a security.
Using the Relative Strength Index ( RSI ) as an indicator, the strategy notices when the velocity and magnitude of the directional price movements cross over the Oversold signal (30) and crosses under the Overbought signal (70) as a factor in creating a Buy and Sell signal.
Using Relative Volume (RVOL) as an indicator, the strategy calculates when the current volume has crossed over the 2x average volume indicator over a given period and is then used as a factor in creating a Buy signal. RVOL is also used when the change in volume crosses under a set RVOL number (in this strategy, it is set to a RVOL of 5).
RVOL = Current Volume / Average Volume over a certain period
This strategy indicates a Buy signal when 2/3 conditions are met:
- RSI Cross Over the Over Sold signal (default 30)
- MACD Cross Over of Signal ( MACD > Signal)
- RVOL Cross Over of 2 (RVOL > 2)
This strategy indicates a Sell signal when 2/3 conditions are met:
- RSI Cross Under the Over Bought signal (default 70)
- MACD Cross Under of Signal ( MACD < Signal)
- RVOL Cross Under 5 (RVOL < 5)
Enjoy and leave feedback!

Combo Backtest 123 Reversal & Finite Volume Elements (FVE) This is combo strategies for get a cumulative signal.
First strategy
This System was created from the Book "How I Tripled My Money In The
Futures Market" by Ulf Jensen, Page 183. This is reverse type of strategies.
The strategy buys at market, if close price is higher than the previous close
during 2 days and the meaning of 9-days Stochastic Slow Oscillator is lower than 50.
The strategy sells at market, if close price is lower than the previous close price
during 2 days and the meaning of 9-days Stochastic Fast Oscillator is higher than 50.
Second strategy
The FVE is a pure volume indicator. Unlike most of the other indicators
(except OBV), price change doesn?t come into the equation for the FVE (price
is not multiplied by volume), but is only used to determine whether money is
flowing in or out of the stock. This is contrary to the current trend in the
design of modern money flow indicators. The author decided against a price-volume
indicator for the following reasons:
- A pure volume indicator has more power to contradict.
- The number of buyers or sellers (which is assessed by volume) will be the same,
regardless of the price fluctuation.
- Price-volume indicators tend to spike excessively at breakouts or breakdowns.
WARNING:
- For purpose educate only
- This script to change bars colors.

VRSI-MARSI StrategyI wanted to create an indicator which resembles price movement, aside to volume movement.
The "yellow-blue" line is the MA(5) of the RSI (9) of closing price.
The "orange" line is the MA(5) of the RSI (9) of Volume .
(Default plot of RSI and VRSI is not visible but can be made visible ("Settings" > "Style" > set "Opacity" of "RSI & VRSI"))
The Long (Buy) condition is triggered when the MA(5) of the RSI (9, close) goes up.
The Short (Sell) condition is triggered when the MA(5) of the RSI (9, close) goes down.
Comparing the price movement with the "orange" Volume line helps to spot a possible trend change,
for example when price goes up and an ascending Volume line starts to flatten or starts descending,
this could be a sign that the Bullish trend is weakening, predicting a possible trend change.
Or, when for example a downwards price movement is accompanied with a rising Volume line, this can be a sign of large Bearish power.
Because it still is a RSI indicator, the midline (50), and Oversold/Overbought area's (20-30 & 70-80) are important to watch, especially the MARSI!
A second strategy is made (VRSI-MARSI Strategy 2) where the Long/Short condition is triggered when "MA RSI (close) - MA RSI ( Volume )" crosses.
-------------------------------------------------------------------------------------------------------------------------------------------------------------------------
The Long & Short entries, as well as the Entry Close are visible 1 bar after the trigger.
When the blue line changes in a yellow line (and vice versa) it will show a candle earlier (see yellow dashed lines = (1)).
Also, the condition is fulfilled when the candle closes (2), but the order doesn't take place in the same bar, but the next (3).
Because this is a strategy the "actual Order" will not take place at the "Close" of the candle (2), but at the "Open" at the NEXT candle (3).
I also have this strategy as a study (A+B), where the "Buy" & "Sell" shows a candle earlier.
-------------------------------------------------------------------------------------------------------------------------------------------------------------------------
The entries are default 5% of equity, without pyramiding, which already gives large profits.
A large part of the profit is because of the Entry Close of the Long & Short entries.
You can easily turn these off (Settings > Inputs) to see what profit the strategy gives without Entry Close.
Here they are disabled:
-------------------------------------------------------------------------------------------------------------------------------------------------------------------------
More information available in the script ;-)

Positive Volume Index Backtest The theory behind the indexes is as follows: On days of increasing volume,
you can expect prices to increase, and on days of decreasing volume, you can
expect prices to decrease. This goes with the idea of the market being in-gear
and out-of-gear. Both PVI and NVI work in similar fashions: Both are a running
cumulative of values, which means you either keep adding or subtracting price
rate of change each day to the previous day`s sum. In the case of PVI, if today`s
volume is less than yesterday`s, don`t add anything; if today`s volume is greater,
then add today`s price rate of change. For NVI, add today`s price rate of change
only if today`s volume is less than yesterday`s.
You can change long to short in the Input Settings
WARNING:
- For purpose educate only
- This script to change bars colors.

Negative Volume Index Backtest The theory behind the indexes is as follows: On days of increasing
volume, you can expect prices to increase, and on days of decreasing
volume, you can expect prices to decrease. This goes with the idea of
the market being in-gear and out-of-gear. Both PVI and NVI work in similar
fashions: Both are a running cumulative of values, which means you either
keep adding or subtracting price rate of change each day to the previous day`s
sum. In the case of PVI, if today`s volume is less than yesterday`s, don`t add
anything; if today`s volume is greater, then add today`s price rate of change.
For NVI, add today`s price rate of change only if today`s volume is less than
yesterday`s.
You can change long to short in the Input Settings
Please, use it only for learning or paper trading. Do not for real trading.

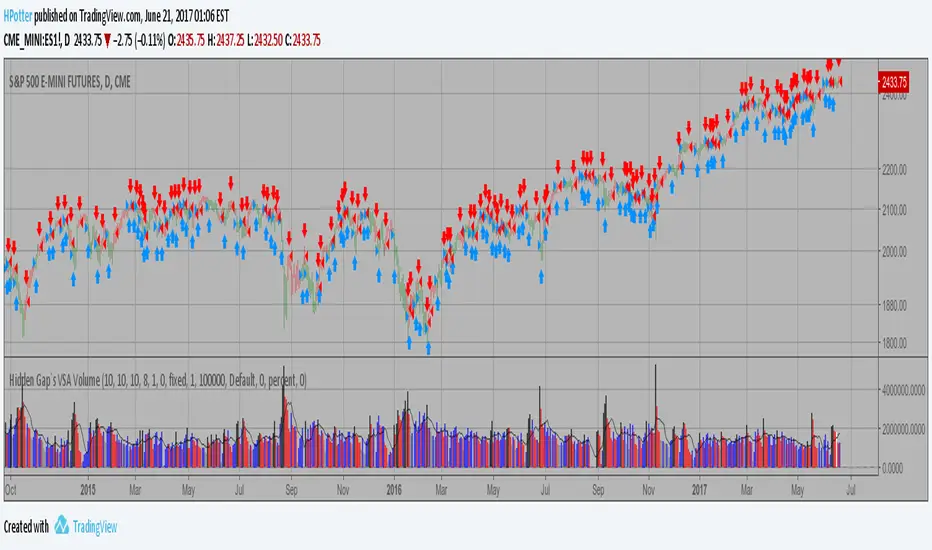
Hidden Gap`s VSA Volume If Volume is less then the previous 20 intervals, Volume is gray.
If Volume is greater then the previous 40 intervals, Volume is black.
If Volume is less then the previous 2 intervals, Volume is purple.
If Volume is less then the previous, Volume is red.
If Volume is greater then the previous, Volume is blue.
Other - white.
You can add on the indicator a 2.5 Standart Deviation of a 20 period
Bollinger Band Shifted 3 periods forward.
You can change long to short in the Input Settings
Please, use it only for learning or paper trading. Do not for real trading.