Strength of MovementCRYPTO TRADERS PRO
This script is designed to generate a comparison of price action against historical movements. To complete this, the following are calculated:
Average price actions close vs previous close;
A baseline of price actions over x periods;
A baseline of volume over x periods; and
A percentile movement for volume when compared to it's baseline
From these calculations; we can infer a ratio for the below moves:
Price is increasing w/ increasing volume
Price is increasing w/ decreasing volume
Price is decreasing w/ increasing volume
Price is decreasing w/ decreasing volume
From here; we can establish a pattern and identify momentum changes and 0-cross trade opportunities.
By factoring in a STOP LOSS factor; as well as a buffer to mitigate false crosses; historic tests can be fined tuned for relative cryptocurrencies. For example; BTCUSD - with a buffer of '2' - provides a test result of 40% returns with a 0.812 Sharpe Ratio.
Pesquisar nos scripts por "volume"

VWMA + SMA BBollinger + RSI Strategy (ChartArt) mod by BiO618This is a script I remade from the original ChartArt's "CA_RSI_Bolling_Strat".
I added a VWMA following the SMA basis curve.
BBand was made with the SMA curve, +2DS.
The point of adding VWMA to the script is to get a fast correlation between price change and volume change.
How to interpret it:
Since 3-Intervals-VWMA = (P1*V1 + P2*V2 + P3*V3) / (V1+V2+V3)
As the volume grows, VWMA get smaller.
If the price goes to the upper band, and the VWMA follows it, Price grew more than Volume, and a correction would happen soon.
If the price goes to the lower band, and the VWMA follows it, Price dipped with a lot of Volume, and a continuation of trend would be expected.
If the price goes to the upper band, and the VWMA stays close to SMA, Price grew with a correspondient Volume, and the continuation of trend would be expected.
If the price goes to the lower band, and the VWMA stays close to SMA, Price dipped with low Volume, a correction would happen soon.
Remember that NO INDICATOR is flawless, support your interpretation with other indicators like RSI and MACD.
Hope you enjoy it!
φ!

NGRN MACD-X & RSI v4 STRATEGYMACD-X, RSI & Volume Indicator Strategy - Version 4
Overview
This strategy and it's associated study were modeled after the famous Philakone described algorithms on his now defunct instructional video series.
This indicator allows for full customisation of parameters and interaction between three indicators that allow users to shape their trading methods to their desired goals. This associated strategy also allows users to backtest the study alerts script and find the best settings towards that end.
MACD + RSI + VOLUME - are of the most powerful and widely usded indicators, MACD/Histogram crosses, coupled with RSI & Volume increases/decreases will detects areas of deeply oversold / overbought and buys/sells on the reversal
Features
Full customisation - All parameters are open for customising to allow the trader to build their own strategy and adapt from market to market.
Clean/Simple UI - Facilitating ease of use.
Enable Buying OR Selling, - or have them both active at the same time.
Toggle off and on ALTERNATING Buy and Sell feature (pyramiding) - to allow for consecutive DCA style buys or SCALING out of an entry (partial sell).
Customizable Stop-Loss plot - to enable users to create a STOP-LOSS alert option or other alert(s) based on the plot location.
Toggle Auto Stop-Loss sell option - to enable users choose whether or not to automatically issue a sell signal when close crosses stop loss plot, or choose to toggle off if not profitable.
Customizable Take-Profit plot - to enable users to create a TAKE-PROFIT alert option or other alert(s) based on the plot location.
Study and associated Strategy - to use the TradingView ‘Strategy Tester’ back-testing features to find the best alert settings for specific coins in bear, bull and sideways markets.
Changes Version 4
Improved STOP-LOSS plot draw.
Added the option to automatically sell when stop-loss cross triggered or have the option disabled, in the event a better profit can be achieved.
Added new TAKE-PROFIT plot (aqua line) to visually guide users where to place the TAKE-PROFIT parameter as well as give users options to create alerts based on the TAKE-PROFIT plot.
Access
Full Access is 0.1 ETH , one time fee for LIFETIME access to the STUDY indicator, STRATEGY and future updates as well as support and SETTINGS for various markets on the Binance Exchange.
Settings
SCREENSHOT LINKS:
BUY SETTINGS: prntscr.com
SELL SETTINGS: prntscr.com

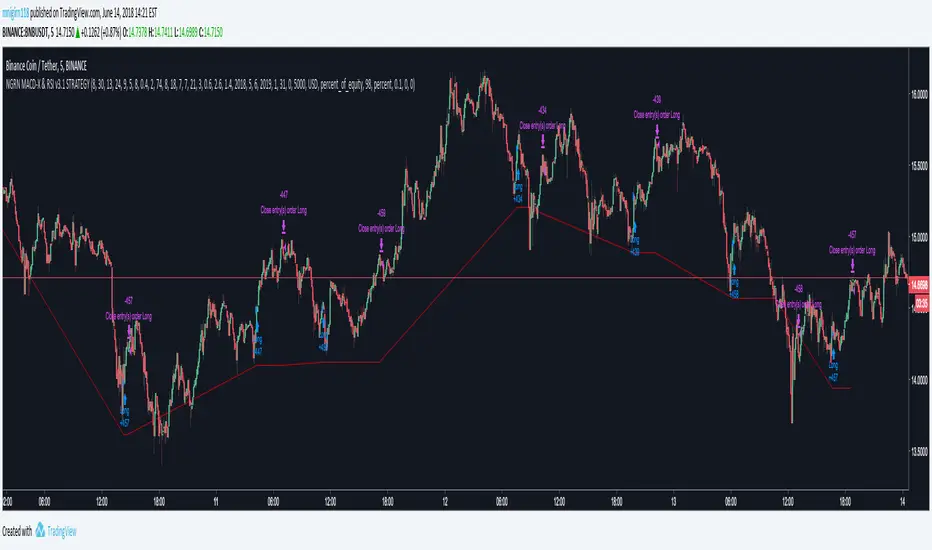
NGRN MACD-X & RSI v3.1 STRATEGYMACD-X, RSI & Volume Indicator Strategy - Version 3.1
Overview
This strategy and it's associated study were modeled after the famous Philakone described algorithms on his now defunct instructional video series.
This indicator allows for full customisation of parameters and interaction between three indicators that allow users to shape their trading methods to their desired goals. This associated strategy also allows users to backtest the study alerts script and find the best settings towards that end.
MACD + RSI + VOLUME - are of the most powerful and widely usded indicators, MACD/Histogram crosses, coupled with RSI & Volume increases/decreases will detects areas of deeply oversold / overbought and buys/sells on the reversal
Features
Full customisation - All parameters are open for customising to allow the trader to build their own strategy and adapt from market to market.
Clean/Simple UI - Facilitating ease of use.
Enable Buying or Selling, - or have them both active at the same time.
Toggle off and on ALTERNATING Buy and Sell feature (pyramiding) - to allow for consecutive dollar cost averaging style buys or SCALING out of an entry (partial sell).
Customizable Stop-Loss plot - to enable users to create a STOP-LOSS alert option or other alert(s) based on the plot location. See settings screenshot.
Study and associated Strategy - to use the TradingView ‘Strategy Tester’ back-testing features to find the best alert settings for specific coins in bear, bull and sideways markets.
Changes Version 3.1
UI consolidates reduntant script inputs making the script easier to use.
Fixes STOP-LOSS algorithm.
Adds a STOP-LOSS Plot (red line) to enable users to create a STOP-LOSS alert option or other alert(s) based on the plot location. See settings screenshot.
Access
Full Access is 0.1 ETH , one time fee for LIFETIME access to the STUDY indicator, STRATEGY and future updates as well as support and SETTINGS for various markets on the Binance Exchange.
Settings
BUY SETTINGS: prntscr.com
SELL SETTINGS: prntscr.com
STOP-LOSS SETTINGS : prntscr.com
NGRN MACD-X & RSI v2 STRATEGYMACD-X, RSI & Volume Indicator Strategy - Version 2.0
Overview
This strategy and it's associated study were modeled after the famous Philakone described algorithms on his now defunct instructional video series.
This indicator allows for full customisation of parameters and interaction between three indicators that allow users to shape their trading methods to their desired goals.
This associated strategy also allows users to backtest the study alerts script and find the best settings towards that end.
MACD + RSI + VOLUME - are of the most powerful and widely usded indicators, MACD/Histogram crosses, coupled with RSI & Volume increases/decreases will detects areas of deeply oversold / overbought and buys/sells on the reversal
Features
Full customisation - All parameters are open for customising to allow the trader to build their own strategy and adapt from market to market.
Toggle Buying and Selling, or have them both active at the same time.
Toggle off and on ALTERNATING Buy and Sell feature to allow for consecutive DCA style buys or SCALING out of an entry (partial sell).
Access
Full Access is 0.07 ETH, one time fee for full unlimited access to the indicator, strategy and future updates as well as support and SETTINGS for various markets on the Binance Exchange (currently only USDT)

SW SVE - Stochastic+Vol+EMAs [Sergio Waldoke]Script created by Sergio Waldoke (BETA VERSION v0.5, fine tuning PENDING)
Stochastic process is the main source of signals, reinforced on buying by Volume. Also by Golden Cross.
Selling is determined by K and D entering overselling zone or EMA's Death Cross signal, the first occurring,
and some other signals combined.
Buy Long when you see a long buy arrow.
Sell when you see a close arrow.
This is a version to be tuned and improved, but already showing excelent results after tune some parameters
according to the kind of market.
Strategy ready for doing backtests.

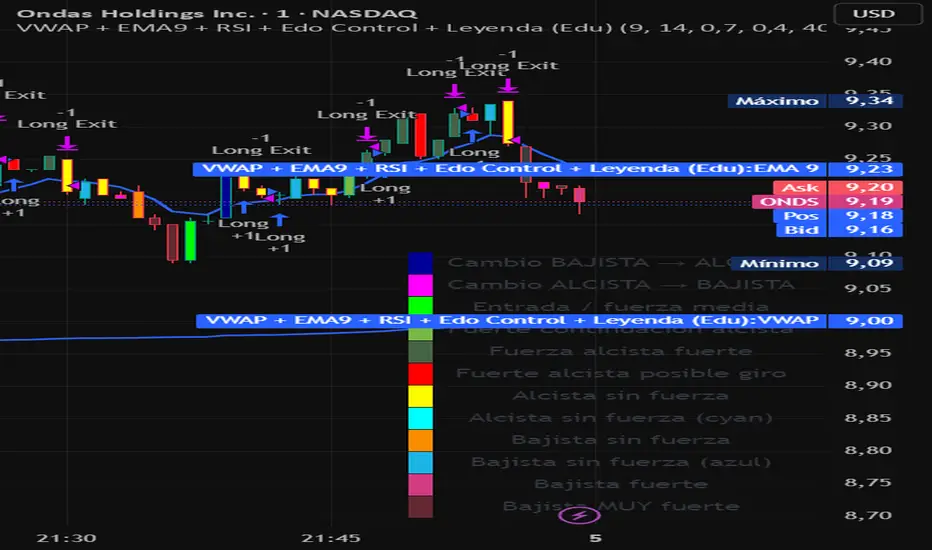
VWAP + EMA9 + RSI + Edo Control (Edu)VWAP + EMA9 + RSI + Edo Control (Edu)
A complete intraday scalping system that combines institutional levels, fast trend signaling and enhanced candle-color analysis for maximum clarity and confirmation.
This indicator includes:
1. VWAP (Volume Weighted Average Price)
The institutional reference line used to determine value zones, liquidity bias and directional pressure.
2. EMA9 (Fast Exponential Moving Average)
A micro-trend guide that reacts quickly to short-term movements and improves timing on pullback entries.
3. RSI (Relative Strength Index)
A clean momentum filter using the classic >50 (bullish) and <50 (bearish) bias.
Edo Control – Advanced Colored Candle System
This version integrates Edo Control, a custom candle-color engine that visualizes market strength shifts based on Williams %R, directional movement and ADX behavior.
Each candle color represents a different market condition, such as:
Trend acceleration
Trend weakening
Possible reversals
Momentum spikes
Bullish or bearish pressure
Transition zones
A built-in movable legend explains the meaning of each color directly on the chart, so traders can identify conditions instantly without guessing.
Why this indicator works
The combination of VWAP + EMA9 + RSI + colored candle strength creates a multi-layer confirmation system that cuts noise and highlights only meaningful setups.
Designed for 1m, 3m, 5m charts, but also effective on higher timeframes.
Suitable for: stocks, indices, futures, forex, crypto.
Adaptive Averaging Concept [NeuraAlgo]Adaptive Averaging Concept
A Quant-Engineered Dynamic Position Sizing & Optimization Framework
Adaptive Averaging Concept™ is a next-generation, research-driven trading framework that combines multistage entries, ATR-based intelligent scaling, real-time sentiment filtering, and a fully automated optimization engine.
It is designed for traders who want precision execution, adaptive risk control, and an architecture capable of learning from market structure.
🔹 Core Concept
Unlike traditional averaging or DCA methods, this engine uses Adaptive Averaging — a controlled, mathematically tuned accumulation system that adjusts entries based on volatility, trend conditions, and signal confidence.
Each additional entry intelligently recalculates average price and updates a volatility-sensitive dynamic Take Profit.
🔹 Main Features
1. Intelligent Multi-Stage Entry System
Initial entries triggered by SMA crossover, rising volume, or Always-On mode
Secondary entries triggered only when price retraces by a volatility-adjusted threshold
Every added position recalculates:
Total quantities
Capital distribution
Average price
Adaptive Take Profit (ATR-based)
2. Adaptive Risk & Position Management
ATR-driven take-profit using Exit Sensitivity
ATR-driven add-entry logic using Exit Tuner
Dynamic or Fixed lot sizing
Capital-per-entry control
Automatic minimum lot protection
3. High-Level Market Filters
Trend Filter
A volatility-normalized EMA slope filter that identifies:
1.Bullish trend
2.Bearish trend
3.Neutral trend
Sentiment Cloud Filter
A structural sentiment engine analyzing:
1.Micro-gaps
2.Bull and bear pressure
3.Range compression
4.Market regime bias
Trades only execute when filters align with your directional bias.
4. NeuraAlgo Optimization Engine
The strategy includes a built-in optimizer allowing you to test & tune with no loops and no external computation.
You can automatically optimize:
Smooth Period (ATR)
Exit Sensitivity
Exit Tuner
SMA Period
Trend Filter Length
Trend Filter Smooth
Sentiment Cloud Period
Optimization Goals:
Maximize Winrate
Maximize Net Profits
This allows the strategy to self-configure based on live market conditions.
Here, the optimization is finally complete.
🔹 Summary
Adaptive Averaging Concept™ is not a simple indicator or basic DCA script.
It is a complete quant-grade execution engine capable of dynamically adjusting its behavior to volatility, price structure, trend strength, and sentiment.
Engineered for traders who demand:
High-precision entry logic
Adaptive position sizing
Volatility-calibrated exits
Smart accumulation
Built-in optimization
Professional-grade backtesting
It is a powerful framework suitable for swing traders, intraday traders, and automated system developers.

HMA+RVOL Strategy Hariss 369The Hull Moving Average (HMA) is a smooth, fast, and highly responsive moving average created by Alan Hull. It reduces lag significantly while still maintaining smoothness, making it one of the most popular tools for trend detection and entries. It is widely used for trend filter. Hull Moving Average(HMA) with RVOL strengthens the trend as volume is prime factor of price movement.
Trading with HMA: Simple method is buy when price closes above HMA , stop less below the low of last candle and target is 1.5 or 2 times of stop loss. The reverse is for sell. The HMA automatically turns to green on bull trend and red on bear trend for better visual confirmation.
Adding RVOL to HMA is better method of trading. Buy signal is initiated when price closes above HMA and RVOL is greater than 1.2. Sell signal is initiated when price closes below 89 HMA and rovl is greater than 1.2. One can change the value of RVOL according to trading style and type asset being traded.
It is a back tested strategy.

Hull VWMA Crossover StrategyA simple variation on the Hull Moving Average which reacts faster to high volume events, making it more responsive in those cases than even the standard Hull average -- CREDIT GOES TO Saolof - -- Edited into a strategy with some more options that im going to continue to refine. LMK if theres any features or confluence you want me to add -- cheers!


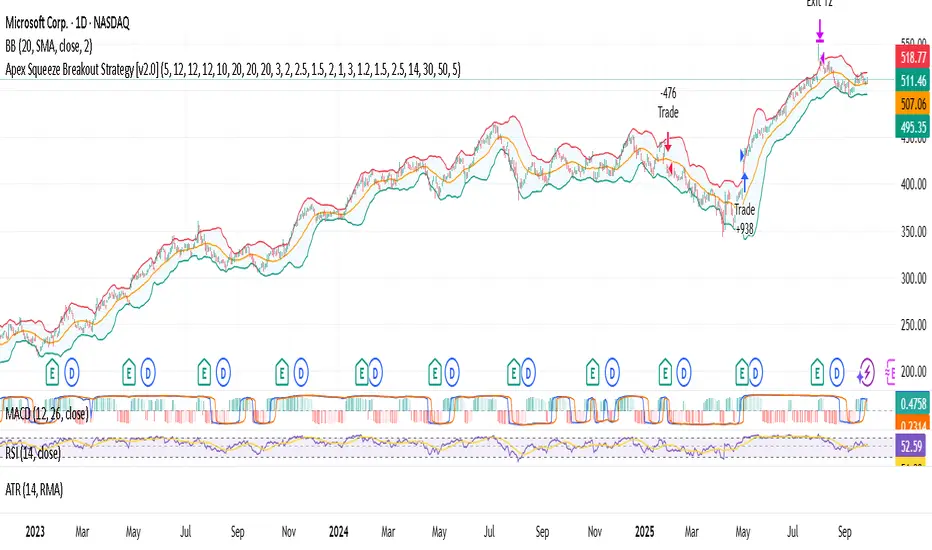
Apex Squeeze Breakout Strategy (v1.0 by SKC)The Apex Squeeze Breakout Strategy is a powerful momentum-based system designed to capture explosive price moves following periods of low volatility compression (squeeze). It combines five key conditions to validate high-probability breakouts:
🔵 TTM Squeeze Detection using Bollinger Bands and Keltner Channels
🔊 Volume Spike Confirmation relative to a moving average
📈 Breakout Trigger above/below a recent high/low range
💪 Momentum Acceleration using percentage change over time
♻️ RSI Recovery / Overbought Logic to confirm shift in strength
The strategy includes:
Configurable swing/day trading modes
Dynamic ATR-based Stop Loss and TP1/TP2 system
Modular input structure for easy customization
Clear entry/exit visual markers and trade zones
It’s designed for disciplined traders who want to catch high-energy moves after consolidation, suitable for both intraday and swing setups.
BB Squeeze + Keltner Breakout + VolumeHow the Strategy Works
Bollinger Bands Squeeze: The strategy first looks for a "squeeze" in the Bollinger Bands. This happens when the bands narrow significantly, indicating a period of low market volatility and potential consolidation. The bbSqueeze variable becomes true when the Bollinger Bandwidth falls below a set
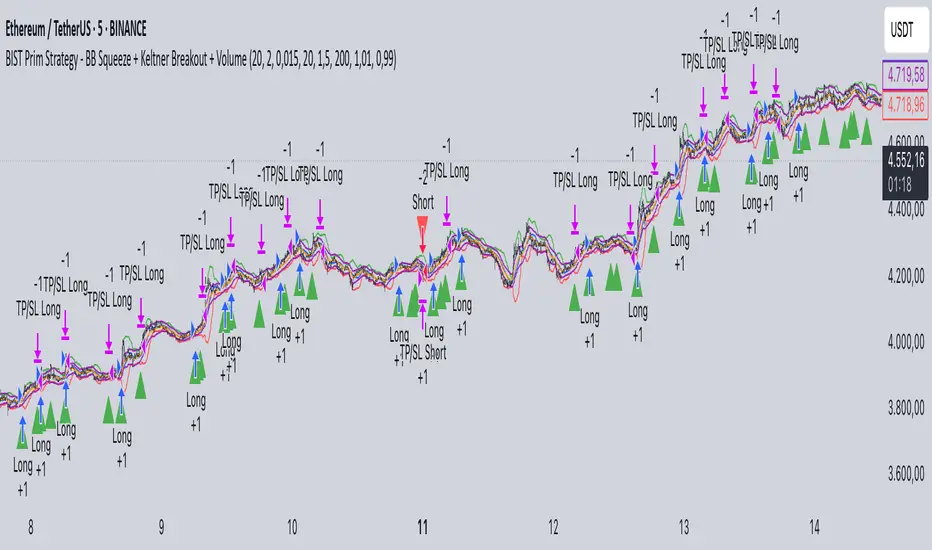
Intraday set up - RSI +MACDIntraday setup using RSI + MACD + Multi-Timeframe EMA 50 + Volume as confluence
EMA Crossover with Volume + Stacked TP & Trailing SLI am relatively new here. Here is my humble contribution to the community. Simple does it! Ema 21,55 with volume. Surprisingly high win rates and good profit factors on USDJPY, EURJPY, BTCUSD, XAGUSD,XAUUSD, USOIL, USDCAD, EURGBP and AUDNZD. I cannot write a single line of code. I used Copilot for this.

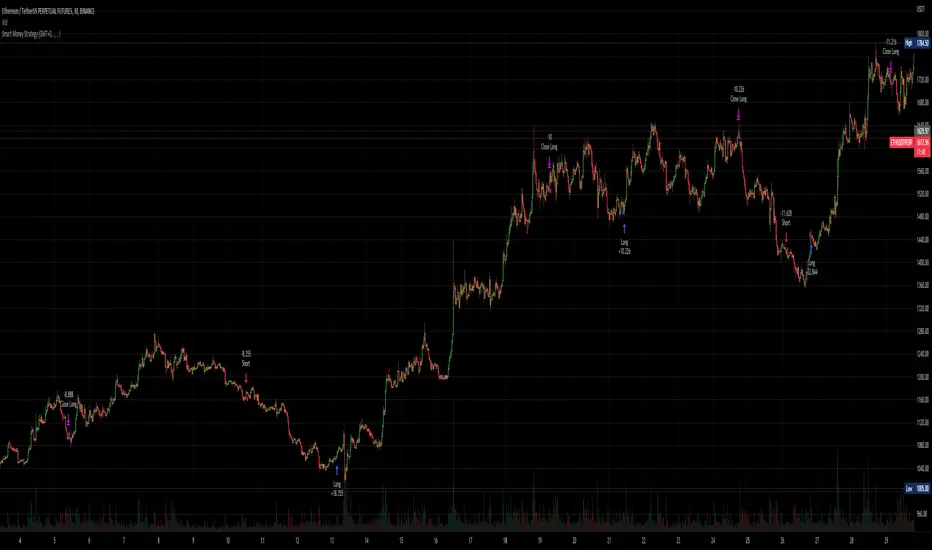
Smart Money - Oscillator and Volume StrategyOverview
This is a no-repaint strategy that is highly optimized for BINANCE:ETHUSDTPERP 30m, normal candles. It is a long/short strategy that is based on CMF, ADX/DMI, Keltner Channels, and other oscillators to identify smart money.
The overall idea of the strategy is to effectively capture the beginnings and ends of trends in price action, and go long/short accordingly. To achieve this, potential entry points are identified with various oscillators and these are then filtered using a variety of moving averages and strength/momentum indicators.
Short and sell inflections are found when ADX, DMI, and/or CMF oscillate below a specified threshold, and Keltner Channels are also used to indicate potential trades.
The indicator will continue to be updated and optimized for current and future market conditions.
If purchased, access to the indicator will be available within 24 hours.
Backtest Results
Parameters:
- 2021-01-01 to present (19 months)
- 100% equity order size
- 0.04% commission fees
- No leverage
17,089% net profit through 296 trades with 60.47% of trades being profitable.
Profit factor of 2.862, Sharpe Ratio of 1.158
Parameters:
- 2021-01-01 to present (19 months)
- $1,000 initial capital
- $1,000 order size
- 0.04% commission fees
- No leverage
584% net profit through 296 trades with 60.47% of trades being profitable.
Parameters:
- 2021-01-01 to present (19 months)
- 500% equity order size
- 0.04% commission fees
- 5x leverage
8,587,557% net profit through 299 trades with 59.87% of trades being profitable.
Crypto_Troll_Turtle_StrategyTurtle Strategy for high marketcap cryptocurrencies
I'm glad to launch my strategy which is based on
moving averages / bollinger bands / RSI and volume
It's basically made for scalping with an interesting return over the last two years and a perspectively low drawdown
if you're interested in the strategy and you want to use it for futures trading you can contact me for a money & risk management rules that you can use and prevent you from a huge loss !! it's for free don't worry xD you can find my contact in the author's instructions' label
The optimal timeframe to use is 1H
I'll be trying to launch telegram signals for this strategy as soon as possible for the following pairs: BTCUSDT ETHUSDT BNBUSDT timeframe: 1H
I'm open to all reviews ! thanks !

Buy/Sell StratThis strategy will produce a buy or sell signal when the following criteria are met:
9 EMA crosses 21 EMA
Recently closed candlestick has 15% higher average volume than previous 5 candles
A candlestick reversal pattern
Price crosses 9 EMA
Feel free to use and modify as you see fit. Happy trading!

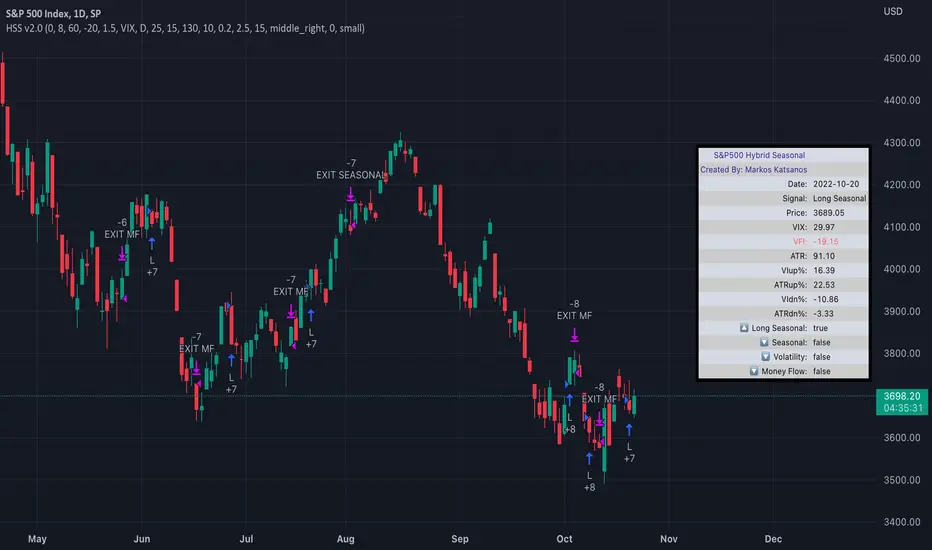
TASC 2022.04 S&P500 Hybrid Seasonal System█ OVERVIEW
TASC's April 2022 edition of Traders' Tips includes the "Sell In May? Stock Market Seasonality" article authored by Markos Katsanos. This is the code implementing the "Hybrid Seasonal System" from the article.
█ CONCEPTS
In his article, Markos Katsanos takes an updated look at the "Sell in May" adage by reviewing recent historical data for seasonal equity market tendencies. The author explores the development of a trading strategy (a set of buy and sell rules) based on this research.
He starts from the enhanced buy & hold system featured in his July 2021 TASC article, and adds additional technical conditions. These include volatility conditions ( VIX and ATR ) plus the "Volume Flow Indicator" (VFI), which is a custom money flow indicator that Katsanos introduced in his June 2004 TASC article. He provides an example of a trading system that others can test for themselves and modify as they see fit. The author notes that the system could likely be improved further by adding money management conditions (such as a stop-loss), or by adding more technical conditions not considered in the scope of this article.
█ CALCULATIONS
The entry and exit rules that constitute the trading system are defined below. The critical values of VIX, ATR and VFI (specified below) used in the calculations were determined by optimization for a daily chart of the SPY ETF . By default, the strategy only allows long entries. However, the script offers the possibility to initiate short entries upon exiting long trades through the "Long Only" toggle in the script's inputs.
Long Entry Rules
• Seasonal: The seasonal trade is initiated on the first business day October at the open.
• Volatility: In case of high volatility, that is if the VIX is above 60% or the 15-day ATR was above 90% over the past 25 days, the seasonal trade is deferred until later in the month or year, when the volatility subsides.
Exit/Short Entry Rules
• Seasonal: The exit/short signal is triggered on the first business day of August at the open.
• Volatility: The exit/short signal is triggered if VIX is above 120 % (i.e. 2 times the corresponding threshold parameter).
• Money flow (VFI): The exit/short signal is triggered if the VFI crosses under a critical value (-20) while its 10-day moving average is pointing down.
Join TradingView!
Strategy - Cryptosystem NNFX wayFirst script done!
This is my version of the No-Nonsense Forex (NNFX) Strategy
This strategy shows you the entry and exit signal with a standard 1.5 x ATR for Stop Loss and 1 x ATR for Taking Profit. You can adjust the settings to your needs.
This strategy uses 5 indicators:
1. Average True Range for SL and TP placement, there is a nuance where you can add the 1XATR Rule;
2. SMA used to filter longs and shorts;
3. SSL Channel for 1st Confirmation;
4. DPO for 2nd Confirmation;
5. Waddah Attar Explosion as a volume indicator.
There is no exit indicator because I coded 2 trades (2x0.5). TP1 will be at 1xATR and TP2 will automatically trail behind with 1.5XATR. You can see the red trailing line on the charts.
Other exits can be: When SSL gives opposite signal or when price crosses and closes your baseline.
I used this system for 1D timeframe.
Hopefully this can be usefull for your tradingstyle.
Would be great if you guys leave a like.
Thanks!

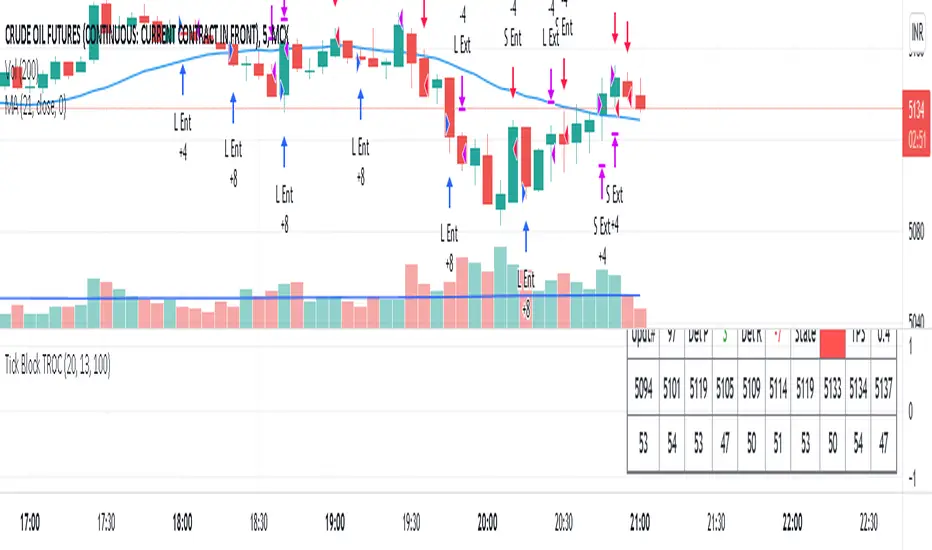
Up Down RatioWORKS ONLY IN LIVE MARKET. NO BACK TESTING POSSIBLE.
A Tick block is defined as a set of last 'n' ticks. 'n' is user specified and default is 100.
Script calculates the ratio of upticks to downticks in every tick block. This is called UDR (up down ratio)
It also calculates the lowest price in the tick block.
The price lows (in each block) are matched with UDR and looks for convergence or divergence.
Script generates entry and exit signals based on convergence/ divergence.
Profit and loss can be user defined.
Default settings work for CRUDE OIL (Indian Rupee)
Convergence is Bullish
Divergence is Bearish.
Ticks per second for the last tick block is displayed as TPS.
TPS may be used to gauge activity level and co-relates largely with volume acceleration.
[Joy] Jasmine Strategy for Bitcoin and CryptoIt is my strategy I use for spot and future trading, mostly for BTCUSD
Notable parameters used:
INDEX:BTCUSD
Data: 2017 - today
Long trade margin/leverage: 8x (50/8 = 6.25)
Short trade margin/leverage: 1x (50/50 = 1)
Commission: 0.075%
Initial Capital: $15, 000
Results:
Net profit: 832.74 %
Buy & Hold: 602.56 %. It beats the buy and hold.
Percent profitability: 88 % . It means 8 out of 10 trades resulted in profits.
Margin Calls: 0 (i.e. Never had a margin call according to backtest from 2017 till today)
Total closes trades: 25
Profit factor: 8.238
Avg Winning Trade: 43.08 %
Largest Winning Trade: 334.85 %
Avg # Bars in Winning Trades: 44 (i.e. 88 days)
Sharpe Ratio: 0.61. A Sharpe ratio under 1.0 is considered sub-optimal. Because of the big swings, I cannot make the Sharpe ratio any better at this time.
Sortino Ratio: 5.153. I think a Sortino ratio of 3.0 or higher is considered excellent. Do your research.
I am using 7.1% stop loss on long trades. However, you can turn off the stop loss and note the profitability remains the same.
Do remember there may be other costs, such as funding costs.
Description:
The strategy hunts for a few market features, namely breakouts, abnormal wicks relative to the body, abnormal volume relative to the candle characteristics, and possible confirmation of all these. It also hunts for more aspects. It gives a relative score of each of the characteristics. Finally, it tries to draw a guesstimate. In the end, it is only a guesstimate. Users see the final outcome (buy/sell etc). The whole logic happens at the background.
The strategy is not to be used for scalping, day trading or swing trading. In other words, it is not suitable for trading in a lower timeframe. It is to be used for Positional Trading For example, if one is trying this for BTCUSD, one may only try this for BTCUSD in a 2day timeframe and not in lower timeframes (such as 4 hours or 1 hour etc.) I am primarily interested in BTC for my research. However, it may be tested on other cryptos as well with varying degrees of results.
Please remember that past performance does not be indicative of future results. Different types of investments involve varying degrees of risk. There can be no assurance that the information referred to directly or indirectly in this strategy will be profitable, equal to any corresponding historical performance level(s), or suitable for you in any form or shape. Market condition changes very fast. Moreover, it would be best if you did not assume that any discussion or information contained here serves as the receipt of, or as a substitute for, personalized investment advice. I am not a financial advisor. I have no qualifications to be a financial advisor. It is only for educational and research purposes. Readers are encouraged to consult with a professional advisor of his/her choosing. Neither I nor my indicators or strategies take any responsibility for any misuse of the information for any actual trading. Even though this strategy did 88% profitability from 2017-2021, it may do poorly and may even be NOT profitable in the future.

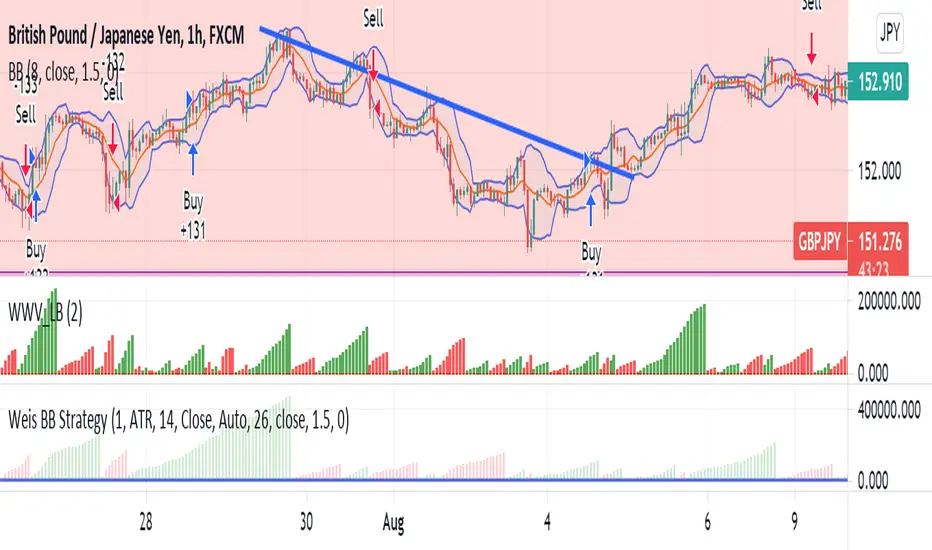
Weis BB StrategyThis is a strategy based on Weis Wave & EMA. Weis Wave Volume is used to determine the overall trend and Bollinger Band to determine the Price breaking out from resistance zones.