Trend Cloud with Buy/Sell Text [wjdtks255]Indicator Title: Trend Cloud with Buy/Sell Signal Pro
Short Description
A high-probability trend-following indicator based on Supertrend dynamics, enhanced with a Volume Filter to pinpoint explosive entries while minimizing false breakouts.
Detailed Description (Overview)
The Trend Cloud with Buy/Sell Text is designed for traders who prioritize clarity and momentum. It visualizes market trends through a "Trend Cloud" system and generates real-time BUY/SELL signals only when price action is backed by significant trading volume.
Key Technical Pillars
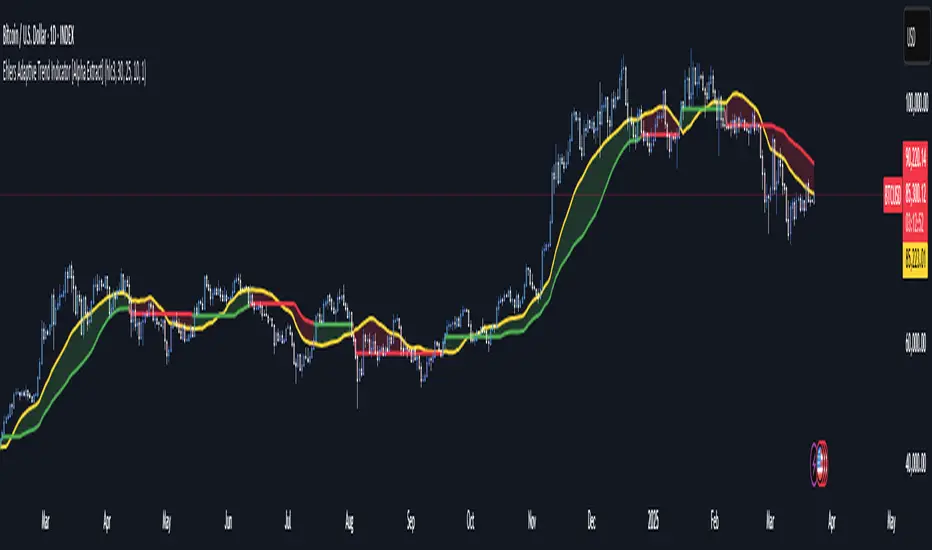
Dynamic Trend Cloud: Fills the area between the price and the Supertrend line, providing immediate visual feedback on trend strength and potential support/resistance zones.
Smart Volume Filter: A unique logic that compares current volume against a 20-period moving average. Labels only appear when a trend shift occurs with above-average volume, filtering out weak "fakeouts."
No-Repaint Labels: Signals are calculated and fixed at the close of the candle, ensuring that the BUY/SELL text remains permanent for reliable historical backtesting and live execution.
The Alpha Hunter Strategy (How to Trade)
1. Long Entry (Buy)
Condition: The cloud turns Aqua and a "BUY" label appears below the candle.
Confirmation: Ensure the price remains above the Aqua Trend Line.
Volume Check: The indicator automatically verifies if the volume is higher than the 20-period average before displaying the label.
Exit: Exit when a "SELL" signal appears or the price closes below the Aqua line.
2. Short Entry (Sell)
Condition: The cloud turns Red and a "SELL" label appears above the candle.
Confirmation: Price should stay below the Red Trend Line.
Exit: Exit when a "BUY" signal appears or the price closes above the Red line.
Input Parameters & Optimization
ATR Period (Default: 10): Determines the sensitivity to price volatility.
ATR Factor (Default: 3.0): Controls the distance of the trend line. Increase to 3.5 - 4.0 to reduce noise in choppy markets.
Volume Filter (Toggle): When enabled, only high-momentum signals are shown.
Recommended Usage
Best Timeframes: 15m, 1h, 4h.
Asset Classes: Highly effective for Crypto (BTC/ETH) and high-volume stocks.
Indicador Pine Script®