ORB Breakout Strategy w/ Filters - Dynamic Sizing - MTFHere is a comprehensive description of the strategy, written in a clear and structured format. You can use this for your script's "how-to-use" guide or documentation.
---
## 📈 Opening Range Breakout (ORB) Strategy
This is a comprehensive, multi-timeframe strategy built for trading opening range breakouts. It is designed with a "filters-first" approach, allowing you to validate a breakout with trend, volume, and volatility.
The strategy's core power comes from its flexibility. You can trade on a low timeframe (like a 1-minute chart) while basing your breakout levels on a higher timeframe's opening bar (e.g., the first 15-minute bar). It includes dynamic position sizing based on risk and a wide array of advanced exit management options.
### Key Features
* **Multi-Timeframe Opening Range:** The core of the strategy. You can define the "Opening Range" timeframe (5, 10, 15, 30, or 60 min) *independently* of your chart timeframe.
* **Custom Trading Session:** Define the exact session (e.g., "0930-1600" in "America/New_York") you want to trade.
* **One Trade Per Session:** The strategy will only take the *first valid breakout* signal per day to avoid over-trading.
---
### 🚦 Entry Signals & Filters
A trade is only initiated when the price closes above the Session High or below the Session Low **AND** all active filters are passed.
* **Trend Filter:** (Optional) Requires price to be above a long-term MA (e.g., 100 EMA) for long trades and below it for short trades.
* **Volume Filter:** (Optional) Requires the breakout bar's volume to be a specified multiplier (e.g., 1.5x) of the recent average volume.
* **Volatility Filter:** (Optional) Requires the current ATR to be higher than its long-term average, ensuring you only trade during periods of expanding volatility.
* **Direction Filter:** Allows you to isolate the strategy to **Long Only**, **Short Only**, or **Both**.
---
### 💰 Dynamic Position Sizing
The strategy includes a robust "Risk %" sizing model.
* **Risk-Based Sizing:** Instead of fixed contracts, it calculates the position size based on your **Account Size**, **Risk % per Trade**, and the **Stop Loss distance**.
* **Auto-Detect Point Value:** It automatically detects the correct point value for popular futures contracts (ES, NQ, MES, MNQ) and provides a manual override for other assets.
---
### 📤 Exit & Risk Management
This strategy features a multi-layered exit system, giving you complete control over how trades are managed.
#### 1. Stop Loss (SL)
Your initial stop loss can be calculated using a fixed **Tick** offset or an **ATR** multiplier. It can be anchored from two different points:
* **Breakout Level:** The stop is placed relative to the `sessionHigh` or `sessionLow` level.
* **Entry Bar:** The stop is placed relative to the high/low of the bar that *triggered* the entry.
#### 2. Take Profit (TP)
A standard Take Profit can be set using a fixed **Tick** offset or an **ATR** multiplier.
#### 3. Advanced Exit Logic
These options override the standard Take Profit to allow for more dynamic trade management:
* **Trailing Take Profit (TTP):**
* **Fixed/ATR Trail:** A standard trailing stop that activates after price moves a certain amount in your favor.
* **MA Price Cross:** Exits the trade as soon as the price closes across a fast-moving average (e.g., 9-EMA).
* **MA Crossover:** Exits the trade as soon as a fast MA crosses below a slow MA (for longs) or above (for shorts).
* **Close on Reversal:** (Optional) Exits immediately if the **very next bar** after entry closes back *inside* the opening range (a "failed breakout" signal).
* **Close on Opposite Range Cross:** (Optional) Exits a long trade if the price ever closes below the `sessionLow` (and vice-versa for shorts).
* **End of Session Exit:** All open positions are automatically closed at the end of the defined trading session.
Pesquisar nos scripts por "the strat"

Tristan's Tri-band StrategyTristan's Tri-band Strategy - Confluence Trading System
Strategy Overview:
This strategy combines three powerful technical indicators - RSI, Williams %R, and Bollinger Bands - into a single visual trading system. Instead of cluttering your chart with separate indicator panels, all signals are displayed directly on the price chart using color-coded gradient overlays, making it easy to spot high-probability trade setups at a glance.
How It Works:
The strategy identifies trading opportunities when multiple indicators align (confluence), suggesting strong momentum shifts:
📈 Long Entry Signals:
RSI drops to 30 or below (oversold)
Williams %R reaches -80 to -100 range (oversold)
Price touches or breaks below the lower Bollinger Band
All three conditions must align during your selected trading session
📉 Short Entry Signals:
RSI rises to 70 or above (overbought)
Williams %R reaches 0 to -20 range (overbought)
Price touches or breaks above the upper Bollinger Band
All three conditions must align during your selected trading session
Visual Indicators:
(faint) Green gradients below candles = Bullish oversold conditions (buying opportunity)
(faint) Red/Orange gradients above candles = Bearish overbought conditions (selling opportunity)
Stacked/brighter gradients = Multiple indicators confirming the same signal (higher probability) will stack and show brighter / less faint
Blue Bollinger Bands = Volatility boundaries and mean reversion zones
Exit Strategy:
Long trades exit when price reaches the upper Bollinger Band OR RSI becomes overbought (≥70)
Short trades exit when price reaches the lower Bollinger Band OR RSI becomes oversold (≤30)
Key Features:
✅ Session Filters - Trade only during NY (9:30 AM-4 PM), London (3 AM-11:30 AM), or Asia (7 PM-1 AM EST) sessions
✅ No Repainting - Signals are confirmed on candle close for realistic backtesting and live trading
✅ Customizable Parameters - Adjust RSI levels, BB standard deviations, Williams %R periods, and gradient visibility
✅ Visual Clarity - See all three indicators at once without switching between panels
✅ Built-in Alerts - Get notified when entry and exit conditions are met
How to Use Effectively:
Choose Your Trading Session - For day trading US stocks, enable only the NY session. For forex or 24-hour markets, select the sessions that match your schedule.
Look for Gradient Stacking - The brightest, most visible gradients occur when both RSI and Williams %R signal together. These are your highest-probability setups.
Confirm with Price Action - Wait for the candle to close before entering. The strategy enters on the next bar's open to prevent repainting.
Respect the Bollinger Bands - Entries occur at the outer bands (price extremes), and exits occur at the opposite band or when momentum reverses.
Backtest First - Test the strategy on your preferred instruments and timeframes. Works best on liquid assets with clear trends and mean reversion patterns (stocks, major forex pairs, indices).
Adjust Gradient Visibility - Use the "Gradient Strength" slider (lower = more visible) to make signals stand out on your chart style.
Best Timeframes: 5-minute to 1-hour charts for intraday trading; 4-hour to daily for swing trading (I have also found the 3 hour timeframe to work really well for some stocks / ETFs.)
Best Markets: Liquid instruments with volatility - SPY, QQQ, major stocks, EUR/USD, GBP/USD, major indices
Risk Management: This is a mean reversion strategy that works best in ranging or choppy markets. In strong trends, signals may appear less frequently. Always use proper position sizing and stop losses based on your risk tolerance.
----------------------------------------------
Note: Past performance does not guarantee future results. This strategy is provided for educational purposes. Always backtest thoroughly and practice proper risk management before live trading.RetryClaude can make mistakes. Please double-check responses. Sonnet 4.5

Adaptive Cortex Strategy (ACS)Strategy Title: Adaptive Cortex Strategy (ACS)
This script is invite-only.
Part 1: Philosophy and the Fundamental Problem It Solves
Adaptive Cortex Strategy (ACS) is an advanced decision support system designed to dynamically adapt to the ever-changing characteristics of the market. A major weakness of traditional approaches is that while successful in a specific market condition (e.g., a strong trend), they become ineffective when the market changes course (e.g., enters a sideways range). ACS solves this problem by continuously analyzing the market's current "regime" and instantly adapting its decision-making logic accordingly.
Its primary goal is to enable the strategy itself to "think" and evolve with the market, without requiring the trader to change their strategy.
Part 2: Original Methodology and Proprietary Logic
A Note on the Original Methodology and Intellectual Property
This algorithm is not based on or copied from any open-source strategy code. The system utilizes the mathematical principles of widely accepted indicators such as ADX, RSI, and Ichimoku as data sources for its analyses.
However, the intellectual property and unique value of the algorithm lies in its unique and closed-source architecture that processes, prioritizes, and synthesizes data from these standard tools. The methods used in core components, particularly the adaptive 'Cortex' memory system and statistical 'Forecast' engine, represent a unique set of logic developed from scratch for this script. The parameters, order of operations, and conditional logic are entirely custom-designed. Therefore, the system's performance is a result of its unique design, not a repetition of publicly available code.
ACS's power lies not in the individual indicators it uses, but in the unique and proprietary logic layers that process the information from these indicators.
1. Multi-Factor Scoring and Adaptive Weighting:
The heart of the methodology is a scoring system that analyzes the market in four main categories: Trend, Support/Resistance, Momentum, and Volume. However, what makes ACS unique is that it dynamically changes the importance it assigns to these categories based on the market regime.
Unique Application: Using ADX, DMI, and ATR indicators, the system detects whether the market is in different regimes, such as "Strong Trend" or "High Volatility Squeeze." When it detects a strong trend, it automatically increases the weight of the Trend scores from the Ichimoku and proprietary AMF Trend Engine. When it detects sideways or tightness, it shifts its focus to Support/Resistance zones determined by Dynamic Channels and the author's "Cortex" Memory System. A different approach was added here, inspired by the classic Fibonacci estimation. This "adaptive weighting" ensures that the strategy always focuses its attention on the most appropriate area.
2. Statistical Forecast Engine:
ACS goes beyond standard indicators and includes a proprietary forecasting algorithm that measures the probability of a potential price movement's success.
Unique Implementation: The system stores the results of past tests (successful bounces/breakouts) at key price levels in a "brain" (memory). At the time of a new test, it compares the current RSI momentum, volume anomalies, and market regime with similar past situations. Based on this comparison, it calculates the probability of the current test being successful as a statistical percentage and adds this percentage to the final score as a "bonus" or "penalty."
3. Walk-Forward Architecture:
Markets constantly evolve. ACS continues to learn from the latest market dynamics by resetting its memory at regular intervals (e.g., monthly) through its "Re-Learn Mode," rather than being trapped by old data. This is an advanced approach aimed at ensuring the strategy remains current and effective over the long term.
Part 3: Practical Features and User Benefits
HOW DOES IT HELP INVESTORS?
Customizable Trading Profiles: ACS does not come with a single set of settings. Users can instantly adapt all the algorithm's key periods and decision thresholds to their trading style by selecting one of the pre-configured trading profiles, such as "SCALPING," "INTRADAY TREND," or "SWING TRADE." Additionally, they can further fine-tune the selected profile with "Speed Adjustment."
Full Automation Compatibility (JSON): The strategy is equipped with fully configurable JSON-formatted alert messages for buy, sell, and position closing transactions. This makes it possible to establish a fully automated trading system by connecting ACS signals to automation platforms such as 3Commas and PineConnector. Dynamic values such as position size ({{strategy.order.contracts}}) are automatically added to alerts.
Advanced and Adaptive Risk Management: Protecting capital is as important as making a profit. ACS offers a multi-layered risk management framework for this purpose:
Flexible Position Size: Allows you to set the risk for each trade as a percentage of capital or a fixed dollar amount.
Adaptive ATR Stop: The stop-loss level is dynamically expanded or contracted based on current market volatility (the ratio of short-term ATR to long-term ATR).
Contingency Mechanisms: Includes safety nets such as "Maximum Drawdown Protection" and the "Praetorian Guard" engine, which detects sudden market shocks.
Clear and Comprehensible Dashboard: Transforms dozens of complex data points into an intuitive dashboard that provides critical information such as market trends, major trends, support/resistance zones, and final signals at a glance.
Section 4: Disclaimers and Rules
Transparency Note: This algorithm uses the mathematical foundations of publicly available indicators such as ADX, ATR, RSI, and Ichimoku. However, ACS's intellectual property and unique value lies in its unique architecture, which combines data from these standard tools, prioritizes it by market trend, and synthesizes it with its proprietary "Cortex" and "Statistical Forecast" engines.
Educational Use:
IMPORTANT WARNING: The Adaptive Cortex Strategy is a professional decision support and analysis tool. It is NOT a system that promises "guaranteed profits." All trading activities involve the risk of capital loss. Past performance is no guarantee of future results. All signals and analysis generated by this script are for educational purposes only and should not be construed as investment advice. Users are solely responsible for applying their own risk management rules and making their final trading decisions.
Strategy Backtest Information
Please remember that past performance is not indicative of future results. The published chart and performance report were generated on the 4-hour timeframe of the BTC/USD pair with the following settings:
Test Period: January 1, 2016 - November 2, 2025
Default Position Size: 15% of Capital
Pyramiding: Closed
Commission: 0.0008
Slippage: 2 ticks (Please enter the slippage you used in your own tests)
Testing Approach: The published test includes 123 trades and is statistically significant. It is strongly recommended that you test on different assets and timeframes for your own analysis. The default settings are a template and should be adjusted by the user for their own analysis.

Buy&Hold Profitcalculator in EuroTitle: Buy & Hold Strategy in Euro
Description:
This Pine Script implements a simple yet flexible Buy & Hold strategy denominated in Euros, suitable for a wide range of assets including cryptocurrencies, forex pairs, and stocks.
Key Features:
Custom Investment Amount: Define your invested capital in Euros.
Flexible Start & End Dates: Specify exact entry and exit dates for the strategy.
Automatic Currency Conversion: Supports assets priced in USD or USDT, converting the invested capital to chart currency using the EUR/USD exchange rate.
Single Entry and Exit: Executes a one-time Buy & Hold position based on the defined timeframe.
Profit and Performance Tracking: Calculates total profit/loss in Euros and percentage returns.
Smart Exit Label: Displays a dynamic label at the exit showing final position value, net profit/loss, and return percentage. The label automatically adjusts its position above or below the price bar for optimal visibility.
Visual Enhancements:
Position value and profit/loss plotted on the chart.
Background color highlights the active investment period.
Buy and Sell markers clearly indicate entry and exit points.
This strategy is ideal for traders and investors looking to simulate long-term positions and evaluate performance in Euro terms, even when trading USD-denominated assets.
Usage Notes:
Best used on daily charts for medium- to long-term analysis.
Adjust start and end dates, as well as invested capital, to simulate different scenarios.
Works with any asset, but currency conversion is optimized for USD or USDT-pegged instruments.

v2.0—Tristan's Multi-Indicator Reversal Strategy🎯 Multi-Indicator Reversal Strategy - Optimized for High Win Rates
A powerful confluence-based strategy that combines RSI, MACD, Williams %R, Bollinger Bands, and Volume analysis to identify high-probability reversal points . Designed to let winners run with no stop loss or take profit - positions close only when opposite signals occur.
Also, the 3 hour timeframe works VERY well—just a lot less trades.
📈 Proven Performance
This strategy has been backtested and optimized on multiple blue-chip stocks with 80-90%+ win rates on 1-hour timeframes from Aug 2025 through Oct 2025:
✅ V (Visa) - Payment processor
✅ MSFT (Microsoft) - Large-cap tech
✅ WMT (Walmart) - Retail leader
✅ IWM (Russell 2000 ETF) - Small-cap index
✅ NOW (ServiceNow) - Enterprise software
✅ WM (Waste Management) - Industrial services
These stocks tend to mean-revert at extremes, making them ideal candidates for this reversal-based approach. I only list these as a way to show you the performance of the script. These values and stock choices may change over time as the market shifts. Keep testing!
🔑 How to Use This Strategy Successfully
Step 1: Apply to Chart
Open your desired stock (V, MSFT, WMT, IWM, NOW, WM recommended)
Set timeframe to 1 Hour
Apply this strategy
Check that the Williams %R is set to -20 and -80, and "Flip All Signals" is OFF (can flip this for some stocks to perform better.)
Step 2: Understand the Signals
🟢 Green Triangle (BUY) Below Candle:
Multiple indicators (RSI, Williams %R, MACD, Bollinger Bands) show oversold conditions
Enter LONG position
Strategy will pyramid up to 10 entries if more buy signals occur
Hold until red triangle appears
🔴 Red Triangle (SELL) Above Candle:
Multiple indicators show overbought conditions
Enter SHORT position (or close existing long)
Strategy will pyramid up to 10 entries if more sell signals occur
Hold until green triangle appears
🟣 Purple Labels (EXIT):
Shows when positions close
Displays count if multiple entries were pyramided (e.g., "Exit Long x5")
Step 3: Let the Strategy Work
Key Success Principles:
✅ Be Patient - Signals don't occur every day, wait for quality setups
✅ Trust the Process - Don't manually close positions, let opposite signals exit
✅ Watch Pyramiding - The strategy can add up to 10 positions in the same direction
✅ No Stop Loss - Positions ride through drawdowns until reversal confirmed
✅ Session Filter - Only trades during NY session (9:30 AM - 4:00 PM ET)
⚙️ Winning Settings (Already Set as Defaults)
INDICATOR SETTINGS:
- RSI Length: 14
- RSI Overbought: 70
- RSI Oversold: 30
- MACD: 12, 26, 9 (standard)
- Williams %R Length: 14
- Williams %R Overbought: -20 ⭐ (check this! And adjust to your liking)
- Williams %R Oversold: -80 ⭐ (check this! And adjust to your liking)
- Bollinger Bands: 20, 2.0
- Volume MA: 20 periods
- Volume Multiplier: 1.5x
SIGNAL REQUIREMENTS:
- Min Indicators Aligned: 2
- Require Divergence: OFF
- Require Volume Spike: OFF
- Require Reversal Candle: OFF
- Flip All Signals: OFF ⭐
RISK MANAGEMENT:
- Use Stop Loss: OFF ⭐⭐⭐
- Use Take Profit: OFF ⭐⭐⭐
- Allow Pyramiding: ON ⭐⭐⭐
- Max Pyramid Entries: 10 ⭐⭐⭐
SESSION FILTER:
- Trade Only NY Session: ON
- NY Session: 9:30 AM - 4:00 PM ET
**⭐ = Critical settings for success**
## 🎓 Strategy Logic Explained
### **How It Works:**
1. **Multi-Indicator Confluence**: Waits for at least 2 out of 4 technical indicators to align before generating signals
2. **Oversold = Buy**: When RSI < 30, Williams %R < -80, price below lower Bollinger Band, and/or MACD turning bullish → BUY signal
3. **Overbought = Sell**: When RSI > 70, Williams %R > -20, price above upper Bollinger Band, and/or MACD turning bearish → SELL signal
4. **Pyramiding Power**: As trend continues and more signals fire in the same direction, adds up to 10 positions to maximize gains
5. **Exit Only on Reversal**: No arbitrary stops or targets - only exits when opposite signal confirms trend change
6. **Session Filter**: Only trades during liquid NY session hours to avoid overnight gaps and low-volume periods
### **Why No Stop Loss Works:**
Traditional reversal strategies fail because they:
- Get stopped out too early during normal volatility
- Miss the actual reversal that happens later
- Cut winners short with tight take profits
This strategy succeeds because it:
- ✅ Rides through temporary noise
- ✅ Captures full reversal moves
- ✅ Uses multiple indicators for confirmation
- ✅ Pyramids into winning positions
- ✅ Only exits when technical picture completely reverses
---
## 📊 Understanding the Display
**Live Indicator Counter (Top Corner / end of current candles):**
Bull: 2/4
Bear: 0/4
(STANDARD)
Shows how many indicators currently align bullish/bearish
"STANDARD" = normal reversal mode (buy oversold, sell overbought)
"FLIPPED" = momentum mode if you toggle that setting
Visual Indicators:
🔵 Blue background = NY session active (trading window)
🟡 Yellow candle tint = Volume spike detected
💎 Aqua diamond = Bullish divergence (price vs RSI)
💎 Fuchsia diamond = Bearish divergence
⚡ Advanced Tips
Optimizing for Different Stocks:
If Win Rate is Low (<50%):
Try toggling "Flip All Signals" to ON (switches to momentum mode)
Increase "Min Indicators Aligned" to 3 or 4
Turn ON "Require Divergence"
Test on different timeframe (4-hour or daily)
If Too Few Signals:
Decrease "Min Indicators Aligned" to 2
Turn OFF all requirement filters
Widen Williams %R bands to -15 and -85
If Too Many False Signals:
Increase "Min Indicators Aligned" to 3 or 4
Turn ON "Require Divergence"
Turn ON "Require Volume Spike"
Reduce Max Pyramid Entries to 5
Stock Selection Guidelines:
Best Suited For:
Large-cap stable stocks (V, MSFT, WMT)
ETFs (IWM, SPY, QQQ)
Stocks with clear support/resistance
Mean-reverting instruments
Avoid:
Ultra low-volume penny stocks
Extremely volatile crypto (try traditional settings first)
Stocks in strong one-directional trends lasting months
🔄 The "Flip All Signals" Feature
If backtesting shows poor results on a particular stock, try toggling "Flip All Signals" to ON:
STANDARD Mode (OFF):
Buy when oversold (reversal strategy)
Sell when overbought
May work best for: V, MSFT, WMT, IWM, NOW, WM
FLIPPED Mode (ON):
Buy when overbought (momentum strategy)
Sell when oversold
May work best for: Strong trending stocks, momentum plays, crypto
Test both modes on your stock to see which performs better!
📱 Alert Setup
Create alerts to notify you of signals:
📊 Performance Expectations
With optimized settings on recommended stocks:
Typical results we are looking for:
Win Rate: 70-90%
Average Winner: 3-5%
Average Loser: 1-3%
Signals Per Week: 1-3 on 1-hour timeframe
Hold Time: Several hours to days
Remember: Past performance doesn't guarantee future results. Always use proper risk management.

AMF PG Consensus Engine v3.5AMF PG Consensus Engine v3.5
1. Core Philosophy: A Multi-Stage Confirmation System for High-Probability Signals
In the world of automated trading, the real challenge isn't generating signals, but filtering out the noise. The AMF PG Consensus Engine is designed to address this challenge. It operates on a simple yet powerful philosophy: a buy or sell signal is valid only if it receives confirmation from multiple, independent analysis modules.
This strategy isn't a "black box." It's a transparent, rules-based framework that transforms market momentum and momentum into a final consensus and then directs a core trend-following engine. The goal is to avoid trading in adverse market conditions and only act when the different analysis layers agree.
2. How the Consensus Engine Works: Two Confirmation Layers
Before the core engine is allowed to seek a trade, the market must go through a two-stage "confirmation" process. Both filters can be enabled or disabled from the settings, allowing users to customize the strategy's stringency level.
Confirmation Module 1: Renko Regime Filter
This module's purpose is to answer a critical question: "Is the market currently in a stable, directional trend, or is it volatile and unstable?" Instead of standard indicators, it creates a timeless Renko chart in the background. A trend is confirmed only if a minimum number of consecutive Renko bricks form in the same direction. This method is extremely effective at filtering out noisy, sideways price movements, which are often unsuccessful for trend-following systems. The brick size can be set to a fixed value or automatically calculated based on the Average True Range (ATR) for better fit.
Confirmation Module 2: Candle Scoring Engine
This module analyzes the raw strength of price action by scoring each candle individually. It evaluates the candle's direction, body size relative to the previous candle, and the change in closing price. These factors are converted into a score for each bar. A cumulative score is then calculated over a user-defined period. A buy trade is only confirmed if this cumulative momentum score exceeds a positive threshold, indicating sustained buying pressure. Conversely, a sell trade requires the score to fall below a negative threshold, indicating sustained selling pressure.
3. Core Engine: AMF PG Trend Follower
When both confirmation modules give the "green light" for a specific direction (e.g., buy), the core AMF PG (Praetorian Guard) engine is activated. This is a proprietary, volatility-sensitive trend-following mechanism.
It calculates a dynamic upper and lower band around the price. These bands are not static; their distance from the price is constantly adjusted based on recent market volatility and price expansion. A trade is initiated when the price breaks out of these bands in the direction confirmed by the consensus engine. The opposing band then serves as the initial trailing stop-loss, adjusted as the trend progresses.
4. Embedded Filters for Additional Security
To further enhance signal quality, the core engine has several embedded filters that are always active and cannot be disabled by the user:
Trend Strength Filter: To confirm that a trend has sufficient strength, a trade will not be initiated unless the ADX (Average Directional Index) is above a certain threshold.
Sideways Market Filter: The Chop Index is used to prevent trading in extremely sideways and directionless markets.
5. Risk Management: Maximum Drawdown Protection
A key feature of this strategy is its built-in capital protection mechanism. Users can set a maximum capital drawdown limit of a percentage. If the strategy's capital falls by this percentage from its peak, the "DD Protect" feature is activated, closing all open positions and preventing new trades from being opened. This acts as a final emergency brake to protect capital during unpredictable market conditions or underperformance of the strategy.
6. Automation-Ready: Customizable Webhook Alerts
This strategy was developed for modern investors looking to automate their trading. Instead of generic alert messages, you can define your own custom alert text directly from the script's settings.
This feature is particularly powerful for connecting to third-party automation services via Webhooks. You can configure the alert message in the JSON format required by your service (such as {"action": "buy", "symbol": "{{ticker}}"}). This allows you to seamlessly connect your strategy signals directly to your trading account.
7. Strategy Backtest Information
Please remember that past performance is not indicative of future results. The published chart and performance report were generated on the 4-hour timeframe of the BTC/USD pair with the following settings:
Test Period: January 1, 2016 - October 31, 2025
Default Position Size: 15% of Capital
Pyramiding: Closed
Commission: 0.0008
Slippage: 2 ticks (Please enter the slippage you used in your own tests)
Testing Approach: The published test includes 799 trades and is statistically significant. It is strongly recommended that you test on different assets and timeframes for your own analysis. The default settings are a template and should be adjusted by the user for their own analysis.

Basic DCA Strategy by Wongsakon KhaisaengThe Core Principle and Philosophy Behind the Basic DCA Strategy
1. Introduction
The Basic DCA Strategy (Dollar-Cost Averaging) represents one of the most fundamental and enduring investment methodologies in the realm of systematic accumulation. The philosophy underpinning DCA is rooted not in speculation or prediction, but in disciplined participation. It assumes that the consistent act of investing a fixed amount of capital over time—regardless of short-term price volatility—can yield superior long-term outcomes through the natural smoothing effect of cost averaging.
This strategy, expressed through the Pine Script code above, formalizes the DCA concept into a fully systematic trading framework, enabling quantitative backtesting and objective evaluation of long-term accumulation efficiency.
2. Mechanism of Operation
At its technical core, the strategy executes a fixed-value buy order at every predefined interval within a specific accumulation period.
Each DCA event invests a constant “Investment Amount (USD)” irrespective of price fluctuations. When prices decline, this constant investment buys a larger quantity of the asset; when prices rise, it purchases fewer units. Over time, this behavior lowers the average cost basis of the accumulated position, effectively neutralizing short-term timing risks.
Mathematically, this is represented as:
Units Purchased = Investment Amount / Closing Price
Cost Basis = Total Invested USD / Total Units Acquired
Portfolio Value = Total Units Acquired × Current Price
The algorithm tracks cumulative investment, acquired units, and commissions dynamically, continuously recalculating key portfolio metrics such as total profit/loss (PnL), CAGR (Compound Annual Growth Rate), and maximum drawdown (peak-to-trough equity decline).
Furthermore, the script juxtaposes DCA results with a Buy & Hold benchmark, where the entire initial capital is invested at once. This comparison highlights the behavioral resilience and volatility resistance of the DCA method relative to market-timing strategies.
3. The Essence of DCA Philosophy
At its philosophical core, DCA is not a trading system, but a behavioral framework for rational capital deployment under uncertainty. It embodies the principle that time in the market often outweighs timing the market.
The DCA approach rejects the illusion of precision forecasting and embraces probabilistic humility—the recognition that even the most skilled investors cannot consistently predict short-term market fluctuations. Instead, it focuses on controlling what is controllable: the frequency, consistency, and size of investment actions.
This mindset reflects a broader principle of risk dispersion through temporal diversification. Rather than concentrating entry risk into a single price point (as in lump-sum investing), DCA spreads exposure across multiple time intervals, thereby converting volatility into opportunity.
In essence, volatility—often perceived as risk—is reframed as a mechanism for mean reversion advantage. The strategy thrives precisely because markets oscillate; each fluctuation provides a chance to accumulate at varied price levels, improving the weighted-average entry over time.
4. Long-Term Rationality Over Short-Term Emotion
DCA’s endurance stems from its ability to neutralize emotional biases inherent in human decision-making. Investors tend to overreact to market euphoria or panic—buying high out of greed and selling low out of fear. By automating purchases through predefined intervals, the DCA model enforces mechanical discipline, detaching decision-making from sentiment.
This transforms investing from an emotional endeavor into a systematic, algorithmic routine governed by rules rather than reactions. In doing so, DCA serves not only as a financial model but also as a psychological safeguard—aligning investor behavior with long-term compounding logic rather than short-term speculation.
5. Comparative Insight: DCA vs. Buy & Hold
While both DCA and Buy & Hold share a long-term investment horizon, they diverge in their treatment of entry timing. The Buy & Hold model assumes full deployment of capital at the beginning, maximizing exposure to growth but also to volatility. Conversely, DCA smooths the entry curve, trading off short-term returns for long-term stability and improved average entry price.
In environments characterized by volatility and cyclical corrections, DCA tends to outperform in terms of risk-adjusted returns, lower drawdowns, and improved investor adherence—since it reduces the psychological pain of entering at local peaks.
6. Conclusion
The Basic DCA Strategy exemplifies the synthesis of mathematical rigor and behavioral discipline. Its algorithmic construction in Pine Script transforms a classical investment philosophy into a quantifiable, testable, and transparent framework.
By automating fixed-amount purchases across time, the system operationalizes the central axiom of DCA: consistency over conviction. It is not concerned with predicting future prices but with ensuring persistent participation—trusting that the market’s upward bias and the power of compounding will reward patience more than precision.
Ultimately, DCA embodies the timeless principle that successful investing is less about forecasting markets, and more about designing behavior that can endure them.

One For All Strategy by Anson🏆 Exclusive Indicator: One For All Strategy
.
📈 Works for stocks, forex, crypto, indices
📈 Easy to use, real-time alerts, no repaint
📈 No grid, no martingale, no hedging
📈 One position at a time
.
One For All Strategy by Anson
A multi-indicator TradingView strategy designed to identify long and short trading opportunities by combining trend-following and momentum signals, paired with risk management rules to guide entries and exits.
.
Core Logic & Key Indicator:
X Moving Average: A proprietary adaptive moving average that adjusts its responsiveness to price changes based on market volatility. It uses an efficiency ratio to modify its smoothing behavior—adapting to whether the market is trending or ranging. Users can toggle a setting to let this ratio dynamically adjust the indicator’s sensitivity or use a fixed smoothing factor.
.
Entry Conditions:
.
Long Entry: Triggered when momentum signals strength, price action aligns with a broader upward trend, the X MA indicates short-term upward momentum, and a minimum number of bars have passed since the last trade (to prevent overtrading).
.
Short Entry: Triggered when momentum signals weakness, price action aligns with a broader downward trend, the X MA indicates short-term downward momentum, and a minimum number of bars have passed since the last trade.
.
Exit Conditions:
.
Trailing Stop: Activates after a position has been open for a set number of bars (to avoid premature exits). A trailing stop—based on a percentage of the entry price—locks in profits as the trade moves favorably, adjusting dynamically to protect gains.
.
Additional Features:
Visualisation: Overlays the X MA (orange line) and price (semi-transparent blue) on the chart for clear signal tracking.
.
See the author's instructions on the right to learn how to get access to the strategy.

[Aegis]DCA grid Strategy for Crypto### **Crypto Market Long-Only Strategy (DCA with Risk Mitigation)**
This strategy is a Long-only approach, often using a Dollar-Cost Averaging (DCA) method for staggered entries. It is designed to mitigate the risk of being unable to exit a position for a prolonged period, which typically occurs when a series of initial DCA entries result in a losing trade.
The strategy has the following characteristics:
#### **1. Markets**
* Trade in highly liquid Perpetual Futures markets for cryptocurrencies.
#### **2. Position Sizing**
The initial entry quantity is determined by setting the **Initial Entry Ratio** in the input values.
* If the **Subsequent Entry Multiplier** is 1, the maximum position size upon final entry is determined by:
$$\text{Initial Entry Quantity} \times \text{Number of Entries}$$
* If the **Subsequent Entry Multiplier** is $x$, the maximum position size is determined by the following cumulative sum:
$$\text{1st Entry Quantity} + (\text{1st Entry Quantity} \times x) + (\text{2nd Entry Quantity} \times x) + \dots + ((\text{n-1)th Entry Quantity} \times x)$$
#### **3. Entries**
* The **1st Entry** is determined by the **Entry Sensitivity**. The first entry is automatically calculated based on an oversold condition; setting a higher sensitivity value will trigger the 1st entry in a more significant oversold situation.
* Entries from the **2nd Entry onwards** are made sequentially based on the generated **Grid Spacing**.
* The **Grid Spacing** is calculated as an equal interval:
$$\text{Grid Spacing} = \frac{\text{Final Entry Distance}}{(\text{Number of Entries} - 1)}$$
#### **4. Exits**
This strategy **does not distinguish between Stop-Loss and Take-Profit**. All entered quantities are liquidated simultaneously upon mean reversion. This transaction may result in either a loss or a profit. Generally:
* If the price recovery is rapid, the trade finishes with a profit.
* If the price recovery is slow, the trade finishes with a loss.
Therefore, the **'resilience' or 'recovery speed'** of the underlying asset significantly influences the long-term performance of the strategy.
크립토 시장에 특화된 Long only전략입니다. DCA 방식의 분할 매수 전략이 대체로 이익 거래가 아닌 경우, 장기간 탈출하지 못할 리스크를 보완한 전략입니다.
이 전략은 다음과 같은 특징을 가지고 있습니다.
##### 1. 시장 (Markets)
• 유동성이 풍부한 코인 무기한 선물 시장에서 거래한다.
##### 2. 포지션 크기 (Position Sizing)
인풋 값에 최초진입비율을 설정함으로써 1차 진입의 수량이 결정됩니다.
- 추가 진입배수가 1일 때, 최대 진입 시 포지션 크기는 "1차 진입수량 * 진입횟수"에 의해 결정됩니다.
- 추가 진입배수가 x일때,
1차진입물량 + (1차진입 물량 * x) + (2차진입 물량 * x) ..... + (n-1)차 진입물량 * x 의 방식으로 최대 진입 시 포지션 크기가 결정 됩니다
##### 3. 진입 (Entries)
- 1차 진입은 진입 둔감도에 의해 결정됩니다. 1차 진입은 과매도 상황을 자동적으로 계산하여 결정되며, 둔감도를 높은 값으로 설정하면 더 큰 과매도 상황에서 1차 진입이 결정됩니다.
- 2차 이후의 진입은 생성된 그리드 간격에 의해 순차적으로 진입하게 됩니다.
- 그리드 간격은 최종 진입 간격 / (진입 횟수 - 1) 으로 등간격으로 이루어집니다.
##### 4. 청산 (Exits)
이 전략은 손절과 익절을 구분하지 않습니다. 평균 회귀를 하는 경우 진입한 모든 물량을 일시에 청산하며, 이 거래는 손실 거래일 수도, 이익 거래일 수도 있습니다. 일반적으로, 가격 회복이 빠르게 되는 경우 이익 거래로 마무리되고, 가격 회복이 느린 경우 손실 거래로 마무리되기 때문에, 장기적으로 종목의 '회복탄력성'이 전략의 성과에 영향을 줄 수 있습니다.

Adaptive Trend 1m ### Overview
The "Adaptive Trend Impulse Parallel SL/TP 1m Realistic" strategy is a sophisticated trading system designed specifically for high-volatility markets like cryptocurrencies on 1-minute timeframes. It combines trend-following with momentum filters and adaptive parameters to dynamically adjust to market conditions, ensuring more reliable entries and risk management. This strategy uses SuperTrend for primary trend detection, enhanced by MACD, RSI, Bollinger Bands, and optional volume spikes. It incorporates parallel stop-loss (SL) and multiple take-profit (TP) levels based on ATR, with options for breakeven and trailing stops after the first TP. Optimized for realistic backtesting on short timeframes, it avoids over-optimization by adapting indicators to market speed and efficiency.
### Principles of Operation
The strategy operates on the principle of adaptive impulse trading, where entry signals are generated only when multiple conditions align to confirm a strong trend reversal or continuation:
1. **Trend Detection (SuperTrend)**: The core signal comes from an adaptive SuperTrend indicator. It calculates upper and lower bands using ATR (Average True Range) with dynamic periods and multipliers. A buy signal occurs when the price crosses above the lower band (from a downtrend), and a sell signal when it crosses below the upper band (from an uptrend). Adaptation is based on Rate of Change (ROC) to measure market speed, shortening periods in fast markets for quicker responses.
2. **Momentum and Trend Filters**:
- **MACD**: Uses adaptive fast and slow lengths. In "Trend Filter" mode (default when "Use MACD Cross" is false), it checks if the MACD line is above/below the signal for long/short. In cross mode, it requires a crossover/crossunder.
- **RSI**: Adaptive period RSI must be above 50 for longs and below 50 for shorts, confirming overbought/oversold conditions dynamically.
- **Bollinger Bands (BB)**: Depending on the mode ("Midline" by default), it requires the price to be above/below the BB midline for longs/shorts, or a breakout in "Breakout" mode. Deviation adapts to market efficiency.
- **Volume Spike Filter** (optional): Entries require volume to exceed an adaptive multiple of its SMA, signaling strong impulse.
3. **Volatility Filter**: Entries are only allowed if current ATR percentage exceeds a historical minimum (adaptive), preventing trades in low-volatility ranges.
4. **Risk Management (Parallel SL/TP)**:
- **Stop-Loss**: Set at an adaptive ATR multiple below/above entry for long/short.
- **Take-Profits**: Three levels at adaptive ATR multiples, with partial position closures (e.g., 51% at TP1, 25% at TP2, remainder at TP3).
- **Post-TP1 Features**: Optional breakeven moves SL to entry after TP1. Trailing SL uses BB midline as a dynamic trail.
- All levels are calculated per trade using the ATR at entry, making them "realistic" for 1m charts by widening SL and tightening initial TPs.
The strategy enters long on buy signals with all filters met, and short on sell signals. It uses pyramid margin (100% long/short) for full position sizing.
Adaptation is driven by:
- **Market Speed (normSpeed)**: Based on ROC, tightens multipliers in volatile periods.
- **Efficiency Ratio (ER)**: Measures trend strength, adjusting periods for trending vs. ranging markets.
This ensures the strategy "adapts" without manual tweaks, reducing false signals in varying conditions.
### Main Advantages
- **Adaptability**: Unlike static strategies, parameters dynamically adjust to market volatility and trend strength, improving performance across ranging and trending phases without over-optimization.
- **Realistic Risk Management for 1m**: Wider SL and tiered TPs prevent premature stops in noisy short-term charts, while partial profits lock in gains early. Breakeven/trailing options protect profits in extended moves.
- **Multi-Filter Confirmation**: Combines trend, momentum, and volume for high-probability entries, reducing whipsaws. The volatility filter avoids flat markets.
- **Debug Visualization**: Built-in plots for signals, levels, and component checks (when "Show Debug" is enabled) help users verify logic on charts.
- **Efficiency**: Low computational load, suitable for real-time trading on TradingView with alerts.
Backtesting shows robust results on volatile assets, with a focus on sustainable risk (e.g., SL at 3x ATR avoids excessive drawdowns).
### Uniqueness
What sets this strategy apart is its **fully adaptive framework** integrating multiple indicators with real-time market metrics (ROC for speed, ER for efficiency). Most trend strategies use fixed parameters, leading to poor adaptation; here, every key input (periods, multipliers, deviations) scales dynamically within bounds, creating a "self-tuning" system. The "parallel SL/TP with 1m realism" adds custom handling for micro-timeframes: tightened initial TPs for quick wins and adaptive min-ATR filter to skip low-vol bars. Unlike generic mashups, it justifies the combination—SuperTrend for trend, MACD/RSI/BB for impulse confirmation, volume for conviction—working synergistically to capture "trend impulses" while filtering noise. The post-TP1 breakeven/trailing tied to BB adds a unique profit-locking mechanism not common in open-source scripts.
### Recommended Settings
These settings are optimized and recommended for trading ASTER/USDT on Bybit, with 1-minute chart, x10 leverage, and cross margin mode. They provide a balanced risk-reward for this volatile pair:
- **Base Inputs**:
- Base ATR Period: 10
- Base SuperTrend ATR Multiplier: 2.5
- Base MACD Fast: 8
- Base MACD Slow: 17
- Base MACD Signal: 6
- Base RSI Period: 9
- Base Bollinger Period: 12
- Bollinger Deviation: 1.8
- Base Volume SMA Period: 19
- Base Volume Spike Multiplier: 1.8
- Adaptation Window: 54
- ROC Length: 10
- **TP/SL Settings**:
- Use Stop Loss: True
- Base SL Multiplier (ATR): 3
- Use Take Profits: True
- Base TP1 Multiplier (ATR): 5.5
- Base TP2 Multiplier (ATR): 10.5
- Base TP3 Multiplier (ATR): 19
- TP1 % Position: 51
- TP2 % Position: 25
- Breakeven after TP1: False
- Trailing SL after TP1: False
- Base Min ATR Filter: 0.001
- Use Volume Spike Filter: True
- BB Condition: Midline
- Use MACD Cross (false=Trend Filter): True
- Show Debug: True
For backtesting, use initial capital of 30 USD, base currency USDT, order size 100 USDT, pyramiding 1, commission 0.1%, slippage 0 ticks, long/short margin 0%.
Always backtest on your platform and use risk management—risk no more than 1-2% per trade. This is not financial advice; trade at your own risk.

4-Hour Range Scalping [v6.3]User Guide: 4-Hour Range Scalping Strategy
Hello! Here is the guide for the Pine Script strategy. Please read it carefully to get the best results.
📈 This script automates the "4-Hour Range Scalping Strategy" from the video.
The main idea is that the first four hours of a major trading day (like New York) set up a "trap zone." The strategy waits for the price to break out of this zone and then fail, giving us a signal that the breakout was false and the price is likely to reverse.
Here’s the simple logic:
Define the Range: It precisely calculates the highest high and lowest low during the first four hours of the selected trading session (e.g., 00:00 to 04:00 New York Time).
Wait for a Breakout: It then monitors the 5-minute chart for a price breakout where a candle fully closes outside of this established range.
Identify the Reversal: The trade trigger occurs when the price fails to continue its breakout and a subsequent 5-minute candle closes back inside the range. This signals a potential reversal or "failed breakout."
Execute the Trade:
]A Short (Sell) trade is triggered after a failed breakout above the range high.
A Long (Buy) trade is triggered after a failed breakout below the range low.
Manage the Risk: The Stop Loss is automatically placed at the peak (for shorts) or trough (for longs) of the breakout move, and the Take Profit is set to a default 2:1 Risk/Reward Ratio.
How to Use the Script (Step-by-Step) ⚙️
Follow these instructions to get it running perfectly.
1. Set Your Chart Timeframe This is the most important step. The strategy is designed to run on a 5-minute (5m) chart. Open your TradingView chart and make sure the timeframe is set to "5m".
2. Add the Script to Your Chart Open the Pine Editor tab at the bottom of TradingView, paste the entire script, and click the "Add to chart" button.
3. Configure the Settings On your chart, find the strategy's name (e.g., "4-Hour Range Scalping ") and click the gear icon ⚙️ to open its settings.
Trading Session: Choose the session for the range. New York is the default and the one from the video.
Risk/Reward Ratio: The default is 2.0, meaning your potential profit is twice your potential loss. You can adjust this to test other targets.
Backtesting Period: To see how the strategy performed on all historical data, go to the "Strategy Tester" panel, click its own gear icon ⚙️, and uncheck the boxes for "Start Date" and "End Date."
4. Understand the Visuals on Your Chart
Blue Background Area: This is the 4-hour calculation window. The script is identifying the day's high and low during this time. No trades will ever happen here.
Red Line (Range High): The highest price of the 4-hour window. This is the upper boundary of the "trap zone."
Green Line (Range Low): The lowest price of the 4-hour window. This is the lower boundary.
Green Triangle (▲): Shows where a Long (Buy) trade was entered.
Red Triangle (▼): Shows where a Short (Sell) trade was entered.
A Very Important Note on Timezones 🕒
This is critical for you in the Philippines (PHT).
The script is based on the New York session, which is 12 hours behind you. Your TradingView chart will still show your local time, but the script works on NY time in the background.
The New York "day" begins at 12:00 PM (Noon) your time.
The script's blue calculation window will be from 12:00 PM to 4:00 PM your local time.
The red and green range lines will appear on your chart only after 4:00 PM your time.
So, if you look at your chart in the morning or early afternoon, you will not see today's range yet. This is normal! The script is just waiting for the New York session to start.
How to Set Up Trade Alerts 🔔
You can have TradingView send you a notification whenever the script enters a trade.
Click the "Alert" button (looks like a clock) in the right-hand toolbar of TradingView.
In the "Condition" dropdown, select the name of the script (e.g., "4-Hour Range Scalping...").
You will then see two options: "Long Signal" and "Short Signal".
Select one (e.g., "Long Signal") and configure how you want to be notified (e.g., "Notify on app").
Click "Create". Repeat the process to create an alert for the other signal.
⚠️ Important Disclosure
For Educational and Research Purposes Only.
This script and all accompanying information are provided for educational and research purposes only. The strategy demonstrated is a technical concept and should not be misconstrued as financial, investment, legal, or tax advice.
Trading financial markets involves substantial risk and is not suitable for every investor. There is a possibility that you could sustain a loss of some or all of your initial investment. Therefore, you should not invest money that you cannot afford to lose.
Past performance is not indicative of future results. The backtesting results shown by this script are historical and do not guarantee future performance. Market conditions are constantly changing.
By using this script, you acknowledge that you are solely responsible for any and all trading decisions you make. You should conduct your own thorough research and, if necessary, seek advice from an independent financial advisor before making any investment decisions. The creators of this script assume no liability for any of your trading results.

HermesHERMES STRATEGY - TRADINGVIEW DESCRIPTION
OVERVIEW
Hermes is an adaptive trend-following strategy that uses dual ALMA (Arnaud Legoux Moving Average) filters to identify high-quality entry and exit points. It's designed for swing and position traders who want smooth, low-lag signals with minimal whipsaws.
Unlike traditional moving averages that operate on price, Hermes analyzes price returns (percentage changes) to create signals that work consistently across any asset class and price range.
HOW IT WORKS
DUAL ALMA SYSTEM
The strategy uses two ALMA lines applied to price returns:
• Fast ALMA (Blue Line): Short-term trend signal (default: 80 periods)
• Slow ALMA (Black Line): Long-term baseline trend (default: 250 periods)
ALMA is superior to simple or exponential moving averages because it provides:
• Smoother curves with less noise
• Significantly reduced lag
• Natural resistance to outliers and flash crashes
TRADING LOGIC
BUY SIGNAL:
• Fast ALMA crosses above Slow ALMA (bullish regime)
• Price makes new N-bar high (momentum confirmation)
• Optional: Price above 200 EMA (macro trend filter)
• Optional: ALMA lines sufficiently separated (strength filter)
SELL SIGNAL:
• Fast ALMA crosses below Slow ALMA (bearish regime)
• Optional: Price makes new N-bar low (momentum confirmation)
The strategy stays in position during the entire bullish regime, allowing you to ride trends for weeks or months.
VISUAL INDICATORS
LINES:
• Blue Line: Fast ALMA (short-term signal)
• Black Line: Slow ALMA (long-term baseline)
TRADE MARKERS:
• Green Triangle Up: Buy executed
• Red Triangle Down: Sell executed
• Orange "M": Buy blocked by momentum filter
• Purple "W": Buy blocked by weak crossover strength
KEY PARAMETERS
ALMA SETTINGS:
• Short Period (default: 30) - Fast signal responsiveness
• Long Period (default: 250) - Baseline stability
• ALMA Offset (default: 0.90) - Balance between lag and smoothness
• ALMA Sigma (default: 7.5) - Gaussian curve width
ENTRY/EXIT FILTERS:
• Buy Lookback (default: 7) - Bars for momentum confirmation (required)
• Sell Lookback (default: 0) - Exit momentum bars (0 = disabled for faster exits)
• Min Crossover Strength (default: 0.0) - Required ALMA separation (0 = disabled)
• Use Macro Filter (default: true) - Only enter above 200 EMA
BEST PRACTICES
RECOMMENDED ASSETS - Works well on:
• Cryptocurrencies (Bitcoin, Ethereum, etc.)
• Major indices (S&P 500, Nasdaq)
• Large-cap stocks
• Commodities (Gold, Oil)
RECOMMENDED TIMEFRAMES:
• Daily: Primary timeframe for swing trading
• 4-Hour: More active trading (increase trade frequency)
• Weekly: Long-term position trading
PARAMETER TUNING:
• More trades: Lower Short Period (60-80)
• Fewer trades: Raise Short Period (100-120)
• Faster exits: Set Sell Lookback = 0
• Safer entries: Enable Macro Filter (Use Macro Filter = true)
STRATEGY ADVANTAGES
1. Low Lag - ALMA provides faster signals than traditional moving averages
2. Smooth Signals - Minimal whipsaws compared to crossover strategies
3. Asset Agnostic - Same parameters work across different markets
4. Trend Capture - Stays positioned during entire bullish regimes
5. Risk Management - Multiple filters prevent poor entries
6. Visual Clarity - Easy to interpret regime and filter states
WHEN TO USE HERMES
BEST FOR:
• Trending markets (crypto bull runs, equity uptrends)
• Swing trading (hold days to weeks)
• Position trading (hold weeks to months)
• Clear trend identification
• Risk-managed exposure
NOT SUITABLE FOR:
• Ranging/sideways markets
• Scalping or day trading
• High-frequency trading
• Mean reversion strategies
RISK DISCLAIMER
This indicator is for educational purposes only. Past performance does not guarantee future results. Always use proper position sizing and risk management. Test thoroughly on historical data before live trading.
CREDITS
Inspired by Giovanni Santostasi's Power Law Volatility Indicator, generalized for universal application across all assets using adaptive ALMA filtering.
Strategy by Hermes Trading Systems
QUICK START
1. Add indicator to chart
2. Use on daily timeframe for best results
3. Look for green buy signals when blue line crosses above black line
4. Exit on red sell signals when blue line crosses below black line
5. Adjust parameters based on your trading style:
• Conservative: Enable Macro Filter, increase Buy Lookback to 10
• Aggressive: Disable Macro Filter, lower Short Period to 60
• Default settings work well for most assets

TEMA 20/34/55 Strategie mit Buy & SellThis indicator uses three Triple Exponential Moving Averages (TEMA) with periods 20 (green), 34 (blue), and 55 (red) to identify trend direction.
A buy signal is generated when TEMA20 crosses above TEMA34 and TEMA34 crosses above TEMA55 (bullish trend start).
A sell signal is generated when TEMA20 crosses below TEMA34 and TEMA34 crosses below TEMA55 (bearish trend start).
The strategy enters long and short positions with configurable stop loss and take profit levels.
Ideal for trend following and suitable for intraday or swing trading.

AlgoWay GRSIM🧭 What this strategy tries to do
This strategy detects when a market move is losing strength and prepares for a potential reversal, but it waits for fresh momentum confirmation before acting.
It combines:
• RSI-based divergence (to spot exhaustion and potential turning points),
• Impulse MACD (to verify that the new direction actually has force behind it).
________________________________________
⚙️ When it takes trades
Long (Buy):
• A bullish RSI divergence appears (a clue that selling pressure is fading);
• Within a short time window, the Impulse MACD turns strongly positive;
• Optionally, the impulse line itself must be rising (if the Impulse Direction Filter is
enabled).
Short (Sell):
• A bearish RSI divergence appears (buying pressure fading);
• Within a short time window, the Impulse MACD turns strongly negative;
• Optionally, the impulse line must be falling (if the Impulse Direction Filter is enabled).
If momentum confirmation happens too late, the divergence “expires” and the signal is ignored.
________________________________________
🧩 How entries work
1. Reversal clue:
The strategy detects disagreement between price and RSI (price makes a new high/low, RSI doesn’t).
That suggests a shift in underlying strength.
2. Momentum confirmation:
Before entering, the Impulse MACD must agree — showing real push in the same direction.
3. Impulse direction filter (optional):
When enabled, the impulse itself must accelerate (rise for longs, fall for shorts), avoiding fake signals where price diverges but momentum is still fading.
4. No stacking:
It opens only one position at a time.
________________________________________
🚪 How exits work
Two main exit styles:
Conservative (default):
Longs close when impulse crosses below its signal line.
Shorts close when impulse crosses above its signal line.
✅ Keeps trades as long as momentum agrees.
Color-change (fast):
Longs close immediately when impulse flips bearish.
Shorts close immediately when impulse flips bullish.
⚡ Faster and more defensive.
Plus:
Stop Loss (%) and Take Profit (%) act as fixed-distance protective exits (set to 0 to disable either one).
________________________________________
📊 What you’ll see on the chart
A thick Impulse MACD line and thin signal line (oscillator view).
Diamonds — detected bullish/bearish divergence points.
Circles — where impulse crosses its signal (momentum change).
A performance panel (top-right) showing Net Profit, Trades, Win Rate, Profit Factor, Pessimistic PF, and Max Drawdown.
________________________________________
🔧 What you can tune
Signal Lifetime (bars): how long a divergence remains valid.
Impulse Direction Filter: ensure the impulse itself is moving in the trade’s direction.
Stop Loss / Take Profit (%): risk and target in percent.
Exit Style: conservative cross or faster color-change.
RSI / MA / Signal Lengths: adjust responsiveness (defaults are balanced).
________________________________________
💪 Strengths
Confirms reversals using momentum direction, not just divergence.
Avoids “early” signals where momentum is still fading.
Works symmetrically for longs and shorts.
Built-in stop/target protection.
Clear, visual confirmation of all logic components.
________________________________________
⚠️ Things to keep in mind
In sideways markets, the impulse can flip often — prefer conservative exits.
Too small SL/TP → constant stop-outs.
Too wide SL/TP → deep drawdowns.
Always test with different timeframes and markets.
________________________________________
💡 Practical tips
Start with default settings.
Enable “Use Impulse Direction Filter” in trending markets, disable it in very choppy ones.
Focus on Profit Factor, Win Rate, and Max Drawdown after several dozen trades.
Keep SL/TP roughly aligned with typical swing size.
“AlgoWay GRSIM” is a reversal-with-confirmation strategy: it spots likely turns, demands real momentum alignment (optionally verified by impulse direction), and manages exits with clear momentum cues plus built-in protective limits.

Quantum Flux Universal Strategy Summary in one paragraph
Quantum Flux Universal is a regime switching strategy for stocks, ETFs, index futures, major FX pairs, and liquid crypto on intraday and swing timeframes. It helps you act only when the normalized core signal and its guide agree on direction. It is original because the engine fuses three adaptive drivers into the smoothing gains itself. Directional intensity is measured with binary entropy, path efficiency shapes trend quality, and a volatility squash preserves contrast. Add it to a clean chart, watch the polarity lane and background, and trade from positive or negative alignment. For conservative workflows use on bar close in the alert settings when you add alerts in a later version.
Scope and intent
• Markets. Large cap equities and ETFs. Index futures. Major FX pairs. Liquid crypto
• Timeframes. One minute to daily
• Default demo used in the publication. QQQ on one hour
• Purpose. Provide a robust and portable way to detect when momentum and confirmation align, while dampening chop and preserving turns
• Limits. This is a strategy. Orders are simulated on standard candles only
Originality and usefulness
• Unique concept or fusion. The novelty sits in the gain map. Instead of gating separate indicators, the model mixes three drivers into the adaptive gains that power two one pole filters. Directional entropy measures how one sided recent movement has been. Kaufman style path efficiency scores how direct the path has been. A volatility squash stabilizes step size. The drivers are blended into the gains with visible inputs for strength, windows, and clamps.
• What failure mode it addresses. False starts in chop and whipsaw after fast spikes. Efficiency and the squash reduce over reaction in noise.
• Testability. Every component has an input. You can lengthen or shorten each window and change the normalization mode. The polarity plot and background provide a direct readout of state.
• Portable yardstick. The core is normalized with three options. Z score, percent rank mapped to a symmetric range, and MAD based Z score. Clamp bounds define the effective unit so context transfers across symbols.
Method overview in plain language
The strategy computes two smoothed tracks from the chart price source. The fast track and the slow track use gains that are not fixed. Each gain is modulated by three drivers. A driver for directional intensity, a driver for path efficiency, and a driver for volatility. The difference between the fast and the slow tracks forms the raw flux. A small phase assist reduces lag by subtracting a portion of the delayed value. The flux is then normalized. A guide line is an EMA of a small lead on the flux. When the flux and its guide are both above zero, the polarity is positive. When both are below zero, the polarity is negative. Polarity changes create the trade direction.
Base measures
• Return basis. The step is the change in the chosen price source. Its absolute value feeds the volatility estimate. Mean absolute step over the window gives a stable scale.
• Efficiency basis. The ratio of net move to the sum of absolute step over the window gives a value between zero and one. High values mean trend quality. Low values mean chop.
• Intensity basis. The fraction of up moves over the window plugs into binary entropy. Intensity is one minus entropy, which maps to zero in uncertainty and one in very one sided moves.
Components
• Directional Intensity. Measures how one sided recent bars have been. Smoothed with RMA. More intensity increases the gain and makes the fast and slow tracks react sooner.
• Path Efficiency. Measures the straightness of the price path. A gamma input shapes the curve so you can make trend quality count more or less. Higher efficiency lifts the gain in clean trends.
• Volatility Squash. Normalizes the absolute step with Z score then pushes it through an arctangent squash. This caps the effect of spikes so they do not dominate the response.
• Normalizer. Three modes. Z score for familiar units, percent rank for a robust monotone map to a symmetric range, and MAD based Z for outlier resistance.
• Guide Line. EMA of the flux with a small lead term that counteracts lag without heavy overshoot.
Fusion rule
• Weighted sum of the three drivers with fixed weights visible in the code comments. Intensity has fifty percent weight. Efficiency thirty percent. Volatility twenty percent.
• The blend power input scales the driver mix. Zero means fixed spans. One means full driver control.
• Minimum and maximum gain clamps bound the adaptive gain. This protects stability in quiet or violent regimes.
Signal rule
• Long suggestion appears when flux and guide are both above zero. That sets polarity to plus one.
• Short suggestion appears when flux and guide are both below zero. That sets polarity to minus one.
• When polarity flips from plus to minus, the strategy closes any long and enters a short.
• When flux crosses above the guide, the strategy closes any short.
What you will see on the chart
• White polarity plot around the zero line
• A dotted reference line at zero named Zen
• Green background tint for positive polarity and red background tint for negative polarity
• Strategy long and short markers placed by the TradingView engine at entry and at close conditions
• No table in this version to keep the visual clean and portable
Inputs with guidance
Setup
• Price source. Default ohlc4. Stable for noisy symbols.
• Fast span. Typical range 6 to 24. Raising it slows the fast track and can reduce churn. Lowering it makes entries more reactive.
• Slow span. Typical range 20 to 60. Raising it lengthens the baseline horizon. Lowering it brings the slow track closer to price.
Logic
• Guide span. Typical range 4 to 12. A small guide smooths without eating turns.
• Blend power. Typical range 0.25 to 0.85. Raising it lets the drivers modulate gains more. Lowering it pushes behavior toward fixed EMA style smoothing.
• Vol window. Typical range 20 to 80. Larger values calm the volatility driver. Smaller values adapt faster in intraday work.
• Efficiency window. Typical range 10 to 60. Larger values focus on smoother trends. Smaller values react faster but accept more noise.
• Efficiency gamma. Typical range 0.8 to 2.0. Above one increases contrast between clean trends and chop. Below one flattens the curve.
• Min alpha multiplier. Typical range 0.30 to 0.80. Lower values increase smoothing when the mix is weak.
• Max alpha multiplier. Typical range 1.2 to 3.0. Higher values shorten smoothing when the mix is strong.
• Normalization window. Typical range 100 to 300. Larger values reduce drift in the baseline.
• Normalization mode. Z score, percent rank, or MAD Z. Use MAD Z for outlier heavy symbols.
• Clamp level. Typical range 2.0 to 4.0. Lower clamps reduce the influence of extreme runs.
Filters
• Efficiency filter is implicit in the gain map. Raising efficiency gamma and the efficiency window increases the preference for clean trends.
• Micro versus macro relation is handled by the fast and slow spans. Increase separation for swing, reduce for scalping.
• Location filter is not included in v1.0. If you need distance gates from a reference such as VWAP or a moving mean, add them before publication of a new version.
Alerts
• This version does not include alertcondition lines to keep the core minimal. If you prefer alerts, add names Long Polarity Up, Short Polarity Down, Exit Short on Flux Cross Up in a later version and select on bar close for conservative workflows.
Strategy has been currently adapted for the QQQ asset with 30/60min timeframe.
For other assets may require new optimization
Properties visible in this publication
• Initial capital 25000
• Base currency Default
• Default order size method percent of equity with value 5
• Pyramiding 1
• Commission 0.05 percent
• Slippage 10 ticks
• Process orders on close ON
• Bar magnifier ON
• Recalculate after order is filled OFF
• Calc on every tick OFF
Honest limitations and failure modes
• Past results do not guarantee future outcomes
• Economic releases, circuit breakers, and thin books can break the assumptions behind intensity and efficiency
• Gap heavy symbols may benefit from the MAD Z normalization
• Very quiet regimes can reduce signal contrast. Use longer windows or higher guide span to stabilize context
• Session time is the exchange time of the chart
• If both stop and target can be hit in one bar, tie handling would matter. This strategy has no fixed stops or targets. It uses polarity flips for exits. If you add stops later, declare the preference
Open source reuse and credits
• None beyond public domain building blocks and Pine built ins such as EMA, SMA, standard deviation, RMA, and percent rank
• Method and fusion are original in construction and disclosure
Legal
Education and research only. Not investment advice. You are responsible for your decisions. Test on historical data and in simulation before any live use. Use realistic costs.
Strategy add on block
Strategy notice
Orders are simulated by the TradingView engine on standard candles. No request.security() calls are used.
Entries and exits
• Entry logic. Enter long when both the normalized flux and its guide line are above zero. Enter short when both are below zero
• Exit logic. When polarity flips from plus to minus, close any long and open a short. When the flux crosses above the guide line, close any short
• Risk model. No initial stop or target in v1.0. The model is a regime flipper. You can add a stop or trail in later versions if needed
• Tie handling. Not applicable in this version because there are no fixed stops or targets
Position sizing
• Percent of equity in the Properties panel. Five percent is the default for examples. Risk per trade should not exceed five to ten percent of equity. One to two percent is a common choice
Properties used on the published chart
• Initial capital 25000
• Base currency Default
• Default order size percent of equity with value 5
• Pyramiding 1
• Commission 0.05 percent
• Slippage 10 ticks
• Process orders on close ON
• Bar magnifier ON
• Recalculate after order is filled OFF
• Calc on every tick OFF
Dataset and sample size
• Test window Jan 2, 2014 to Oct 16, 2025 on QQQ one hour
• Trade count in sample 324 on the example chart
Release notes template for future updates
Version 1.1.
• Add alertcondition lines for long, short, and exit short
• Add optional table with component readouts
• Add optional stop model with a distance unit expressed as ATR or a percent of price
Notes. Backward compatibility Yes. Inputs migrated Yes.

Ekoparaloji Cyrpto StrategyEkoparaloji Crypto Strategy - User Information Document
📊 Strategy Overview
This strategy provides long-term position management in cryptocurrency markets using the averaging down (pyramiding) technique. The basic logic is to controllably grow positions as prices decline and exit when specific profit targets are reached.
🎯 Key Features
✅ Automatic Entry System
Market direction is determined using a proprietary trend identification algorithm
Trades are only opened in uptrends
Initial position opens automatically when specific conditions are met
📈 Pyramiding Mechanism
New positions are automatically added as price decreases
Up to 10 positions can be added maximum
Each addition occurs at predetermined decline levels
Risk management through dynamic position sizing
💰 Profit and Loss Management
Take Profit: All positions close when the specified percentage above average cost is reached
Stop Loss (Optional): Protects a specified percentage of total capital
A certain ratio of available capital is used in each trade
📊 Visual Tracking System
The following information is displayed in real-time on the chart:
✅ Average cost level
✅ Profit target level
✅ Stop loss level (if active)
✅ Next pyramiding level
✅ Liquidation (capital reset) level
✅ Trend indicator
🛡️ Risk Management Features
1. Dynamic Capital Protection
Automatic exit when losses exceed a specified percentage of total capital
Complete loss scenario can be previewed through liquidation level calculation
2. Position Control System
Protection preventing multiple trades on the same bar
Double trigger prevention mechanism
Maximum position limit
3. Time Filter
Optional trading within a date range
Ideal for testing on historical data
📱 Information Panel
Information table always visible in the upper right corner of the strategy:
When Position is Open:
Number of active positions
Average cost
Current price
Total capital status
Capital loss percentage
Profit target
Stop loss level and distance
Next entry level
Liquidation level and distance
When No Position:
Market trend (Uptrend/Downtrend)
Ready to trade?
Reason for waiting
Initial position size
Target profit percentage
⚙️ Adjustable Parameters
Customizable by user:
💵 Capital Amount: Base amount to be used for each position
📊 Profit Target: Profit percentage at which to exit
🛑 Stop Loss: Usage status and maximum loss percentage
📅 Time Filter: Start and end dates for testing
💬 Trade Comments: Custom labels for each trade
📘 Understanding Leverage Effect
1. What is the Leverage Effect?
Although there's no real leverage in the spot market, when Capital Amount is increased, capital usage works like leverage:
Capital Amount 5% (1.0x): 100% capital usage with full pyramiding = All your money in trades
Capital Amount 10% (2.0x): 200% capital usage with full pyramiding = Attempting to open trades worth 2x your capital
Capital Amount 15% (3.0x): 300% capital usage with full pyramiding = Attempting to open trades worth 3x your capital
⚠️ IMPORTANT: If your capital runs out in the spot market, you cannot open new positions, therefore it's recommended to keep Capital Amount at 5% or below!
⚠️ Important Warnings
Pyramiding Risk: If price continues to decline, position grows and risk increases
Capital Requirements: Up to 10 positions can be added, requiring sufficient capital
Trend Dependency: Only works in uptrends
Backtest Results: Past performance is not a guarantee of future results
Real Trading Risks: Slippage, commissions, and market conditions can affect results
🎓 How to Use
Add the strategy to your chart
Adjust parameters according to your risk appetite
Examine past performance by backtesting
Optionally set up alerts to activate notifications
Test with paper trading first
This strategy is for educational purposes. Do your own research and only trade with capital you can afford to lose.
Disclaimer: This strategy is not financial advice. All investment decisions are the user's responsibility.
Happy trading! 📊

Ekoparaloji Strategy Crypto Ekoparaloji Crypto Strategy - User Information Document
📊 Strategy Overview
This strategy provides long-term position management in cryptocurrency markets using the averaging down (pyramiding) technique. The basic logic is to controllably grow positions as prices decline and exit when specific profit targets are reached.
🎯 Key Features
✅ Automatic Entry System
Market direction is determined using a proprietary trend identification algorithm
Trades are only opened in uptrends
Initial position opens automatically when specific conditions are met
📈 Pyramiding Mechanism
New positions are automatically added as price decreases
Up to 10 positions can be added maximum
Each addition occurs at predetermined decline levels
Risk management through dynamic position sizing
💰 Profit and Loss Management
Take Profit: All positions close when the specified percentage above average cost is reached
Stop Loss (Optional): Protects a specified percentage of total capital
A certain ratio of available capital is used in each trade
📊 Visual Tracking System
The following information is displayed in real-time on the chart:
✅ Average cost level
✅ Profit target level
✅ Stop loss level (if active)
✅ Next pyramiding level
✅ Liquidation (capital reset) level
✅ Trend indicator
🛡️ Risk Management Features
1. Dynamic Capital Protection
Automatic exit when losses exceed a specified percentage of total capital
Complete loss scenario can be previewed through liquidation level calculation
2. Position Control System
Protection preventing multiple trades on the same bar
Double trigger prevention mechanism
Maximum position limit
3. Time Filter
Optional trading within a date range
Ideal for testing on historical data
📱 Information Panel
Information table always visible in the upper right corner of the strategy:
When Position is Open:
Number of active positions
Average cost
Current price
Total capital status
Capital loss percentage
Profit target
Stop loss level and distance
Next entry level
Liquidation level and distance
When No Position:
Market trend (Uptrend/Downtrend)
Ready to trade?
Reason for waiting
Initial position size
Target profit percentage
⚙️ Adjustable Parameters
Customizable by user:
💵 Capital Amount: Base amount to be used for each position
📊 Profit Target: Profit percentage at which to exit
🛑 Stop Loss: Usage status and maximum loss percentage
📅 Time Filter: Start and end dates for testing
💬 Trade Comments: Custom labels for each trade
📘 Understanding Leverage Effect
1. What is the Leverage Effect?
Although there's no real leverage in the spot market, when Capital Amount is increased, capital usage works like leverage:
Capital Amount 5% (1.0x): 100% capital usage with full pyramiding = All your money in trades
Capital Amount 10% (2.0x): 200% capital usage with full pyramiding = Attempting to open trades worth 2x your capital
Capital Amount 15% (3.0x): 300% capital usage with full pyramiding = Attempting to open trades worth 3x your capital
⚠️ IMPORTANT: If your capital runs out in the spot market, you cannot open new positions, therefore it's recommended to keep Capital Amount at 5% or below!
⚠️ Important Warnings
Pyramiding Risk: If price continues to decline, position grows and risk increases
Capital Requirements: Up to 10 positions can be added, requiring sufficient capital
Trend Dependency: Only works in uptrends
Backtest Results: Past performance is not a guarantee of future results
Real Trading Risks: Slippage, commissions, and market conditions can affect results
🎓 How to Use
Add the strategy to your chart
Adjust parameters according to your risk appetite
Examine past performance by backtesting
Optionally set up alerts to activate notifications
Test with paper trading first
This strategy is for educational purposes. Do your own research and only trade with capital you can afford to lose.
Disclaimer: This strategy is not financial advice. All investment decisions are the user's responsibility.

Bitcoin Halving Strategy
A systematic, data-driven trading strategy based on Bitcoin's 4-year halving cycles. This strategy capitalizes on historical price patterns that emerge around halving events, providing clear entry and exit signals for both accumulation and profit-taking phases.
🎯 Strategy Overview
This automated trading system identifies optimal buy and sell zones based on the predictable Bitcoin halving cycle that occurs approximately every 4 years. By analyzing historical data from all previous halvings (2012, 2016, 2020, 2024), the strategy pinpoints high-probability trading opportunities.
📊 Key Features
Automated Signal Generation: Buy signals at halving events and DCA zones, sell signals at profit-taking peaks
Multi-Phase Analysis: Tracks Accumulation, Profit Taking, Bear Market, and DCA phases
Visual Dashboard: Real-time performance metrics, phase countdown, and position tracking
Backtesting Enabled: Comprehensive historical performance analysis with configurable parameters
Risk Management: Built-in position sizing, slippage control, and optional short trading
⚙️ Strategy Logic
Buy Signals:
At halving event (Week 0)
DCA zone entry (Week 135 post-halving)
Sell Signals:
Profit-taking zone (Week 80 post-halving)
Optional short position entry for advanced traders
📈 Performance Highlights
Captures major bull run profits while avoiding prolonged bear markets
Clear visual indicators for all phases and transitions
Customizable timing parameters for personalized risk tolerance
Professional dashboard with live P&L, win rate, and drawdown metrics
🛠️ Customization Options
Adjustable phase timing (profit start/end, DCA timing)
Position sizing control
Enable/disable short trading
Visual customization (colors, labels, zones)
Table positioning and transparency
⚠️ Risk Disclosure
Past performance does not guarantee future results. This strategy is based on historical halving cycle patterns and should be used as part of a comprehensive trading plan. Always conduct your own research and consider your risk tolerance before trading.
💡 Ideal For
Long-term Bitcoin investors seeking systematic entry/exit points
Swing traders capitalizing on multi-month trends
Portfolio managers implementing cycle-based allocation strategies

OneHolo-TGAPSNRTGAPSNR: Multi time frame - Trend Gap Stop And Reverse strategy/Study PnL. This script outlines a systematic approach to generating buy and sell signals by combining Fair Value Gaps (FVGs), specific market structures, and three different trend direction methods (Swing, Gravity, and FVG Inverse direction). The strategy incorporates multiple entry modes, such as Hyper Mode, Swiper Mode, and a Custom mode, allowing users to tailor signal conditions, alongside extensive logic for trade management, higher time frame analysis, and various visual indicators for plotting trend, pivots, and profit and loss information.
I. Core Trend Direction Consensus (The Three-Pillar System)
The primary method for determining market bias is a three-pillar consensus model, requiring all directional methods to align before the overall Trend Direction is established (up or down). This ensures high conviction for trend signals.
• Pillar 1: Swing Direction: Determines market direction based on classic price action, specifically checking for continuous higher highs and higher lows for an upward bias, or lower lows and lower highs for a downward bias.
• Pillar 2: Gravity Direction (Peak and Valley): This uses specific market structure pivots. Direction is set based on whether the close price successfully crosses the established recent Peak High (indicating upward momentum) or crosses under the recent Valley Low (indicating downward pressure).
• Pillar 3: FVG Inverse Direction: This relies on Fair Value Gaps (FVGs), defined as a gap between the current bar's price and the price two bars prior. Direction shifts occur when the Close price crosses the midpoint of the last relevant FVG. For instance, crossing above the midpoint of the last FVG Down signals a potential inverse long trade.
II. Flexible Signal Generation Modes
The strategy offers several pre-configured and highly detailed entry modes, plus a powerful Custom Mode:
• Session Open Range Break (ORB) Mode: Uses the high/low of the session's first bar to generate initial signals, then defaults to the Three-Pillar Trend Direction after the ORB session concludes.
• Swiper Mode: Designed to identify continuations, combining a confirmed Trend Direction with a Stop and Reverse signal (SnR) while actively avoiding confirmed pivot breaks.
• Hyper/Aggressive Modes: These modes use broad combinations of signals, allowing for earlier entry based on momentum and structural breaks (like PeakCrossLong, SnRtrapLong, or FVG signals).
• Custom Query Mode (The Seven-Slot Logic): This non-redundant system allows the user to define complex, tailored entry conditions by selecting any combination of 14 core patterns across seven distinct slots.
◦ AND/OR Combination: For each of the seven slots, the user determines if the chosen pattern must be met (AND component) or if it can serve as an alternative trigger (OR component).
◦ The final signal requires that all configured AND conditions are true and then integrates the result of the OR conditions, allowing for highly specific "hook queries" (e.g., "Condition A AND Condition B, OR Condition C").
III. Advanced PnL and Mobile App Diagnostics
A key proprietary element is the implementation of a dual PnL system and customized visualization features:
• Dual PnL Display (Strategy PnL vs. Study PnL): Users can choose to view either the native platform's strategy performance data or the script's internal, proprietary Study PnL. The Study PnL calculates profits/losses based strictly on the close price and tracks performance using Pine Script® arrays, providing a transparent, diagnostic view of performance independent of broker/platform simulation biases.
• Lower Panel Visualization: Both PnL types are displayed on the lower panel using detailed bar plots (style=plot.style_columns), which color according to profitability, and include labels that show current open profit and total net profit.
• Detailed Trade Labels: The script generates detailed, customizable labels on both the chart (above/below bars) and the lower PnL panel, providing historical PnL, number of trades, and real-time profit information for each entry or exit.
IV. Higher Time Frame (HTF) Context and Lookahead Prevention
The strategy integrates multi-time frame analysis using strict methodology to prevent lookahead bias:
• HTF Bias Filtering: When enabled, the strategy uses the position calculated on a user-defined higher time frame (HTF) as a mandatory filter. A long signal on the current chart is only executed if the HTF is also in a long position, and vice-versa.
• Lookahead Prevention: To maintain integrity, all HTF data requests use a mandatory lookback index (often ) to ensure the script only accesses confirmed data from the prior completed bar on the higher timeframe.
• HTF Visual Mode: The user can opt to display key structural elements—such as the Gravity Pivots and the Trend Direction blocks—as calculated on the HTF, overlaying this higher-level context onto the current chart for visual analysis.
The TGAPSNR: Multi time frame - Trend Gap Stop And Reverse strategy/Study PnL script, despite its complexity, intentionally excludes realistic considerations such as fees, slippage, and explicit risk management settings (like fixed stop-loss or take-profit rules) from its primary logic.
Here is an explanation of why these elements are omitted in the strategy's current implementation and why they must be applied by the user for real-world application, drawing on the context of the sources:
1. Absence of Realistic Fees, Commissions, and Slippage
The primary function of the TGAPSNR script is to execute intricate signal generation and diagnostic PnL calculation based on its three-pillar trend system and Custom Mode logic.
However, the strategy's backtesting results, particularly those displayed by the internal Study PnL feature, are based purely on price difference (e.g., (close - lse) * syminfo.pointvalue * IUnits).
• Strategy Result Requirements: TradingView explicitly states that strategies published publicly should strive to use realistic commission AND slippage when calculating backtesting results to avoid misleading traders.
• User Responsibility: Since the script currently focuses on signal integrity and uses a fixed contract size (IUnits = 1) without configurable commission/slippage inputs shown in the source, the user must manually configure these fees within the Pine Script® Strategy Tester settings (Properties tab) to ensure the strategy results are reflective of actual trading costs.
2. Omission of Built-in Risk Management (Stop-Loss and Take-Profit)
The TGAPSNR strategy's core focuses on entry signals and trend confirmation. Exits are primarily governed by:
• Reversal signals (BuyStop or SellStop).
• End-of-Day (EOD) session closures (EODStop).
• HTF bias opposition.
What is Missing: The script does not include explicit, hard-coded risk management parameters for traditional stop-loss (SL) or take-profit (TP) levels (e.g., risk percentage or ATR-based exits).
• Viable Risk: TradingView guidelines stipulate that strategies should generally risk sustainable amounts of equity, usually not exceeding 5-10% on a single trade, and trade size must be appropriate.
• User Application: To ensure the strategy operates within realistic risk boundaries, users must apply their own risk management rules. This includes:
◦ Implementing realistic stops and profit targets, which can be added via Pine Script® code or manually managed during live trading.
◦ Sizing trades to only risk sustainable amounts of equity. The current default unit size (IUnits = 1) is unrealistic for risk assessment unless the symbol is micro-sized.
3. Execution Quality (Fills)
The strategy is set to fill_orders_on_standard_ohlc = true and operates on confirmed bar closes (barstate.isconfirmed).
• Fill Assumption: This suggests the strategy primarily uses close price or the HTF close price (EntryPrice = HTFClose) for execution.
• Real-World Limitation: In volatile markets, obtaining a fill price equal to the close of the bar is rare. The user must be aware that the simulated fill price shown in backtesting may differ significantly from actual execution prices due to market action and chosen order type, reinforcing the importance of applying slippage settings.
In summary, while the script provides highly detailed and unique signal generation and internal PnL diagnostics, users must exercise caution and apply their own realistic parameters for fees, slippage, and explicit risk controls to prevent misleading performance results and ensure viable trading
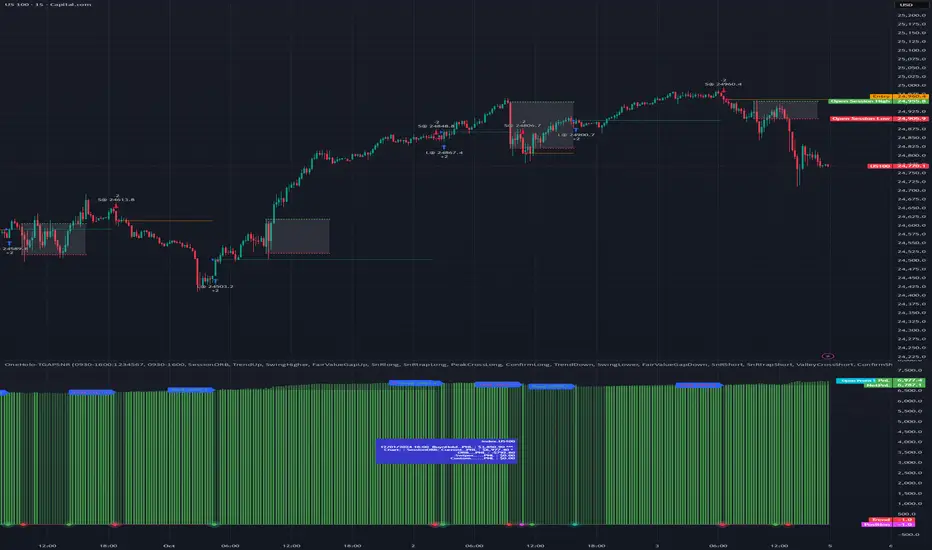
Kz GC1! ORBStrategy that trades breakouts on GC1! futures on the 5min timeframe. It also works on MGC1! for lower drawdown and to manage Apex and Top Step accounts with the lower risk.
Risk Disclaimer:
Past results as well as strategy tester reports do not indicate future performance. Guarantees do not exist in trading. By using this strategy you risk losing all your money.
Important:
It trades all days that markets are open. Set times may be seen on settings. Trades multiple times a day sometimes.
It works on the 5 and 15min timeframe only. Results are better on 5min timeframe.
The settings are optimized already for GC1! on the 5min timeframe.
How it works:
Every trading day it measures the range of the first 15min candle of pre-selected hours. As soon as price closes above or below on the 15min timeframe, it will trade the breakout targeting a set risk to reward ratio. SL on the opposite side of the range.
Settings:
Hourly Trading Hours: These are the times that worked best for this strategy. All boxes should be checked for best results. Excluded times were when it performed bad which is why those times have been left out.
ORB Formation Period: This setting determines on which timeframe candle has to close outside the opening range box in order to take a trade. It's set to 15min by default because this is what worked by far the best
Entry Type: Entries are immediate instead of waiting for a pull back to enter on a limit order.
Limit Orders: If enabled, the strategy will place a pending order x points from the current price, instead of a market order. Immediate orders are enabled by default for a better performance. Important: It doesn't actually place a limit order. The strategy will just wait for a pullback and then enter with a market order. It's more like a hidden limit order.
Limit Order Offset Points: If you have limit orders enabled, this setting determines how many points from the current price the limit order will be placed.
FVG Detection Type: How fast it detects the fair value gaps. Standard detection over immediate had better performance
Risk Type: You can chose either between Fixed USD Amount, Risk per Trade in % or Fixed Contract Size. By default it's set to fixed contract size.
Risk Amount (USD or Contracts): This setting is to set how many USD or how many contracts you want to risk per trade. Make sure to check which risk type you have selected before you choose the risk amount.
Take Profit Multiplier: This is simply the total SL size in points multiplied by x.
Example: If you put 2, you get a 2:1 Risk to Reward Ratio. By Default it's set to 2.5 because this gave the best results in backtests.
Stop Loss Padding: This is simply the buffer in points that is added to the SL for safety reasons. If you have it on 0, the SL will be at the exact price of the opposite side of the range. By default it's set to 5 because this is what delivered the best results in backtests.
Stop Loss Placement: This determines where the stop loss gets placed for the order. It has been set to ORB Range by default as this delivered the best results.
Max Trades Per Hour: This allows the user to decide how many trades are taken an hour. 1 is been set to default for best results
Visual Settings: Check boxes to show orb range, FVG's, Entry points, and trade visualization boxes.
Backtest Settings:
For the backtest the commissions were set to 1.29USD per contract and .35USD for micros which is the highest amount Tradovate charges Margin was not accounted for because typically on prop accounts you can use way more contracts than you need for the extremely low max drawdown. Margin would be important on personal accounts but even there typically it's not an issue at all especially because this strategy runs on the 15min timeframe so it won't use a lot of contracts anyways.
Why the source code is hidden:
The source code is hidden because I invested a lot of time and money into developing this strategy and optimizing it with paid 3rd party software.

RSI Momentum ScalperOverview
The "RSI Momentum Scalper" is a Pine Script v5 strategy crafted for trading highly volatile markets, with a special focus on newly listed cryptocurrencies. This strategy harnesses the Relative Strength Index (RSI) alongside volume analysis and momentum thresholds to pinpoint short-term trading opportunities. It supports both long and short trades, managed with customizable take profit, stop loss, and trailing stop levels, which are visually plotted on the chart for easy tracking.
Why I Created This Strategy
I developed the "RSI Momentum Scalper" because I was seeking a reliable trading strategy tailored to newly listed, highly volatile cryptocurrencies. These assets often experience rapid price fluctuations, rendering traditional strategies less effective. I aimed to create a tool that could exploit momentum and volume spikes while managing risk through adaptable exit parameters. This strategy is designed to address that need, offering a flexible approach for traders in dynamic crypto markets.
How It Works
The strategy utilizes RSI to identify momentum shifts, combined with volume confirmation, to trigger long or short entries. Trades are controlled with take profit, stop loss, and trailing stop levels, which adjust dynamically as the price moves in your favor. The trailing stop helps lock in profits, while the plotted exit levels provide clear visual cues for trade management.
Customizable Settings
The script is highly customizable, allowing you to adjust it to various market conditions and trading styles. Here’s a brief overview of the key settings:
Trade Mode: Select "Both," "Long Only," or "Short Only" to determine the trade direction.
(Default: Both)
RSI Length: Sets the lookback period for the RSI calculation (2 to 30).
(Default: 8)
A shorter length increases RSI sensitivity, suitable for volatile assets.
RSI Overbought: Defines the upper RSI threshold (60 to 99) for short entries.
(Default: 90)
Higher values signal stronger overbought conditions.
RSI Oversold: Defines the lower RSI threshold (1 to 40) for long entries.
(Default: 10)
Lower values indicate stronger oversold conditions.
RSI Momentum Threshold: Sets the minimum RSI momentum change (1 to 15) to trigger entries.
(Default: 14)
Adjusts the sensitivity to price momentum.
Volume Multiplier: Multiplies the volume moving average to filter high-volume bars (1.0 to 3.0).
(Default: 1)
Higher values require stronger volume confirmation.
Volume MA Length: Sets the lookback period for the volume moving average (5 to 50).
(Default: 13)
Influences the volume trend sensitivity.
Take Profit %: Sets the profit target as a percentage of the entry price (0.1 to 10.0).
(Default: 4.15)
Determines when to close a winning trade.
Stop Loss %: Sets the loss limit as a percentage of the entry price (0.1 to 6.0).
(Default: 1.85)
Protects against significant losses.
Trailing Stop %: Sets the trailing stop distance as a percentage (0.1 to 4.0).
(Default: 2.55)
Locks in profits as the price moves favorably.
Visual Features
Exit Levels: Take profit (green), fixed stop loss (red), and trailing stop (orange) levels are plotted when in a position.
Performance Table: Displays win rate, total trades, and net profit in the top-right corner.
How to Use
Add the strategy to your chart in TradingView.
Adjust the input settings based on the cryptocurrency and timeframe you’re trading.
Monitor the plotted exit levels for trade management.
Use the performance table to assess the strategy’s performance over time.
Notes
Test the strategy on a demo account or with historical data before live trading.
The strategy is optimized for short-term scalping; adjust settings for longer timeframes if needed.

Order Block Volumatic FVG StrategyInspired by: Volumatic Fair Value Gaps —
License: CC BY-NC-SA 4.0 (Creative Commons Attribution–NonCommercial–ShareAlike).
This script is a non-commercial derivative work that credits the original author and keeps the same license.
What this strategy does
This turns BigBeluga’s visual FVG concept into an entry/exit strategy. It scans bullish and bearish FVG boxes, measures how deep price has mitigated into a box (as a percentage), and opens a long/short when your mitigation threshold and filters are satisfied. Risk is managed with a fixed Stop Loss % and a Trailing Stop that activates only after a user-defined profit trigger.
Additions vs. the original indicator
✅ Strategy entries based on % mitigation into FVGs (long/short).
✅ Lower-TF volume split using upticks/downticks; fallback if LTF data is missing (distributes prior bar volume by close’s position in its H–L range) to avoid NaN/0.
✅ Per-FVG total volume filter (min/max) so you can skip weak boxes.
✅ Age filter (min bars since the FVG was created) to avoid fresh/immature boxes.
✅ Bull% / Bear% share filter (the 46%/53% numbers you see inside each FVG).
✅ Optional candle confirmation and cooldown between trades.
✅ Risk management: fixed SL % + Trailing Stop with a profit trigger (doesn’t trail until your trigger is reached).
✅ Pine v6 safety: no unsupported args, no indexof/clamp/when, reverse-index deletes, guards against zero/NaN.
How a trade is decided (logic overview)
Detect FVGs (same rules as the original visual logic).
For each FVG currently intersected by the bar, compute:
Mitigation % (how deep price has entered the box).
Bull%/Bear% split (internal volume share).
Total volume (printed on the box) from LTF aggregation or fallback.
Age (bars) since the box was created.
Apply your filters:
Mitigation ≥ Long/Short threshold.
Volume between your min and max (if enabled).
Age ≥ min bars (if enabled).
Bull% / Bear% within your limits (if enabled).
(Optional) the current candle must be in trade direction (confirm).
If multiple FVGs qualify on the same bar, the strategy uses the most recent one.
Enter long/short (no pyramiding).
Exit with:
Fixed Stop Loss %, and
Trailing Stop that only starts after price reaches your profit trigger %.
Input settings (quick guide)
Mitigation source: close or high/low. Use high/low for intrabar touches; close is stricter.
Mitigation % thresholds: minimal mitigation for Long and Short.
TOTAL Volume filter: skip FVGs with too little/too much total volume (per box).
Bull/Bear share filter: require, e.g., Long only if Bull% ≥ 50; avoid Short when Bull% is high (Short Bull% max).
Age filter (bars): e.g., ≥ 20–30 bars to avoid fresh boxes.
Confirm candle: require candle direction to match the trade.
Cooldown (bars): minimum bars between entries.
Risk:
Stop Loss % (fixed from entry price).
Activate trailing at +% profit (the trigger).
Trailing distance % (the trailing gap once active).
Lower-TF aggregation:
Auto: TF/Divisor → picks 1/3/5m automatically.
Fixed: choose 1/3/5/15m explicitly.
If LTF can’t be fetched, fallback allocates prior bar’s volume by its close position in the bar’s H–L.
Suggested starting presets (you should optimize per market)
Mitigation: 60–80% for both Long/Short.
Bull/Bear share:
Long: Bull% ≥ 50–70, Bear% ≤ 100.
Short: Bull% ≤ 60 (avoid shorting into strong support), Bear% ≥ 0–70 as you prefer.
Age: ≥ 20–30 bars.
Volume: pick a min that filters noise for your symbol/timeframe.
Risk: SL 4–6%, trailing trigger 1–2%, distance 1–2% (crypto example).
Set slippage/fees in Strategy Properties.
Notes, limitations & best practices
Data differences: The LTF split uses request.security_lower_tf. If the exchange/data feed has sparse LTF data, the fallback kicks in (it’s deliberate to avoid NaNs but is a heuristic).
Real-time vs backtest: The current bar can update until close; results on historical bars use closed data. Use “Bar Replay” to understand intrabar effects.
No pyramiding: Only one position at a time. Modify pyramiding in the header if you need scaling.
Assets: For spot/crypto, TradingView “volume” is exchange volume; in some markets it may be tick volume—interpret filters accordingly.
Risk disclosure: Past performance ≠ future results. Use appropriate position sizing and risk controls; this is not financial advice.
Credits
Visual FVG concept and original implementation: BigBeluga.
This derivative strategy adds entry/exit logic, volume/age/share filters, robust LTF handling, and risk management while preserving the original spirit.
License remains CC BY-NC-SA 4.0 (non-commercial, attribution required, share-alike).

BTC Momentum Strategy - RSI & Stoch RSI Entry and EMA ExitBTC Momentum Strategy: RSI & Stoch RSI Entry with EMA Exit
This strategy is designed to identify potentially strong entry points for Bitcoin (BTC) during periods of shifting momentum and then ride the trend until it shows signs of weakness. It's a straightforward, long-only strategy, meaning it only looks for opportunities to buy and then sell for a profit.
How It Works:
The strategy combines a few classic indicators to make its decisions. Think of it as a two-step confirmation system for buying, with a simple rule for selling.
1. The Buy Signal (Green Triangle)
To generate a buy signal, the strategy looks for two things to happen at the same time:
RSI Confirmation: It first waits for the Relative Strength Index (RSI) to show signs of bullish momentum. Specifically, it's looking for the RSI line to cross above its own moving average, suggesting that strength is starting to build from a lower level. This helps catch moves as they begin to turn positive.
Stochastic RSI Confirmation: As an extra layer of confirmation, it also checks the Stochastic RSI. This helps filter out weaker signals and confirm that momentum is truly shifting upwards from an oversold or "bottomed-out" condition.
When both of these conditions are met, a green "buy" triangle will appear below the candle, and the strategy will enter a long position.
2. The Sell Signal (Red Triangle)
The exit rule is simple and designed to let your winners run while protecting you when the trend reverses.
* EMA-Based Exit: The strategy plots an orange line on your chart, which is an Exponential Moving Average (EMA). The strategy will hold the position as long as the price stays above this line. If a candle closes *below* the orange EMA line, it's taken as a sign that the short-term trend is weakening, and the strategy will close the position to lock in profits or cut losses. A red "sell" triangle will appear above that candle.
Best Use:
This strategy was built with Bitcoin in mind and tends to perform best on higher timeframes like the Weekly charts. It aims to capture major swings rather than small, quick scalps.
You can adjust all the settings for the RSI, Stochastic RSI, and the Exit EMA to fine-tune the strategy to your own trading style.
