Vortag High/LowThe script displays the previous day's high/low during trading hours from 9:30 to 16:00 EST. This gives us a clean chart.
Pesquisar nos scripts por "the script"

Scenario Screener — Consolidation → Bullish SetupThe script combines multiple indicators to filter out false signals and only highlight strong conditions:
Consolidation Check
Uses ATR % of price → filters out stocks in tight ranges.
Uses Choppiness Index → confirms sideways/non-trending behavior.
Momentum Shift (Bullish Bias)
MACD Histogram > 0 → bullish momentum starting.
RSI between 55–70 → strength without being overbought.
Stochastic %K & %D > 70 → confirms strong momentum.
Volume & Accumulation
Chaikin Money Flow (CMF > 0) → buying pressure.
Chaikin Oscillator > 0 (debug only) → accumulation phase.
Trend Direction
+DI > -DI (from DMI) → buyers stronger than sellers.
ADX between 18–40 → healthy trend strength (not too weak, not overheated).
Breakout Filter (Optional)
If enabled, requires price to cross above 20 SMA before signal confirmation.
📈 Outputs
✅ Green label (“MATCH”) below the bar when all bullish conditions align.
✅ Background highlight (light green) when signal appears.
✅ Info Table (top-right) summarizing key values:
Signal = True/False
MACD, CMF, Chaikin values

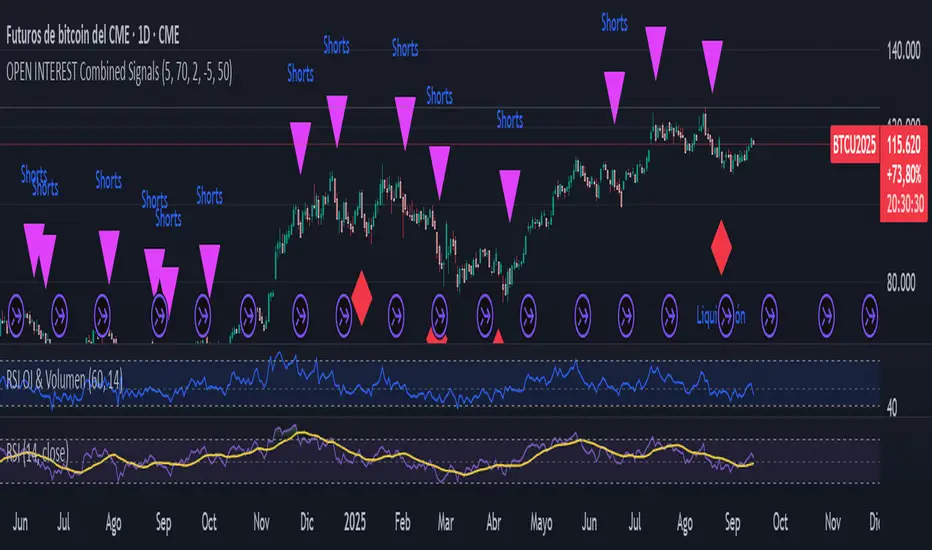
Liquidation Detector, Short and Long with Open InterestThe script analyzes three main pieces of data from each candle (or time bar): price, Open Interest (OI), and volume. It then uses that data to look for two distinct types of patterns and marks them on the chart for easy viewing.
CAN ONLY BE USED WITH STICKER BTC1! CME
Liquidation Detection:
What are you looking for? A sharp drop in Open Interest accompanied by a spike in volume.
What does it mean? This pattern indicates that a large number of positions (usually long) are being closed quickly, which can cause a sharp price drop. It's a signal of market capitulation that many traders use as a potential entry point.
Shorts Entry Detection:
What are you looking for? A price drop accompanied by an increase in Open Interest and a spike in volume.
What does it mean? This pattern shows that "new money" is entering the market to open short positions. It confirms a downtrend and suggests that the price drop has real strength behind it.
Marker: A purple triangle labeled "Shorts."
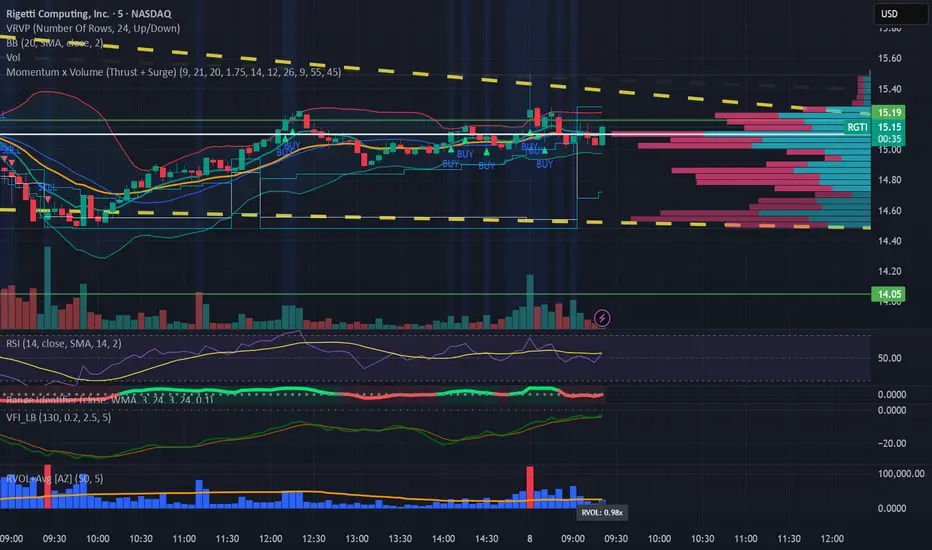
Relative Volume (RVOL) + Average Volume [AZ]The script helps you instantly see whether today’s volume is unusual compared to the past (relative volume). It’s built for breakout/fakeout filters, like the 15-minute ORB strategy you’re running.
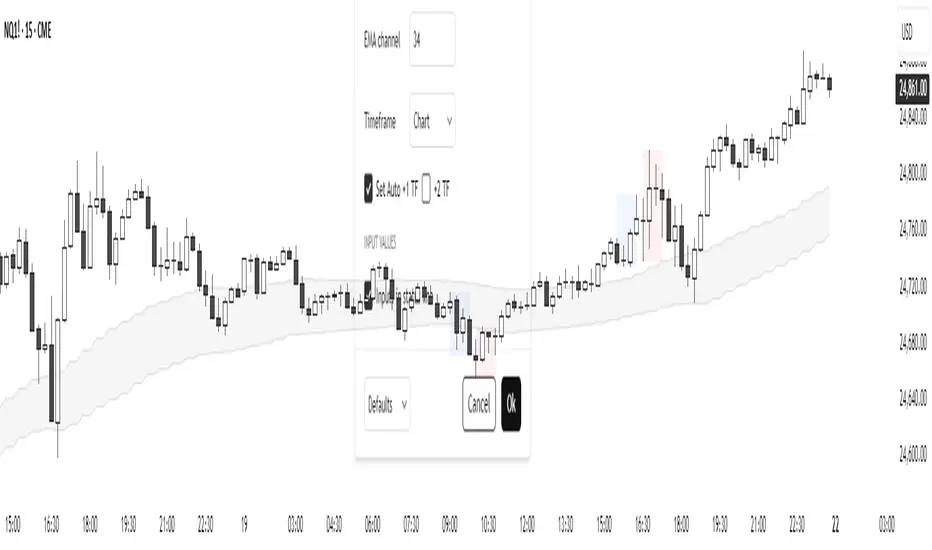
EMA channelThe script builds EMA by high and low. There is a construction by Heikin-Ashi candles, you can also use a multi-timeframe.
Basing Candles"The script identifies Basing Candles and plots a circle (white or any chosen color) at the midpoint of the candle’s body when its body is smaller than or equal to half of the candle’s total range."
"السكربت يحدد شموع Basing Candles ويرسم دائرة بيضاء أو أي لون تختاره في منتصف جسمها عندما يكون جسم الشمعة أصغر أو يساوي نصف طولها."

Projected 65min VolumeThe script provides relative volume for the first 5min candle after its close vs 14 avg and estimates projected volume for the first 65min candle in the trading session vs avg value.
!!!The indicator is designed to work only at 5min TF!!!

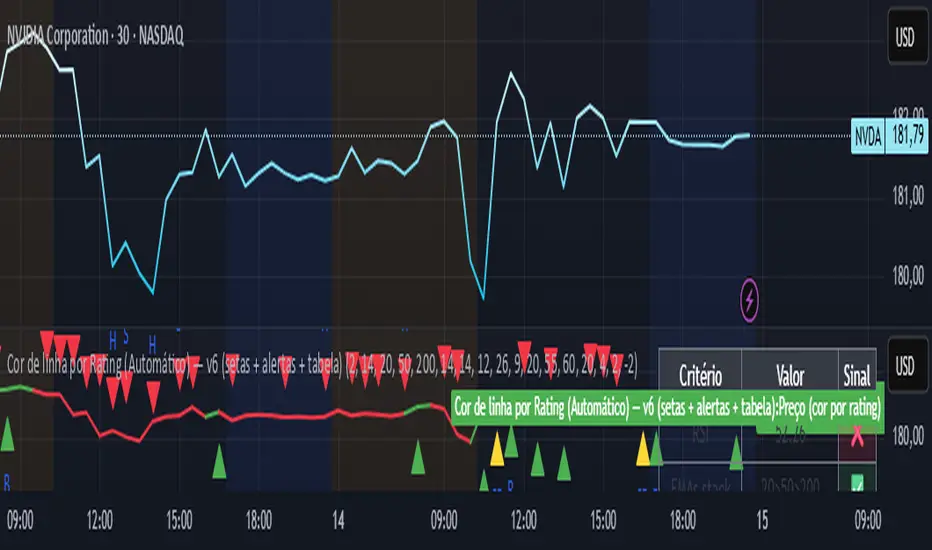
Line color best indices grouped by Artificial Intelligence
The script uses the best buy indicators, such as moving average crossovers, RSI, and others selected by AI. The idea is to determine whether the stock is classified as a strong buy (yellow line), a buy (green line), or a red (sell)
AO/KO Consecutive ConfirmationThe script is a technical indicator for Hong Kong futures, overlaying 09:15 Open (AO) and 09:30 Open (KO) lines with customizable retention (default 10 days) and label placement.
It tracks consecutive bullish or bearish candles within a user-defined time range (e.g., 09:30-11:15) and minimum price difference (default 5 points), using AO or KO as reference.
Markers indicate when a set number of consecutive candles (default 3) is met, with optional number displays.
Alerts trigger on bullish/bearish conditions, aiding trend analysis.

ATR Stop Loss Non-Decreasing & LineThe script calculates a custom stop-loss level based on the Average True Range (ATR) indicator, ensuring that this stop-loss level never decreases from one bar to the next unless a reset condition is met. It also visually displays the ATR value and the calculated stop-loss level as a line on the chart.

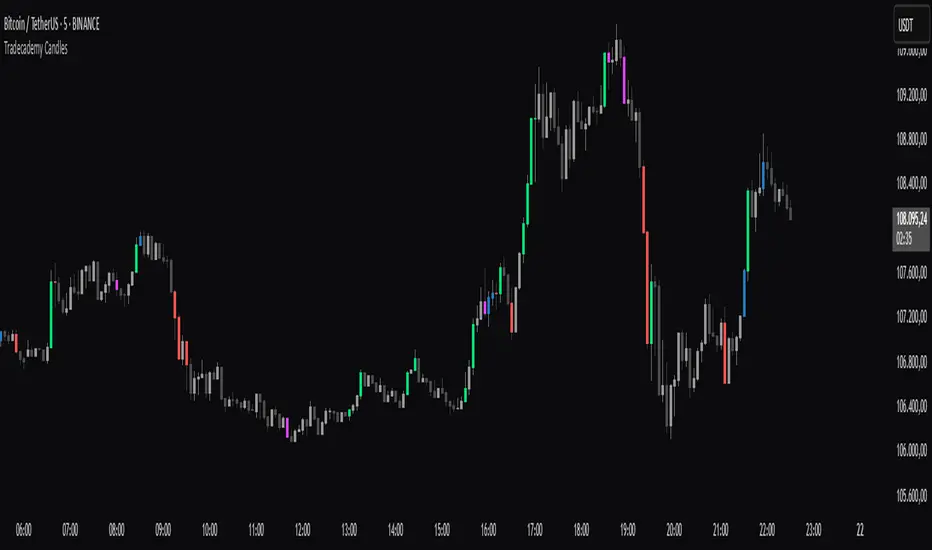
Tradecademy CandlesThe script highlights high-volume candles .
Upward candles with significantly increased volume = green
Upward candles with moderately increased volume = blue
Downward candles with significantly increased volume = red
Downward candles with moderately increased volume = pink
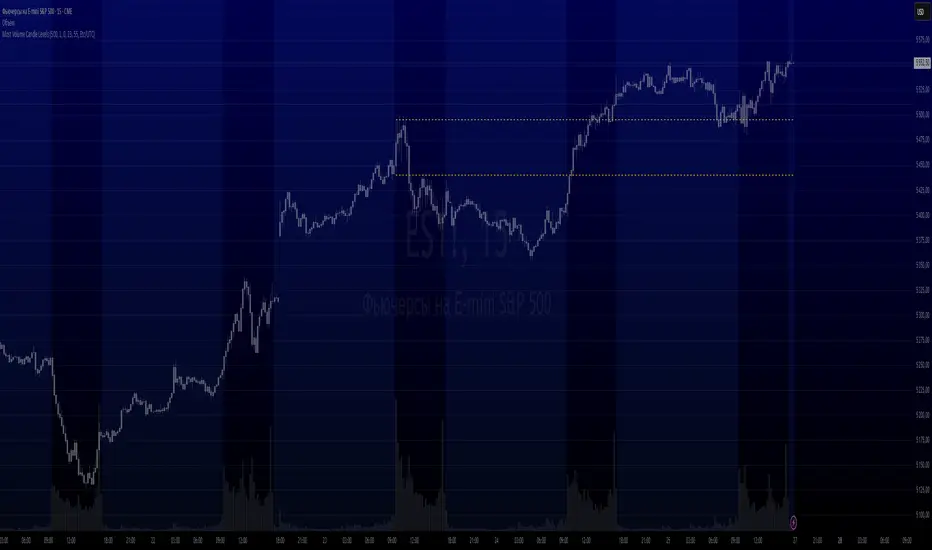
Most Volume Candle LevelsThe script finds the candlestick with the maximum volume in the specified period (20 bars by default).
Draws levels on high and low of this candlestick.
You can set the color of the lines (yellow by default).
MF TimeWaves Predictor: Find future Top and Bottom PivotsThe script allows to predict future pivot tops and bottoms "dates" by studying the chart.
For it, it detects the past pivots and project new ones on the future
It might be useful for swing trading
You might want to enable the "Automatically modify settings" options if you want to use my default settings for different timeframes
Note: It does not offers any prediction for future prices, just dates
Enjoy!

Show-BiasThe script looks at the current bar and prints the bullishness or bearishness bias based on the high, low and close values.
Bullish bias:
----------------
Higher High
Higher Low
Higher Close
Green candle
Bearish bias:
----------------
Lower High
Lower Low
Lower Close
Red candle

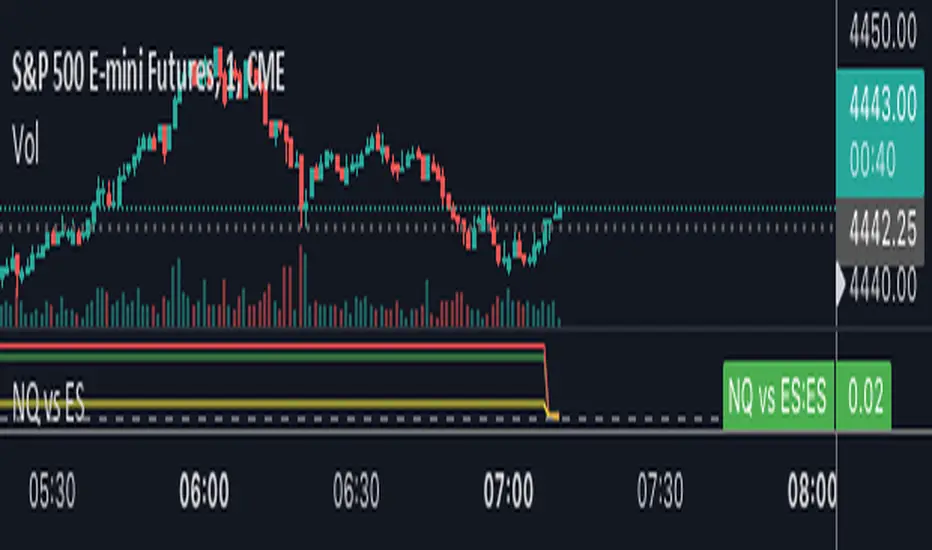
NQ vs ESThe script shows the spread between the realtime NQ and ES percentage change from the day before, from which it is possible to see if NQ is outperforming or underperforming the ES.
[TT] Sectors Dist % From MA- The script shows the distance in percentages from the 200 MA (or any other MA period) , for the 11 SP500 sectors.
- It works based on the current time frames.
Could be useful when working with mean reversion strategies to detect extremes zones and overbought/oversold conditions in the given sectors compared others.

US Fed Rate Hike Historical DatesThe script applies Blue (color can be changed) highlights to the days that the US Federal Reserve Hiked interest rates. Data goes back to the 60's. This can be applied to any chart/timeframe to view how the asset behaved before/during/after Federal Rate Hikes.
****This was updated as of Dec 2022... Any decisions after Dec 2022 will not show up in this indicator.
Versions may be updated periodically to include new data.
Hope this helps. Happy Trades
-SnarkyPuppy

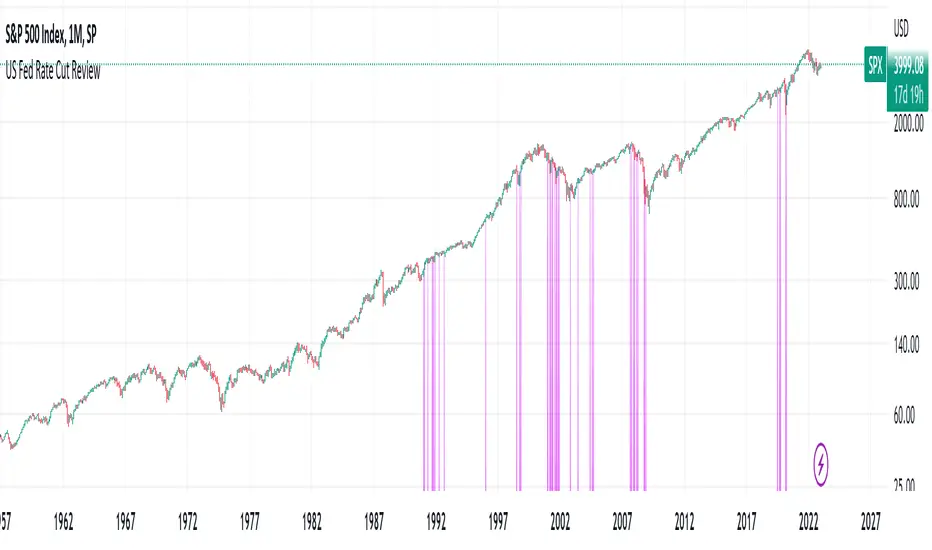
US Fed Rate Cut Historical DatesThe script applies Purple (color can be changed) highlights to the days that the US Federal Reserve Cut interest rates. Data goes back to the 60's. This can be applied to any chart/timeframe to view how the asset behaved before/during/after Federal Rate cuts.
****This was updated as of Dec 2022... Any decisions after Dec 2022 will not show up in this indicator.
Versions may be updated periodically to include new data.
Hope this helps. Happy Trades
-SnarkyPuppy
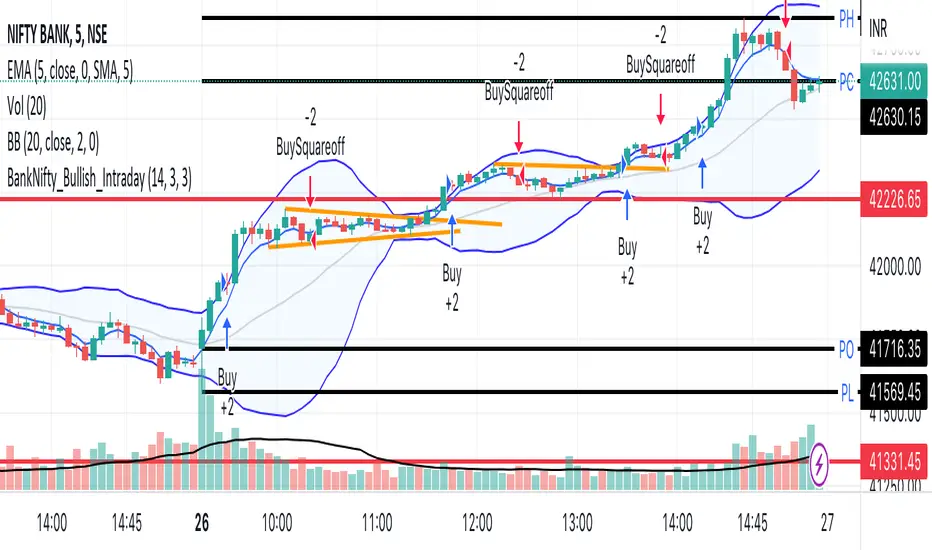
BankNifty_Bullish_Intraday
The script uses following mechanism to give a signal of BUY if multiple parameters evaluated are all passed.
ENTRY-
1. 5 min MACD should be more than its previous tick
2. 15 min MACD should be more than its previous tick
3. 60 min MACD should be more than its previous tick
4. ADX should be more than 12
5. RSI should be more than 60
6. Stochastic %k should have cross over with %d
7. Bollinger band upper band value should be more than previous tick
EXIT
If the 5 min bar price closes below 5 min EMA , it gives an exit signal.
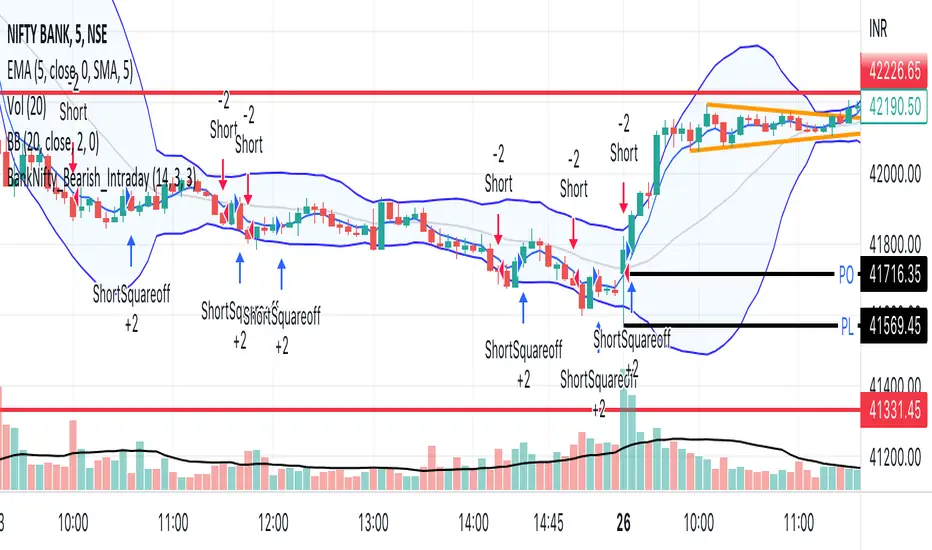
BankNifty_Bearish_Intraday
The script uses following mechanism to give a signal of SELL if multiple parameters evaluated are all passed.
ENTRY-
1. 5 min MACD should be less than its previous tick
2. 15 min MACD should be less than its previous tick
3. 60 min MACD should be less than its previous tick
4. ADX should be more than 12
5. RSI should be less than 40
6. Stochastic %k should have negative cross over with %d
7. Bollinger band lower band value should be less than previous tick
EXIT
If the 5 min bar price closes above 5 min EMA , it gives an exit signal.
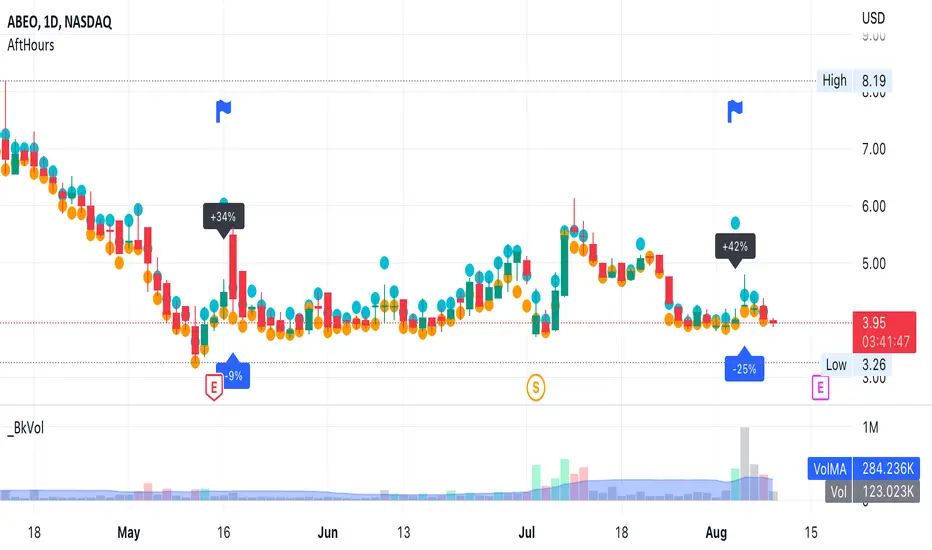
AfterHours Spike DetectorThe script pulls Lower Timeframe (30min) data to draw High/Low of Out-of-hours/AfterHours session (post-market session & next day pre-market session) on the Daily regular session chart. It then identifies significant AfterHours price changes and what happens to these price Spikes by the Open of the next day regular session.
You can change:
wether to show AfterHours High/Lows
wether to show AfterHours price Spikes
the AfterHours price Spike threshold (default = +/- 10%)
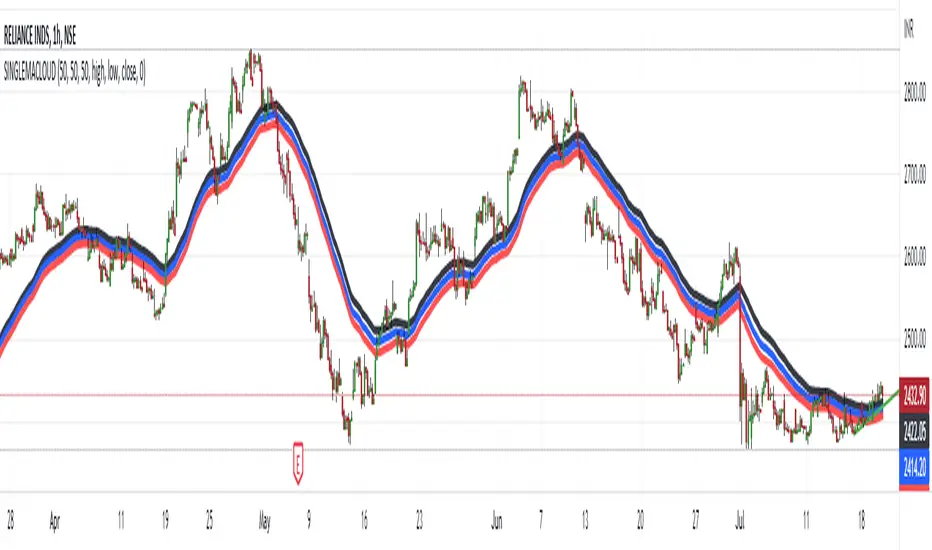
HIGH LOW CLOSE Moving Average ExponentialThe Script is prepared for testing purpose the Added single indicator for getting high low and close.
RSI - S&P Sector ETFsThe script displays RSI of each S&P SPDR Sector ETF
XLB - Materials
XLC - Communications
XLE - Energy
XLF - Financials
XLI - Industrials
XLK - Technology
XLP - Consumer Staples
XLRE - Real Estate
XLU - Utilities
XLV - Healthcare
XLY - Consumer Discretionary
It is meant to identify changes in sector rotation, compare oversold/overbought signals of each sector, and/or any price momentum trading strategy applicable to a trader.
