E-Z Hai Cloud v0.01Very Early version of a new script I am working on. Currently setup for one hour but I want it to work well on multiple time frames.
Options for ADX aren't working atm.
Wanting to add take profits and stop losses in the future, as well as the ability for the script to check multiple time frames so it knows to hodl or dump.
Please let me know if you run into any issues.
Pesquisar nos scripts por "the script"
Bitmex Bot 5m candlesThis script was made for our customers to test the strategies of our Bitmex Bot.
I'm not going to give you permission to use the Script, only if you become our client.
Telegram @rmgslash
BitMex Trailing Stop StrategyThis script is designed for those who want to use BitMex's trailing stop. It's not meant to be used as entry exits, but rather to get an idea of how wide the trailing stop needs to be. I suggest you backtest with different values. The script can also be integrated into an existing strategy which does give entry/exits to act as its stop loss.

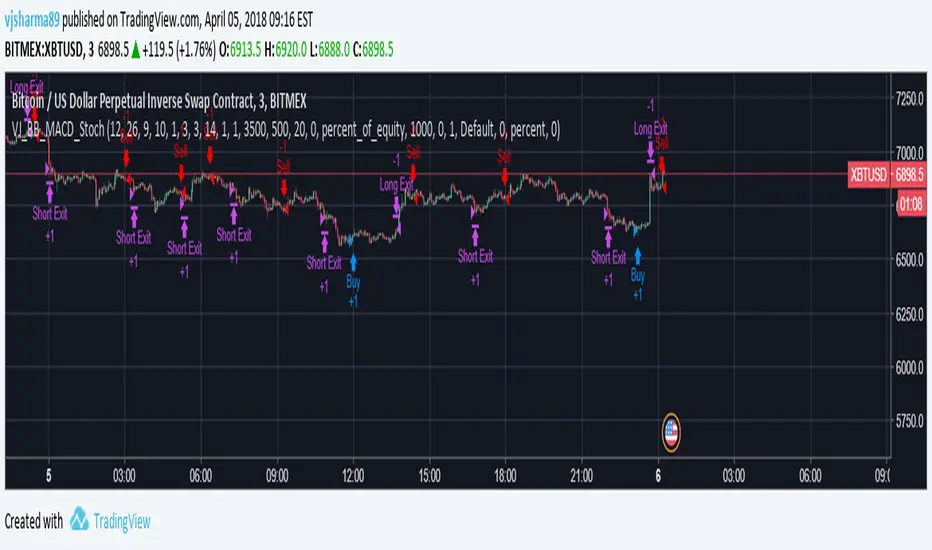
VJSHARMA_BB_MACD_Stoch_Short_Trade_Strategy_V2This script has the same working behind it except for some minor tweaks.
These tweaks enable the script to generate more signals than the previous version but with a loss of 4% accuracy.
Updated TurtlesThis script has been updated to prevent double orders (short/long) from occurring and modifying backtests results.
This is an update to the script that was written a few years ago to prevent double longs/shorts from occurring and skewin backtesting results. Check out the updated indicator here and let me know what you think.
I also added:
- date range inputs if you want to do some backtesting on a particular set of dates.
- the ability to toggle shorting

LFH/ Long positions using MACD histogram, long EMA and short EMADisclaimer: I'm a noob.
Hey there!
I'm trying to implement a script which enter market long position when long EMA crossover short EMA and MACD histogram is positive and histogram at T time is lesser than histogram at T-1.
And when short EMA crossover long EMA, plus MACD histogram is negative and histogram at T is greater than histogram at T-1, I want the script to exit market long position.
Now, I have something pretty close to what I am looking for. What I am missing and can't figure out yet is:
How to moderate entries, ie. I would like it to enter positions when trends are really interesting not just every time the conditions are fulfilled (same for exits) as there is way too much positions
I need to find a way to exit appropriated positions.

Another Millionaire toolBack with another Millionaire tool script, put like a solid 12 minutes here curve fitting the moving averages. THIS WILL MAKE YOU A MILLIONAIRE. It is so easy, it makes one of the hardest industries very very easy. Works on any market. I'VE DECIDED TO SHARE THE SCRIPT AND MAKE IT PUBLIC SO WE CAN ALL BE RICH TOGETHER, MILLIONAIRES

MFVB - Macro-Filtered Volatility Breakout策略核心與原創性: 山寨幣 (Altcoins) 的走勢與比特幣高度相關,單純的技術突破往往會因為大盤下跌而變成假動作。 MFVB (宏觀濾網波動突破策略) 並非一般的技術指標,而是一套由**「跨資產同步演算引擎」**驅動的趨勢系統。本策略內建了硬編碼的邏輯,會自動抓取並分析比特幣 (BINANCE:BTCUSDT) 的即時趨勢數據。透過這種獨特的跨市場分析,系統能確保僅在宏觀環境有利時才執行小幣的突破交易。
主要功能與邏輯:
宏觀守門機制 (Macro Gating): 程式會在背景處理外部的 BTC 趨勢數據 (EMA 200)。這是一個強制性的市場狀態濾網:如果比特幣處於空頭趨勢,即使小幣出現技術面突破,系統也會強制過濾訊號,避免逆勢操作。
波動率突破: 使用經過參數調教的肯特納通道 (Keltner Channels) 來偵測動能爆發。只有在價格突破上軌且通過宏觀濾網檢測時,才會觸發進場。
動態風控: 內建 ATR 動態追蹤止損演算法(圖表上的紅線),會隨著價格波動自動調整以鎖定獲利;若價格跌回通道中線則視為趨勢破壞,立即離場。
用法:
適用標的: 各類具備趨勢性的山寨幣 (如 SOL, ETH, MNT, DOGE 等)。
圖表說明: 藍線為通道範圍,紅線為追蹤止損點。
Concept & Originality: Trading Altcoins is risky because the crypto market is highly correlated with Bitcoin. Standard technical breakouts often fail ("fakeouts") when the broader market is bearish. MFVB is not a standard indicator but a specialized trend system driven by a proprietary Cross-Asset Synchronization Engine. It automatically fetches and analyzes Bitcoin's real-time trend data (BINANCE:BTCUSDT) to filter signals on Altcoins. This hard-coded inter-market logic ensures that trades are only taken when the macro environment is favorable.
Key Features & Logic:
Macro Gating Mechanism (The Gatekeeper): The script processes external BTC trend data (EMA 200) in the background. It applies a Market Regime Filter that forbids long positions on Altcoins if Bitcoin is in a downtrend. This logic is hard-coded to prevent trading against the tide.
Volatility Breakout: Utilizes tuned Keltner Channels to identify genuine volatility expansions. A signal is triggered only when the price breaches the Upper Band AND the Macro Filter is confirmed bullish.
Dynamic Risk Management: Features a built-in ATR-based trailing stop (visualized as the Red Line) which automatically adjusts to volatility to lock in profits, alongside a trend-invalidation exit at the channel median.
Usage:
Target Assets: Any trending Altcoins (e.g., SOL, ETH, MNT, DOGE, etc.).
Visuals:
Blue Lines: Volatility Channel.
Red Line: Dynamic Trailing Stop.

EMA and Dow Theory Strategies V2📘 Overview
This strategy is an advanced evolution of the original EMA × Dow Theory hybrid model. V2 introduces true swing‑based trend detection, gradient trend‑zones, higher‑timeframe swing overlays, and dynamic exit logic designed for intraday to short‑term trading across crypto, forex, stocks, and indices.
The system provides precise entries, adaptive exits, and highly visual guidance that helps traders understand trend structure at a glance.
🧠 Key Features
🔹 1. Dual‑EMA Trend Logic (Symbol + External Index)
Both the chart symbol and an external index (OTHERS.D) are evaluated using fast/slow EMAs to determine correlation‑based trend bias.
🔹 2. Dow Theory Swing Detection (Real‑time)
The script identifies swing highs/lows and updates trend direction when price breaks them. This creates a structural trend model that reacts faster than EMAs alone.
🔹 3. Gradient Trend Zones (Visual Trend Strength)
When trend is up or down, the area between price and the latest swing level is filled with a multi‑step gradient. This makes trend strength and distance-to-structure visually intuitive.
🔹 4. Higher‑Timeframe Swing Trend (htfTrend)
Swing highs/lows from a higher timeframe (e.g., 4H) are plotted to show macro structure. Used only for visual context, not for filtering entries.
🔹 5. RSI‑Based Entry Protection
RSI prevents entries during extreme overbought/oversold conditions.
🔹 6. Dynamic Exit System
Includes:
Custom stop‑loss (%)
Partial take‑profit (TP1/TP2/TP3)
Automatic scale‑out when trend color weakens
“Color‑change lockout” to prevent immediate re‑entry
Real‑time PnL tracking and labels
🔹 7. Alerts for All Key Events
Entry, stop‑loss, partial exits, and trend‑change exits all generate structured JSON alerts.
🔹 8. Visual PnL Labels & Equity Tracking
PnL for the latest trade is displayed directly on the chart, including scale‑out adjustments.
⚙️ Input Parameters
Parameter Description
Fast EMA / Slow EMA EMAs used for symbol trend detection
Index Fast / Slow EMA EMAs applied to external index
StopLoss (%) Custom stop‑loss threshold
Scale‑Out % Portion to exit when trend color weakens
RSI Period / Levels Overbought/oversold filters
Swing Detection Length Bars used to detect swing highs/lows
Stats Display Position of statistics table
🧭 About htfTrend (Higher Timeframe Trend)
The higher‑timeframe swing trend is displayed visually but not used for entry logic.
Why? Strict HTF filtering reduces trade frequency and often removes profitable setups. By keeping it visual‑only, traders retain flexibility while still benefiting from macro structure awareness.
Use it as a contextual guide, not a constraint.
📘 概要
本ストラテジーは、V1 を大幅に拡張した EMA × ダウ理論 × スイング構造 × 上位足トレンド可視化 の複合型モデルです。 短期〜デイトレード向けに最適化されており、仮想通貨・FX・株式・指数など幅広いアセットで利用できます。
V2 では、スイング構造の自動検出、グラデーションによるトレンド強度の可視化、上位足スイングライン、動的な利確/損切りロジック が追加され、視覚的にもロジック的にも大幅に強化されています。
🧠 主な機能
🔹 1. 銘柄+外部インデックスの EMA クロス判定
対象銘柄と OTHERS.D の EMA を比較し、相関を考慮したトレンド方向を判定します。
🔹 2. ダウ理論に基づくスイング高値・安値の自動検出
スイング更新によりトレンド方向を切り替える、構造ベースのトレンド判定を採用。
🔹 3. グラデーション背景によるトレンド強度の可視化
スイングラインから現在価格までを段階的に塗り分け、 「どれだけトレンドが伸びているか」を直感的に把握できます。
🔹 4. 上位足スイングトレンド(htfTrend)の表示
4H などの上位足でのスイング高値・安値を表示し、 大局的なトレンド構造を視覚的に把握できます(ロジックには未使用)。
🔹 5. RSI による過熱・売られすぎフィルター
極端な RSI 状態でのエントリーを防止。
🔹 6. 動的イグジットシステム
カスタム損切り(%)
TP1/TP2/TP3 の段階的利確
トレンド色の弱まりによる自動スケールアウト
色変化後の再エントリー制限(waitForColorChange)
リアルタイム PnL の追跡とラベル表示
🔹 7. アラート完備(JSON 形式)
エントリー、損切り、部分利確、トレンド反転などすべてに対応。
🔹 8. 損益ラベル・統計表示
直近トレードの損益をチャート上に表示し、視覚的に把握できます。
⚙️ 設定項目
設定項目名 説明
Fast / Slow EMA 銘柄の EMA 設定
Index Fast / Slow EMA 外部インデックスの EMA 設定
損切り(%) カスタム損切りライン
部分利確割合 トレンド弱化時のスケールアウト割合
RSI 期間・水準 過熱/売られすぎフィルター
スイング検出期間 スイング高値・安値の検出に使用
統計表示位置 テーブルの表示位置
🧭 上位足トレンド(htfTrend)について
上位足スイングの更新に基づくトレンド判定を表示しますが、 エントリー条件には使用していません。
理由: 上位足を厳密にロジックへ組み込むと、トレード機会が大幅に減るためです。
本ストラテジーでは、 「大局の把握は視覚で、エントリーは柔軟に」 という設計思想を採用しています。
→ 裁量で利確判断や逆張り回避に活用できます。

NIFTY_2min_FVG_sell_StrategyThis strategy is designed for scalping Nifty on a 2-minute chart, focusing exclusively on short entries. The script's purpose is to identify and act on specific bearish patterns based on volume analysis and price action.
Concept & Core Logic
The strategy operates on a two-stage confirmation process:
Volume Absorption: The initial condition seeks to identify potential bearish movements by detecting signs of buying pressure being absorbed by sellers. This suggests that a upward move may be losing momentum.
Fair Value Gap (FVG) Confirmation: After a volume absorption signal, the strategy waits for a Bearish Fair Value Gap (FVG) to appear. A short entry signal is generated only after a candle closes below the FVG zone, serving as confirmation of bearish intent.
Risk Management
The strategy employs a fixed take profit and stop loss for each trade, based on the Nifty underlying price:
Take Profit: The exit signal is triggered when a trade reaches a 30-point profit.
Stop Loss: The exit signal is triggered when a trade reaches a 35-point loss.
Intended Use
This tool is intended for traders who:
Utilize mechanical, rule-based systems for intraday trading and scalping.
Are interested in studying a structured approach that combines volume analysis with price action inefficiencies like Fair Value Gaps.

Reversal WaveThis is the type of quantitative system that can get you hated on investment forums, now that the Random Walk Theory is back in fashion. The strategy has simple price action rules, zero over-optimization, and is validated by a historical record of nearly a century on both Gold and the S&P 500 index.
Recommended Markets
SPX (Weekly, Monthly)
SPY (Monthly)
Tesla (Weekly)
XAUUSD (Weekly, Monthly)
NVDA (Weekly, Monthly)
Meta (Weekly, Monthly)
GOOG (Weekly, Monthly)
MSFT (Weekly, Monthly)
AAPL (Weekly, Monthly)
System Rules and Parameters
Total capital: $10,000
We will use 10% of the total capital per trade
Commissions will be 0.1% per trade
Condition 1: Previous Bearish Candle (isPrevBearish) (the closing price was lower than the opening price).
Condition 2: Midpoint of the Body The script calculates the exact midpoint of the body of that previous bearish candle.
• Formula: (Previous Open + Previous Close) / 2.
Condition 3: 50% Recovery (longCondition) The current candle must be bullish (green) and, most importantly, its closing price must be above the midpoint calculated in the previous step.
Once these parameters are met, the system executes a long entry and calculates the exit parameters:
Stop Loss (SL): Placed at the low of the candle that generated the entry signal.
Take Profit (TP): Calculated by projecting the risk distance upward.
• Calculation: Entry Price + (Risk * 1).
Risk:Reward Ratio of 1:1.
About the Profit Factor
In my experience, TradingView calculates profits and losses based on the percentage of movement, which can cause returns to not match expectations. This doesn’t significantly affect trending systems, but it can impact systems with a high win rate and a well-defined risk-reward ratio. It only takes one large entry candle that triggers the SL to translate into a major drop in performance.
For example, you might see a system with a 60% win rate and a 1:1 risk-reward ratio generating losses, even though commissions are under control relative to the number of trades.
My recommendation is to manually calculate the performance of systems with a well-defined risk-reward ratio, assuming you will trade using a fixed amount per trade and limit losses to a fixed percentage.
Remember that, even if candles are larger or smaller in size, we can maintain a fixed loss percentage by using leverage (in cases of low volatility) or reducing the capital at risk (when volatility is high).
Implementing leverage or capital reduction based on volatility is something I haven’t been able to incorporate into the code, but it would undoubtedly improve the system’s performance dramatically, as it would fix a consistent loss percentage per trade, preventing losses from fluctuating with volatility swings.
For example, we can maintain a fixed loss percentage when volatility is low by using the following formula:
Leverage = % of SL you’re willing to risk / % volatility from entry point to exit or SL
And if volatility is high and exceeds the fixed percentage we want to expose per trade (if SL is hit), we could reduce the position size.
For example, imagine we only want to risk 15% per SL on Tesla, where volatility is high and would cause a 23.57% loss. In this case, we subtract 23.57% from 15% (the loss percentage we’re willing to accept per trade), then subtract the result from our usual position size.
23.57% - 15% = 8.57%
Suppose I use $200 per trade.
To calculate 8.57% of $200, simply multiply 200 by 8.57/100. This simple calculation shows that 8.57% equals about $17.14 of the $200. Then subtract that value from $200:
$200 - $17.14 = $182.86
In summary, if we reduced the position size to $182.86 (from the usual $200, where we’re willing to lose 15%), no matter whether Tesla moves up or down 23.57%, we would still only gain or lose 15% of the $200, thus respecting our risk management.
Final Notes
The code is extremely simple, and every step of its development is detailed within it.
If you liked this strategy, which complements very well with others I’ve already published, stay tuned. Best regards.

Adaptive Trend Navigator [ATH Filter & Risk Engine]Description:
This strategy implements a systematic Trend Following approach designed to capture major moves while actively protecting capital during severe bear markets. It combines a classic Moving Average "Fan" logic with two advanced risk management layers: a 4-Stage Dynamic Stop Loss and a macro-economic "Circuit Breaker" filter.
Core Concepts:
1. Trend Identification (Entry Logic) The script uses a cascade of Simple Moving Averages (SMA 25, 50, 100, 200) to identify the maturity of a trend.
Entries are triggered by specific crossovers (e.g., SMA 25 crossing SMA 50) or by breaking above the previous trade's high ("High-Water Mark" Re-Entry).
2. The "Circuit Breaker" (Crash Protection) To prevent trading during historical market collapses (like 2000 or 2008), the strategy monitors the Nasdaq 100 (QQQ) as a global benchmark:
Normal Regime: If the market is within 20% of its All-Time High, the strategy operates normally.
Crisis Regime: If the QQQ falls more than 20% from its ATH, the "Circuit Breaker" activates (Visualized by a Red Background).
Recovery Rule: In a Crisis Regime, new long positions are blocked unless the QQQ reclaims its SMA 200. This filters out "bull traps" in secular bear markets.
3. 4-Stage Risk Engine (Exit Logic) Once in a trade, the risk management adapts to the position's performance:
Stage 1: Fixed initial Stop Loss (default 10%) for breathing room.
Stage 2: Moves to Break-Even area once the price rises 12%.
Stage 3: Tightens to a trailing stop (8%) after 25% profit.
Stage 4: Maximizes gains with a tight trailing stop (5%) during parabolic moves (>40% profit).
Visual Guide:
SMAs: 25/50/100/200 period lines for trend visualization.
Red Background: Indicates the "Crisis Regime" where trading is halted due to broad market weakness.
Blue Background: Indicates a "Recovery Phase" (Crisis is active, but market is above SMA 200).
Red Line: Shows the dynamic Stop Loss level for active positions.
Settings: All parameters (SMA lengths, Drawdown threshold, Risk Stages) are fully customizable. The QQQ benchmark ticker can also be changed to SPY or other indices depending on the asset class traded.

Classic Wave: The Easy WayClassic Wave is a simple strategy with few rules and no over-optimization. Despite its simplicity, it is backed by a nearly century-long historical track record, delivering excellent returns on the weekly chart of the SPX (TVC).
I also recommend observing its strong performance on the SPY (weekly), which is the perfect instrument for executing this strategy with futures in the future.
Strategy Rules and Parameters
When a bullish candle closes above the 20-period EMA, we place the stop-loss below the low of that candle and target a risk-reward ratio of 1:1.
A second, more profitable variant is to change the risk-reward ratio in the code to 2:1.
-Total capital: $10,000
-We use 10% of the total capital per trade.
-Commissions: 0.1% per trade.
The code construction is simple and very well detailed within the script itself.
Risk-Reward Ratio 2:1
Using a 2:1 risk-reward ratio reduces the win rate but significantly increases profitability.
Across the full historical data of the SPX index (weekly), the system would have generated 236 trades, with a win rate of 51.27% and a profit factor of 2.53.
From January 1, 2023, to November 28, 2025, the system would have generated 5 trades, with an 80% win rate and a profit factor of 9.244.
What makes this system so good?
-It takes advantage of the long-term bullish bias of U.S. stock indices and traditional markets.
-It filters out a lot of noise thanks to the weekly timeframe.
-It uses simple parameters with no over-optimization.
Final Notes:
This strategy has consistently outperformed the returns offered by most traditional funds over time, with fewer drawdowns and significantly less stress. I hope you like it.

Long-Term Strategy: 1-Year Breakout + 6-Month ExitDescripción (Description): (Copia y pega todo lo que está dentro del recuadro de abajo)
Description
This is a long-term trend-following strategy designed to capture major market moves while filtering out short-term noise. It is based on the classic principle of "buying strength" (Breakouts) and allowing profits to run, while cutting losses when the medium-term trend reverses.
How it Works (Logic)
1. Entry Condition (Long Only): The strategy looks for a significant display of strength. It enters a Long position only when two conditions are met simultaneously:
Price Breakout: The closing price exceeds the highest high of the last 252 trading days (approximately 1 year). This ensures we are entering during a strong momentum phase.
Trend Filter: The SuperTrend indicator (Settings: ATR 10, Factor 3.0) must be bullish. This acts as a confirmation filter to avoid false breakouts in choppy markets.
2. Exit Condition: The strategy uses a trailing stop based on price action, not a fixed percentage.
It closes the position when the price closes below the lowest low of the last 126 trading days (approximately 6 months).
This wide exit allows the trade to "breathe" during normal market corrections without exiting the position prematurely.
Settings & Risk Management
Capital Usage: The script is configured to use 10% of equity per trade to reflect realistic risk management (compounding).
Commissions: Included at 0.1% to simulate real trading costs.
Slippage: Included (3 ticks) to account for market execution variability.
Best Use: This strategy is intended for higher timeframes (Daily or Weekly) on trending assets like Indices, Crypto, or Commodities.

Alpha VWAP Regime🔥 Alpha VWAP Regime — Institutional VWAP Strategy (Closed Source)
Alpha VWAP Regime is a multi-layered VWAP trading system that identifies the active market regime and adapts its signals based on institutional liquidity behavior.
This strategy is closed-source because it uses a proprietary combination of VWAP structures, anchored pivot logic, band deviations, and regime detection filters that are not publicly available.
🧠 How the Strategy Works (Conceptual Explanation)
This strategy does not rely on a single VWAP line.
Instead, it builds a VWAP matrix consisting of:
1) Session VWAP
Defines fair value for the current session.
Used to detect intraday directional bias.
2) Anchored VWAP (AVWAP)
Automatically anchored to swing highs and lows (pivot-based).
Tracks where large players accumulated or distributed positions.
3) VWAP Bands (±1σ and ±2σ)
Used as dynamic volatility envelopes:
±1σ = fair-value zone / no-trade area
±2σ = mean-reversion extremes
4) Market Regime Classification (ADX-based)
The strategy determines which environment the market is in:
Trending Regime: ADX above threshold
Ranging Regime: ADX below threshold
Breakout Regime: Volume-based breakout of AVWAP
Each regime activates a different entry model.
📌 Entry Logic (High-Level Overview)
Trend Mode
Triggered only when ADX confirms a trend.
Entries occur near VWAP or −1σ using price-action confirmation.
Mean Reversion Mode
Activated when the market is ranging.
Entries target the ±2σ deviation bands.
Breakout Mode
Triggered by price crossing AVWAP with above-average volume.
Used to catch institutional continuation moves.
ALL Mode
Combines the three models for a full adaptive system.
📉 Exits & Risk Management
All stops and targets use ATR-based volatility sizing
Trend trades aim for larger targets
Mean-reversion trades aim for smaller snapback moves
Breakouts use wider stops but high R:R
🔍 How to Use the Strategy
Load the script on a clean chart
Choose your preferred regime mode (Trend / MR / Breakout / ALL)
Optionally hide VWAP indicators and display signals only
Use realistic position sizing and commissions
Evaluate performance across multiple assets and timeframes
🔒 Why It Is Closed-Source
The code uses:
A custom anchoring engine
Multi-layered regime filters
Dynamic VWAP matrix
Prop logic for bias scoring
These components were built from scratch and form a unique decision model, so the source is protected.
🇸🇦 الشرح العربي لاستراتيجية Alpha VWAP Regime
Alpha VWAP Regime هي استراتيجية تداول مؤسسية متقدمة تعتمد على تحليل السيولة، وتحديد حالة السوق (Market Regime)، ودمج عدة طبقات من VWAP داخل نموذج واحد متكيف.
الهدف من الاستراتيجية هو التداول في المناطق التي يتواجد فيها المال الذكي، وتجنب التداول في المناطق العشوائية أو منخفضة الجودة.
________________________________________
🧠 كيف تعمل الاستراتيجية؟
الاستراتيجية لا تعتمد على VWAP واحد، بل تستخدم “مصفوفة VWAP” كاملة تتكوّن من:
1) VWAP اليومي (Session VWAP)
يُستخدم لتحديد القيمة العادلة خلال الجلسة، وتحديد الاتجاه اللحظي (Intraday Bias).
________________________________________
2) VWAP المثبّت (Anchored VWAP)
يتم تثبيته تلقائيًا على:
• القمم المهمة (Swing Highs)
• القيعان المهمة (Swing Lows)
ويساعد في تحديد مناطق تمركز المؤسسات، ومناطق الانعكاس أو الاختراقات الحقيقية.
________________________________________
3) نطاقات VWAP (±1σ و ±2σ)
تُستخدم كأغلفة ديناميكية للسيولة والتقلب:
• ±1σ = منطقة القيمة العادلة (Fair-Value Zone)
→ غالبًا منطقة غير مناسبة للتداول (No-Trade Zone)
• ±2σ = مناطق التشبّع الحركي (Extremes)
→ مناسبة لاستراتيجيات الانعكاس (Mean Reversion)
________________________________________
4) تصنيف حالة السوق Market Regimes
الاستراتيجية تستخدم مؤشر ADX لتحديد حالة السوق الحالية:
حالة السوق الوصف
Trending اتجاه واضح وقوي
Ranging تذبذب بدون اتجاه
Breakout اختراق مدعوم بحجم تداول
كل Regime يفعّل نموذج دخول مختلف داخل الاستراتيجية.
________________________________________
🎯 نماذج الدخول داخل الاستراتيجية
1) نموذج الاتجاه (Trend Mode)
يعمل فقط عندما يكون السوق في اتجاه حقيقي.
يعتمد على دخول Pullbacks قرب VWAP أو نطاق −1σ مع تأكيد شموعي.
________________________________________
2) نموذج الانعكاس (Mean Reversion Mode)
يعمل فقط عندما يكون السوق متذبذبًا (Range).
الدخول عند لمس ±2σ بهدف العودة نحو VWAP.
________________________________________
3) نموذج الاختراق (Breakout Mode)
يستخدم اختراقات Anchored VWAP
ولكن بشرط وجود حجم تداول أعلى من المتوسط (Volume Confirmation).
________________________________________
4) وضع الدمج (ALL Mode)
يجمع بين النماذج الثلاثة ويجعل الاستراتيجية متكيفة تلقائيًا مع كل حالات السوق.
________________________________________
📉 الخروج وإدارة المخاطر
تستخدم الاستراتيجية نظامًا ديناميكيًا لإدارة المخاطر:
• وقف الخسارة مبني على ATR
• الأهداف مبنية على طبيعة النموذج
• الصفقات الاتجاهية تستهدف R:R أعلى
• صفقات MR أقصر وأسرع
• صفقات Breakout أوسع ولكن مدعومة بزخم قوي
________________________________________
🧩 كيفية استخدام الاستراتيجية
1. ضع الاستراتيجية على رسم بياني نظيف بدون مؤشرات إضافية
2. اختر نموذج الدخول المناسب من الإعدادات
3. فعّل أو أخفِ خطوط VWAP حسب الحاجة
4. استخدم إعدادات مخاطرة واقعية
5. اختبر الاستراتيجية على عدة أسواق وفريمات
________________________________________
🔒 سبب إغلاق الكود
تم إغلاق الكود لأنها تعتمد على:
• محرك تثبيت AVWAP خاص
• نظام Regime Detection متقدم
• مصفوفة VWAP متعددة الطبقات
• منطق دخول/خروج خاص تم تطويره بالكامل
كل ذلك يتطلب حماية الملكية الفكرية، لذا تم نشرها Closed-Source.
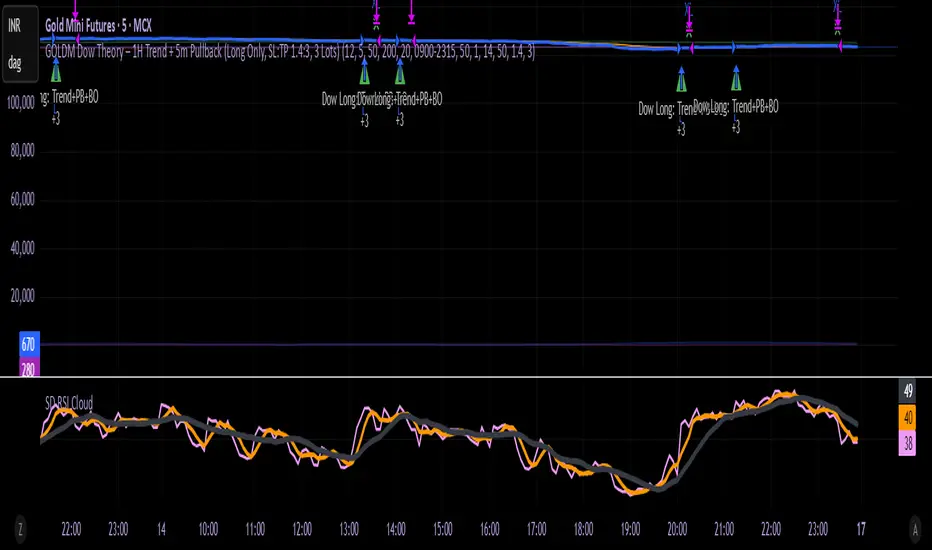
GOLDM Dow Theory – 1H Trend + 5m Pullback1. Strategy Overview
Instrument: MCX GOLDM
Chart timeframe: 5 minutes
Side: Long-only
Position size: Fixed 3 lots
Core idea:
Trade only in 1H uptrend, enter after a 5m pullback and breakout, with basic volume/volatility filters and ATR-based SL/TP.
2. High-Level Logic Flow (Per Bar)
On every 5-minute bar, the script does this:
Update session/time, volume, and ATR filters
Read 1H trend from higher timeframe
Update 5m pullback state (whether a valid dip happened)
Check if there is a valid breakout back in the direction of the 1H trend
If all filters + conditions align → enter Long (3 lots)
While in a trade:
Manage SL/TP using ATR
Close trade if 1H trend flips down or price closes below 5m EMA
Everything else (plots, alerts) is just for visibility and convenience.
3. Inputs & Configuration
Main inputs:
pullbackLookback – how many 5m bars to look back to detect a pullback
breakoutLookback – how many bars to consider for recent swing high
emaLenTrendFast / emaLenTrendSlow – 1H EMAs (50/200) for trend
emaLenPullback – 5m EMA used for pullback logic (default 20)
tradeSession – default "0900-2315" (you can change)
volLookback, volMult – volume filter
atrLen, atrSmaLen – ATR filter
slATRmult (1.4), tpATRmult (3.0) – ATR multiples → ~1.4 : 3 RR
4. Session / Time Filter
tradeSession = "0900-2315"
inSession = not useSessionFilter or not na(time(timeframe.period, tradeSession))
Only allows entries when the current bar’s time is inside 09:00–23:15.
If useSessionFilter is false, this filter is ignored.
No trade opens outside this window, but existing trades can still exit.
5. Volume & Volatility Filters
Volume Filter
avgVol = ta.sma(volume, volLookback)
highVolume = not useVolumeFilter or (volume > avgVol * volMult)
If enabled, current bar’s volume must be greater than average volume × multiplier.
Purpose: avoid thin, illiquid periods.
ATR Filter
atr5 = ta.atr(atrLen)
atrSma = ta.sma(atr5, atrSmaLen)
goodATR = not useATRFilter or (atr5 > atrSma)
If enabled, current ATR must be above its own moving average.
Purpose: avoid flat / extremely low-volatility periods.
Only if both highVolume and goodATR are true, the system considers entering.
6. Higher Timeframe Trend (1H)
emaFast1h = request.security(syminfo.tickerid, "60", ta.ema(close, emaLenTrendFast), ...)
emaSlow1h = request.security(syminfo.tickerid, "60", ta.ema(close, emaLenTrendSlow), ...)
trendUp = emaFast1h > emaSlow1h
trendDown = emaFast1h < emaSlow1h
On the 1-hour timeframe:
If EMA Fast (50) > EMA Slow (200) → trendUp = true
If EMA Fast (50) < EMA Slow (200) → trendDown = true
This is the core trend filter:
We only look for longs when trendUp is true.
7. 5-Minute Structure Logic (Dow-style)
7.1 Pullback Detection
emaPull = ta.ema(close, emaLenPullback)
pulledBackLong = ta.lowest(close, pullbackLookback) < emaPull
A pullback is defined as:
In the last pullbackLookback bars, price closed below the 5m EMA (emaPull) at least once.
This indicates a dip against the 1H uptrend.
A state flag tracks this:
var bool hadLongPullback = false
hadLongPullback := trendUp and pulledBackLong ? true : (not trendUp ? false : hadLongPullback)
When:
trendUp AND pulledBackLong → hadLongPullback = true.
If the trend stops being up (trendUp = false), flag resets to false.
So the system remembers:
“There has been a proper dip while the 1H uptrend is active.”
7.2 Breakout Confirmation
recentHigh = ta.highest(high, pullbackLookback)
breakoutUp = close > recentHigh
After a pullback, we wait for price to close above the highest high of recent bars (excluding the current one).
This mimics:
“Higher high after a higher low” → breakout in Dow Theory terms.
8. Final Long Entry Logic
The base entry condition:
baseLongEntry =
trendUp and
hadLongPullback and
breakoutUp and
close > emaPull
Translated:
1H trend is up (trendUp).
A valid pullback happened recently (hadLongPullback).
Current candle broke above the recent swing high (breakoutUp).
Price is now back above the 5m EMA (pullback is resolving, not deepening).
Then filters are applied:
longEntryCond =
baseLongEntry and
inSession and
highVolume and
goodATR and
not isLong
So a long entry only occurs if:
Core structure conditions (baseLongEntry) are true
Time is within session
Volume is high enough
ATR is healthy
You are not already in a long
When longEntryCond is true:
if longEntryCond
strategy.entry("Long", strategy.long, comment = "Dow Long: Trend+PB+BO")
hadLongPullback := false
Enters 3 lots long (as per default_qty_type + default_qty_value).
Resets hadLongPullback so we don’t re-use the same pullback.
9. Exit Logic
There are two exit layers:
9.1 Logical Exit (Trend or Structure Change)
exitLongTrendFlip = trendDown
exitLongEMA = ta.crossunder(close, emaPull)
longExitCond = isLong and (exitLongTrendFlip or exitLongEMA)
If in a long:
Exit when trend flips down (1H EMA50 < EMA200), OR
Price crosses below 5m EMA (pullback may be turning into reversal).
Then:
if longExitCond
strategy.close("Long", comment = "Exit Long: Trend flip / EMA break")
This closes the position at market (on bar close).
9.2 ATR-based Stop Loss & Take Profit
if useSLTP and isLong
longStop = strategy.position_avg_price - atr5 * slATRmult
longLimit = strategy.position_avg_price + atr5 * tpATRmult
strategy.exit("Long SLTP", "Long", stop = longStop, limit = longLimit)
SL = entry price – 1.4 × ATR(14, 5m)
TP = entry price + 3.0 × ATR(14, 5m)
This gives roughly 1.4 : 3 RR.
If SL or TP is hit, strategy.exit will close the trade.
So exits can come from:
Hitting Stop Loss
Hitting Take Profit
OR logic-based exit (trend flip / EMA break)
10. Alerts
Two alertconditions:
alertcondition(longEntryCond, title="Long Entry Signal",
message="GOLDM LONG: 1H Uptrend + 5m Pullback Breakout + Filters OK")
alertcondition(longExitCond, title="Long Exit Signal",
message="GOLDM LONG EXIT: Trend flip or EMA break")
You can set TradingView alerts based on:
“Long Entry Signal” → tells you when all entry conditions align.
“Long Exit Signal” → tells you when the logic-based exit triggers.
(ATR SL/TP exits won’t auto-alert unless you separately set price alerts or add extra conditions.)
11. Mental Model Summary (How YOU should think about it)
For every trade, the system is basically doing this:
Is GOLDM in an uptrend on 1H?
→ If no: do nothing
Did we get a clear dip below 5m EMA in that uptrend?
→ If no: wait
Did price then break above recent highs and reclaim EMA20?
→ If yes: this is our Dow-style continuation entry
Is market liquid and moving (volume + ATR)?
→ If yes: go Long with 3 lots
Manage with:
ATR SL & TP
Exit early if 1H trend flips or price falls back below EMA20
RSI + MACD Multi-Timeframe StrategyThis strategy combines the Relative Strength Index (RSI) from the daily timeframe with the Moving Average Convergence Divergence (MACD) from the 4-hour timeframe to generate precise long entry and exit signals.
The system uses a multi-timeframe approach to align longer-term trend conditions with shorter-term momentum shifts — allowing traders to catch dips with confirmation and exit before reversals.
🧠 Strategy Logic
✅ Long Entry Condition:
- RSI on the daily (1D) timeframe is oversold (below your defined threshold)
- MACD on the 4H timeframe crosses above the signal line
→ A long trade is opened when these two align
✅ Long Exit Condition:
- RSI on the daily timeframe is overbought
- MACD on the 4H timeframe crosses below the signal line
→ The long trade is closed when these two conditions are met
💡 This strategy currently supports long entries only. Short logic can be added if needed.
📊 Indicator Components
🔹 RSI (Relative Strength Index):
- A momentum oscillator that measures the speed and magnitude of price changes.
- Helps identify overbought (potential sell) and oversold (potential buy) conditions.
- Applied on the 1D timeframe (by default) to reflect broader market trend or exhaustion levels.
🔹 MACD (Moving Average Convergence Divergence):
- A trend-following momentum indicator based on moving averages.
- The MACD Line (fast EMA - slow EMA) crossing above the Signal Line indicates bullish momentum.
- Used here on the 4-hour timeframe (by default) for shorter-term momentum confirmation.
🔹 Multi-Timeframe (MTF) Logic:
- Uses request.security() to pull higher timeframe data (1D for RSI, 4H for MACD).
- Ensures no repainting, as it only uses closed candles from the higher timeframe.
- Aligns longer-term signals with shorter-term entries, reducing false signals.
📈 Plotting Options
The script includes a plot selector input allowing you to toggle between:
- RSI Plot (with overbought/oversold lines)
- MACD Plot (MACD line and signal line)
- This helps visualize signal conditions clearly on your chart.
🛠 Customization
- RSI & MACD settings are fully configurable
- RSI and MACD timeframes can be adjusted independently
⚠️ Disclaimer
This strategy is provided for educational and informational purposes only.
It is not financial advice or a recommendation to buy or sell any asset.
Past performance does not guarantee future results. Always test strategies in a simulated environment before live use, and consult with a licensed financial advisor for investment decisions.

Super Frog Power - Cluster Flip %Super Frog Power - Cluster Flip %
🔄 Trade Smarter, Not Harder: Let the Cluster Decide
Welcome to the "Super Frog Power - Cluster Flip %" strategy, a sophisticated multi-system confluence engine designed to filter out market noise and pinpoint high-probability trade setups. This isn't just another indicator; it's a comprehensive trading system that aggregates signals from eight distinct technical methodologies, waiting for them to align into a powerful "cluster" before you enter a trade.
🎯 Core Philosophy: The Power of Confluence
A single indicator can give false signals. A cluster of indicators from uncorrelated systems agreeing on a direction is a much stronger signal. This strategy continuously monitors multiple independent systems and only executes a trade when a significant number of them flip to a consensus, dramatically increasing the likelihood of a successful move.
✨ The 8 Systems of Super Frog Power
This strategy synthesizes signals from the following powerful components:
Bollinger Bands®: Identifies overbought and oversold conditions relative to recent volatility.
CMI (Cluster Momentum Index) System: A unique multi-period momentum oscillator that identifies convergence and breakout moments with custom "Lion" (SELL) and "Car" (BUY) signals.
SMI (Stochastic Momentum Index) System: A refined momentum indicator that generates "Mouse" (BUY) signals and combines with CMI for "Green Angel" and "Red Devil" super signals.
Lucky Balls (NVI/PVI): Utilizes Negative and Positive Volume Index to gauge smart money flow and identify accumulation/distribution zones.
Momentum System: A triple-threat combo of RSI, CCI, and PPO, scaled and combined to generate robust momentum-based entries and exits.
Lucky Table (Oscillator Overload): Counts the number of key oscillators (SMI, RSI, CCI) in overbought or oversold territory, triggering a signal when a threshold is met.
Apples & Pairs System: A complex system analyzing price swings, accumulation, mass index, and doji patterns with fun, emoji-based signals like "Apple Cross Up" 🍎 and "Pig Cross Down" 🐖.
ZBT (Zonal Breakout Trend) System: A multi-timeframe trend-following system using dynamic EMA channels and an ATR-based trailing stop to identify the primary trend and robust breakout points.
⚙️ How It Works: The Cluster Flip Logic
The magic happens in the signal aggregation. The strategy counts every single BUY and SELL signal from all active systems.
A "Strong Buy" is triggered when 6 or more independent BUY signals occur simultaneously.
A "Strong Sell" is triggered when 5 or more independent SELL signals occur simultaneously.
This "cluster flip" mechanism ensures you are only trading when there is broad-based technical agreement, keeping you out of choppy and uncertain market conditions.
🛡️ Integrated Risk Management
We believe a strategy is nothing without proper risk management. This system comes with built-in, percentage-based order management:
User-Defined Profit Target (%): Lock in profits automatically at your specified percentage gain.
User-Defined Stop Loss (%): Protect your capital with a hard stop loss.
Position Sizing: Control your risk per trade with a customizable position size.
Trades are also managed logically: a new strong signal in the opposite direction will automatically close any existing position, ensuring you're always on the right side of the cluster's consensus.
🎨 Visual Features & Customization
Fully Customizable: Don't like one system? Turn it off! Every system can be toggled on/off from the inputs.
Clear Visuals: Each system is plotted in a distinct color, making the chart a rich source of information without being cluttered.
Signal Markers: Strong Buy and Strong Sell clusters are clearly marked with large circles below and above the bars.
Alert Ready: Built-in alerts for Strong Buy and Strong Sell signals so you never miss a cluster setup.
🚀 How to Use
Add the script to your chart (1H, 4H, or Daily timeframes are recommended for swing trading).
Adjust the inputs to your liking, especially the Profit Target %, Stop Loss %, and Position Size under the "Strategy Parameters" section.
Observe the clusters. Wait for the "Strong Buy" or "Strong Sell" circle to appear.
Enter the trade. The strategy will automatically plot the profit target and stop loss levels on the chart for your reference.
Manage your trade. Let the logic handle the exits, or use your own discretion.
💡 Ideal For
Swing Traders looking for high-confidence set-and-forget setups.
Technical Analysts who appreciate the depth of multi-system confluence.
Traders who want to avoid the paralysis of analyzing too many indicators separately.
Unleash the power of cluster trading. Add the "Super Frog Power - Cluster Flip %" to your chart today!

ORBSMMAATRVOLREENTRY2Contracts📈 Opening Range Fibonacci Breakout (TradingView Strategy)
Overview:
The Opening Range Fibonacci Breakout strategy is designed to capture high-probability intraday moves by combining the power of the 15-minute opening range, trend confirmation via SMMA, and volume-based momentum filtering.
At the start of each trading session, the script automatically plots the Opening Range Box based on the first 15 minutes of price action — highlighting key intraday support and resistance levels.
How It Works:
Opening Range Setup
The first 15 minutes of the session define the range high and low.
A visual box marks this zone on the chart for easy reference.
Signal Generation
A Smoothed Moving Average (SMMA) with a user-defined period determines overall trend bias.
Candle volume is analyzed to confirm momentum strength.
Long Signal: Price breaks above the opening range high, SMMA trending up, and volume supports the move.
Short Signal: Price breaks below the opening range low, SMMA trending down, and volume supports the move.
Take Profit & Targets
Fibonacci extension levels are automatically plotted from the opening range.
These dynamic levels serve as structured Take Profit (TP) zones for partial or full exits.
Features:
✅ 15-Minute Opening Range Box
✅ Adjustable SMMA period
✅ Volume-based confirmation filter
✅ Automatic Fibonacci profit targets
✅ Visual Long/Short alerts & signals
Ideal For:
Scalpers and intraday traders who rely on early-session momentum, breakout confirmation, and precision exit targets.
Backtested for MNQ/NQ futures trading

Gold H1 Breakout Failure (V11.0)This strategy is designed for trading XAU/USD (Gold) on the 1-hour timeframe. It identifies and trades fake breakouts of the Asian session range.
The logic is simple yet effective:
The script first marks the Asian session high and low.
Once price breaks out of this range and closes outside, it waits for confirmation by watching for price to close back inside the range.
When this re-entry occurs, the strategy takes a position in the opposite direction of the initial breakout, anticipating a false breakout or liquidity trap setup.
By focusing on these fakeouts, the strategy aims to capture reversal momentum after liquidity sweeps, making it especially effective during sessions when volatility transitions from Asia to London or New York.

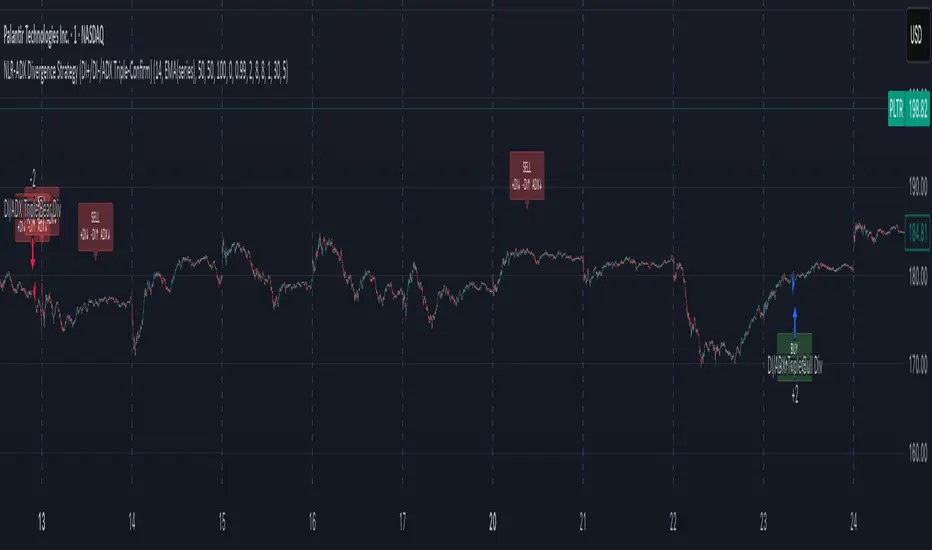
NLR-ADX Divergence Strategy Triple-ConfirmedHow it works
Builds a cleaner DMI/ADX
Recomputes classic +DI, −DI, ADX over a user-set length.
Then “non-linear regresses” each series toward a mean (your choice: dynamic EMA of the series or a fixed Static Mid like 50).
The further a value is from the mean, the stronger the pull (controlled by alphaMin/alphaMax and the γ exponent), giving smoother, more stable DI/ADX lines with less whipsaw.
Optional EMA smoothing on top of that.
Lock in values at confirmed pivots
Uses price pivots (left/right bars) to confirm swing lows and highs.
When a pivot confirms, the script captures (“freezes”) the current +DI, −DI, and ADX values at that bar and stores them. This avoids later drift from smoothing/EMAs.
Check for triple divergence
For a bullish setup (potential long):
Price makes a Lower Low vs. a prior pivot low,
+DI is higher than before (bulls quietly stronger),
−DI is lower (bears weakening),
ADX is lower (trend fatigue).
For a bearish setup (potential short)
Price makes a Higher High,
+DI is lower, −DI is higher,
ADX is lower.
Adds a “no-intersection” sanity check: between the two pivots, the live series shouldn’t snake across the straight line connecting endpoints. This filters messy, low-quality structures.
Trade logic
On a valid triple-confirm, places a strategy.entry (Long for bullish, Short for bearish) and optionally labels the bar (BUY or SELL with +DI/−DI/ADX arrows).
Simple flip behavior: if you’re long and a new short signal prints (or vice versa), it closes the open side and flips.
Key inputs you can tweak
Custom DMI Settings
DMI Length — base length for DI/ADX.
Non-Linear Regression Model
Mean Reference — EMA(series) (dynamic) or Static mid (e.g., 50).
Dynamic Mean Length & Deviation Scale Length — govern the mean and scale used for regression.
Min/Max Regression & Non-Linearity Exponent (γ) — how strongly values are pulled toward the mean (stronger when far away).
Divergence Engine
Pivot Left/Right Bars — how strict the swing confirmation is (larger = more confirmation, more delay).
Min Bars Between Pivots — avoids comparing “near-duplicate” swings.
Max Historical Pivots to Store — memory cap.
ICT Liquidity Sweep Asia/London 1 Trade per High & Low🧠 ICT Liquidity Sweep Asia/London — 1 Trade per High & Low
This strategy is inspired by the ICT (Inner Circle Trader) concepts of liquidity sweeps and market structure, focusing on the Asia and London sessions.
It automatically identifies liquidity grabs (sweeps) above or below key session highs/lows and enters trades with a fixed risk/reward ratio (RR).
----------------------------------------------------------------------------------
----------------------------------------------------------------------------------
⚙️ Core Logic
-Asia Session: 8:00 PM – 11:59 PM (New York time)
-London Session: 2:00 AM – 5:00 AM (New York time)
-The script marks the Asia High/Low and London High/Low ranges for each day.
-When the market sweeps above a session high → potential Short setup
-When the market sweeps below a session low → potential Long setup
-A trade is triggered when the confirmation candle closes in the opposite direction of the sweep (bearish after a high sweep, bullish after a low sweep).
-Only one trade per sweep type (1 per High, 1 per Low) is allowed per session.
----------------------------------------------------------------------------------
----------------------------------------------------------------------------------
📈 Risk Management
-Configurable Risk/Reward Target (default = 2:1)
-Configurable Position Size (number of contracts)
-Each trade uses a fixed Stop Loss (beyond the wick of the sweep) and a Take Profit calculated from the RR setting.
-All trades are automatically logged in the Strategy Tester with performance metrics.
----------------------------------------------------------------------------------
----------------------------------------------------------------------------------
💡 Features
✅ Visual session highlighting (Asia = Aqua, London = Orange)
✅ Automatic liquidity line plotting (session highs/lows)
✅ Entry & exit labels (optional visual display)
✅ Customizable RR and contract size
✅ Works on any instrument (ideal for indices, futures, or forex)
✅ Compatible with all timeframes (optimized for 1M–15M)
----------------------------------------------------------------------------------
----------------------------------------------------------------------------------
⚠️ Notes
-Best used on New York time-based charts.
-Designed for educational and backtesting purposes — not financial advice.
-Use as a foundation for further optimization (e.g., SMT confirmation, FVG filter, or time-based restrictions).
----------------------------------------------------------------------------------
----------------------------------------------------------------------------------
🧩 Recommended Use
Pair this with:
-ICT’s concepts like CISD (Change in State of Delivery) and FVGs (Fair Value Gaps)
-Higher timeframe liquidity maps
-Session bias or daily narrative filters
----------------------------------------------------------------------------------
----------------------------------------------------------------------------------
Author: jygirouard
Strategy Version: 1.3
Type: ICT Liquidity Sweep Automation
Timezone: America/New_York

D Money – EMA/TEMA Touch Strategy (Distance) What it’s trying to capture
You want mean-reversion “tags” back to a moving average after price has stretched away and momentum flips:
Bearish setup (short): price has been above EMA(9) for a few bars, then MACD turns bearish, and price is far enough above the EMA (by an adaptive threshold). Exit when price tags the EMA.
Bullish setup (long): price has been below your chosen TEMA rail (actually an EMA of 50/100/200 you pick) for a few bars, then MACD turns bullish, and price is far enough below that TEMA. Exit when price tags that TEMA.
The moving averages it uses
EMA(9) — your fast “tag” for short take-profits.
“TEMA line” input = one of EMA(50) / EMA(100) / EMA(200). (Labelled “Chosen TEMA” in the plot; it’s an EMA rail you pick.)
When it will enter trades
It requires four things per side:
Short (EMA-Touch Short)
MACD bearish cross on the signal bar
If “Require NO MA touch on cross bar” = true, the bar’s low must be above EMA(9), so it didn’t touch EMA on the cross bar (fake-out guard).
Extension/Context: you’ve had at least barsAbove consecutive closes above EMA(9) (default 3), so it’s truly stretched.
Distance test: absolute % distance from price to EMA(9) must be ≥ minDistEMA_eff (an adaptive threshold; details below).
Bounce filter: there was no bullish bounce off the EMA in the last bounceLookback bars (excluding the current one).
If all pass and you’re inside the backtest window → strategy.entry short.
Long (TEMA-Touch Long)
MACD bullish cross on the signal bar
With the same fake-out guard: the bar’s high must be below the chosen TEMA if the guard is on.
Extension/Context: at least barsAbove consecutive closes below the chosen TEMA.
Distance test: absolute % distance from price to TEMA must be ≥ minDistTEMA_eff (adaptive).
Bounce filter: there was no bearish bounce off the TEMA in the last bounceLookback bars.
If all pass and you’re in the window → strategy.entry long.
MACD timing option:
If Pure MACD Timing = ON, it only checks for the cross.
If OFF (default), it also enforces “no touch on the cross bar” if that checkbox is true. That’s your “fake-out” filter.
The adaptive distance threshold (the “secret sauce”)
You can choose how “far enough away” is determined—per side:
Fixed %
Short uses Fixed: Min distance ABOVE EMA (%)
Long uses Fixed: Min distance BELOW TEMA (%)
Auto (ATR%) (default)
Short threshold = max(floorEMA, kAtrShort × ATR%)
Long threshold = max(floorTEMA, kAtrLong × ATR%)
This scales distance by recent volatility, with a floor.
Auto (AvgDist%)
Short threshold = max(floorEMA, kAvgShort × average(|Dist to EMA|) over avgLen)
Long threshold = max(floorTEMA, kAvgLong × average(|Dist to TEMA|) over avgLen)
This adapts to the instrument’s typical stretch away from the rails.
These become minDistEMA_eff and minDistTEMA_eff and are re-computed each bar.
Fake-out / bounce logic (the “don’t get tricked” part)
A touch means the bar’s high/low overlapped the MA ± a small buffer % (touchBufPct).
A bounce is a touch plus a close on the “wrong” side (e.g., touch EMA and close above it on shorts = bullish bounce).
The script blocks entries if a bounce happened within bounceLookback bars (excluding the current signal bar).
Exits & risk
Take profit: when price touches the target MA:
Short TP = touch EMA(9)
Long TP = touch chosen TEMA
Stop loss: either
ATR stop: entry ± (atrMultStop × ATR) (default ON), or
Percent stop: entry × (1±stopPct%)
Time stop: if timeExitBars > 0, close after that many bars if still open.
Quality-of-life features
Backtest window (btFrom, btTo) so you can limit evaluation.
Labels on signal bars that show:
MACD bucket (Small/Moderate/HUGE/Violent — based on % separation on the bar),
the current absolute distance to the target MA,
and the effective minimum the engine used (plus which engine mode).
Data Window fields so you can audit:
abs distance to EMA/TEMA,
the effective min distance used on each side,
ATR%,
average absolute distances (for the AvgDist mode).
Alerts fire when a short/long signal is confirmed.
Optional debug panel to see the exact booleans & thresholds the bar had.
Quick mental model
Are we properly stretched away from the rail (by an adaptive threshold) and held on that side for a few bars?
Did MACD flip the way we want without price already tagging the rail that bar?
Have we avoided recent bounces off that rail (no fake-out)?
→ If yes, enter and aim for a tag back to the rail, with ATR/% stop and optional time stop.
If you want, I can add a simple on-chart “rating” (0–100) similar to your Python scorer (distance beyond min, MACD bucket, extension streak) so you can visually rank signals in TradingView too.
