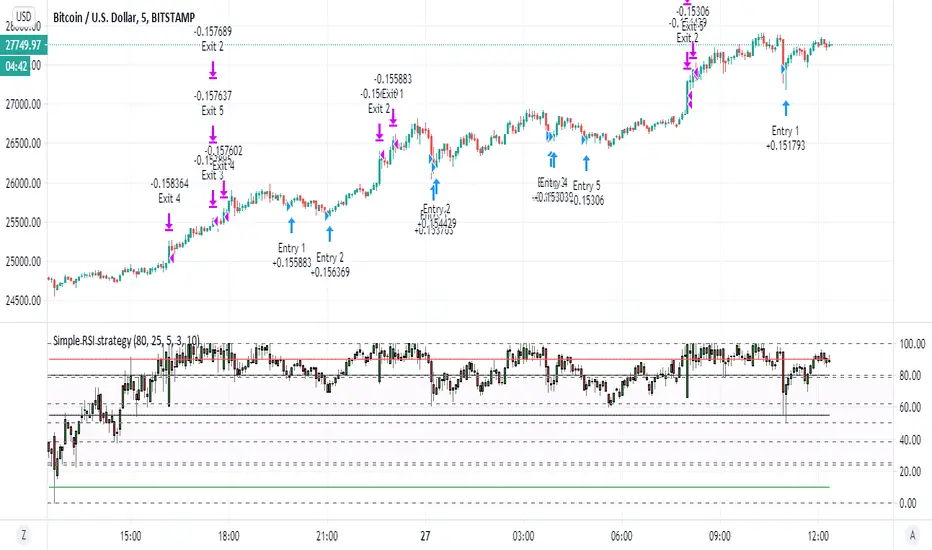
Simple RSI strategyso this script just take it as teaching how to make easy strategy
many time we try complex one and we fail
thanks to coinrule for his very smart method of pyramid
i just here in this very simple rsi strategy want to show how even lame strategy like RSI can be very profitable:)
1. we exit by take profit
2. we make sure that for exit by take profit the stop loss will be far lets say 10% or more
3. this shit only work good in up trending markets:)
why regular rsi strategy not working? because the exit is shity ... it depend on false top that based on RSI above 70 or 80 in general.
in bullish state this will exit us faster then we desire and will cost us loss . in bearish state rsi will not go so high and we exit too late so the stop loss is our our only saver
here by exiting by% we get much better results
so what happen if the trend is bearish? you can can try to do the same just reverse order to create more shorts (sometime it work sometime is not)
end conclusion in bullish trending market even shifty strategy is good
the only reason this one work is actually because of the script of coinrule so i want to thank him on this
happy new year to all TV members
Pesquisar nos scripts por "the script"
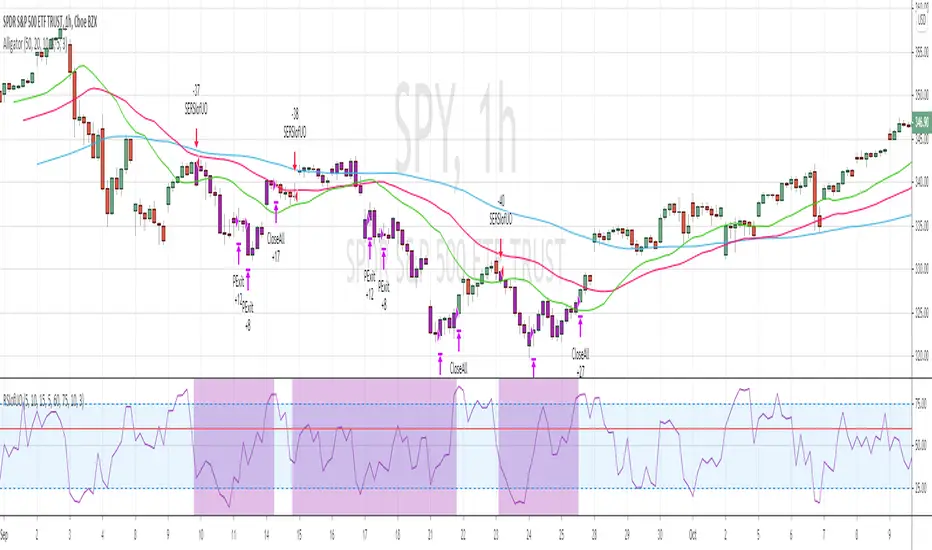
RSI of Ultimate Oscillator [SHORT Selling] StrategyThis is SHORT selling strategy with Ultimate Oscillator. Instead of drectly using the UO oscillator , I have used RSI on UO (as I did in my previous strategies )
Ultimator Oscillator settings are 5, 10 and 15
RSI of UO setting is 5
Short Sell
==========
I have used moving averages from WilliamAlligator indicator --- settings are 10(Lips), 20(teeth) and 50 (Jaw)
when Lips , Teeth and Jaw are aligned to downtrend (that means Lips < Teeth < Jaw )
Look for RSIofUO dropping below 60 ( setting parameter is Sell Line )
Partial Exit
==========
When RSIofUO crossing up Oversold line i.e 30
Cover Short / Exit
=================
When RSIofUO crosisng above overbought line i.e 70
StopLoss
========
StopLoss defaulted to 3 % , Though it is mentioned in settings , it has not been not used to calcuate and StopLoss Exit... Reason is, when RSIofUO already crossed 60 line (for SHORTING) , then it would take more efforts go up beynd 60. There is saying price takes stairs to climb up but it takes elevator to go down. I have not purely depend on this to exit stop loss, however noticed the trades in this stratgey did not get out with loss higher than when RSIofUO reaching 70 level.
Note
======
Williams Alligator is not drawn from the script. It is manually added to chart for illustration purpose. Please add it when you are using this strategy , whch woould give an idea how the strategy is taking Short Trades.
This is tested on Hourly chart for SPY
Bar color changes to purple when the strategy is in SHORT trade
Warning
========
For the eductional purposes only
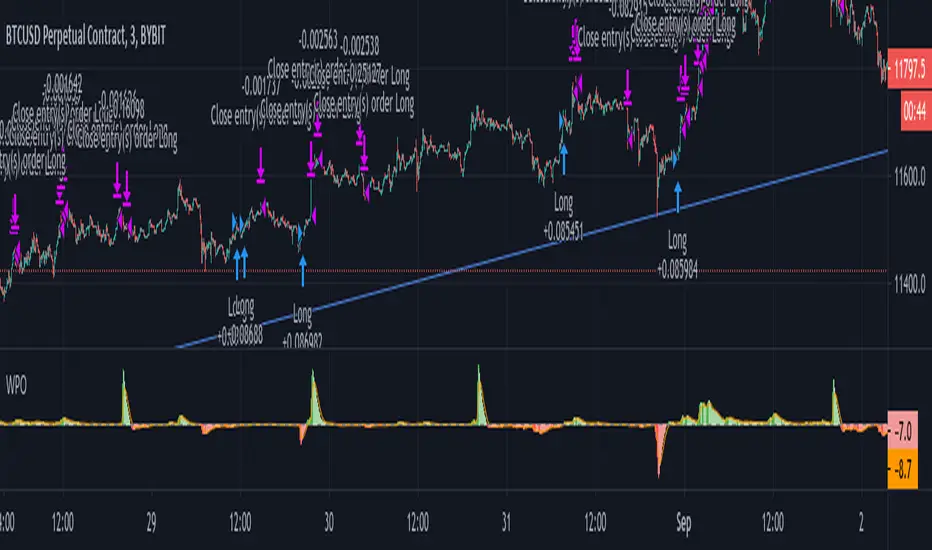
Weighted Price Oscillator (STRATEGY)Weighted Price Oscillator is an unique indicator that shows the relationship between two custom variables that trigger signals upon specific conditions. When WPO (short for weighted price oscillator) crosses over the signal or zero line, it creates a buy signal and conversely below the signal or zero line, it generates a take profit signal. All of which are provided that the specific conditions are met.
Inside the script's options, the following options are: signal sensitivity, enable signal background color, and take profit percentage. The signal sensitivity allows you to adjust the script's trigger sensitivity, so that the script can fire signals appropriate for a specific timeframe. Enabling signal background color will provide a visual on the oscillator when a buy or take profit signal is being created. And lastly, the take profit percentage option is for configuring the trade size percentage of which you want to take profit with.
PM me for access.
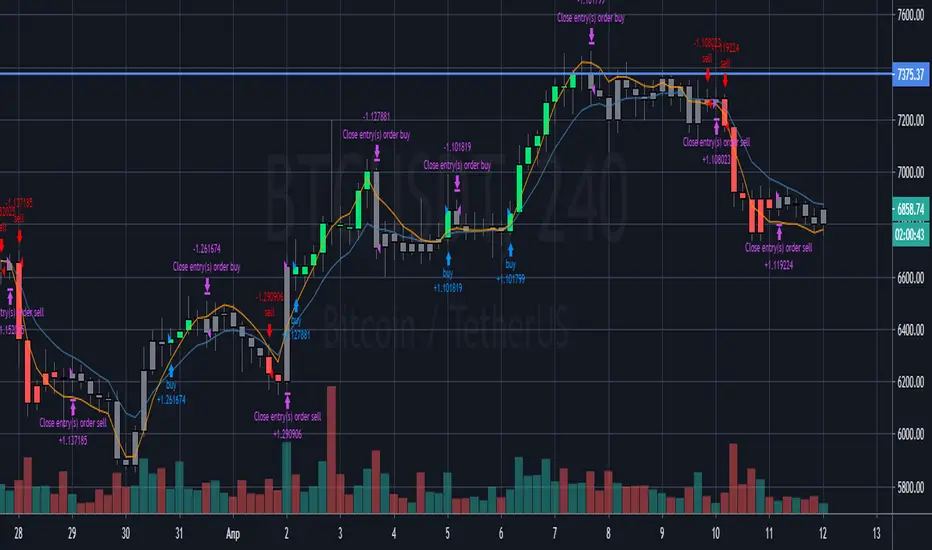
Donchian Channel Strategy [for free bot]
I present to you a script for testing the Donchian channel breakout strategy for the Binance_exchange.
This strategy is trending, and is especially effective for trading cryptocurrency futures.
This strategy is very flexible, and you can configure virtually all possible parameters, moreover, separately for longs and separately for shorts.
In the script, you can configure the parameters of the channel for entry and exit, the exit method, enable or disable purchases / sales, specify take profit and stop loss, and more.
On the example of optimization, only 20% of the deposit is used. This is done for diversification, since there are 37 contracts on binance_futures (at the time of writing the script description). That is, by optimizing the parameters for different currencies, you can very well reduce risks.
Представляю Вам скрипт для тестирования стратегии пробоя канала Дончиана для биржи Бинанс.
Данная стратегия относится к трендовым, и особенно эффективная на торговли криптовалютных фьючерсов.
Данная стратегия очень гибкая, и можно настроить фактически все возможные параметры, при чем, отдельно для покупок и отдельно для продаж.
В скрипте можно настроить параметры канала на вход и на выход, метод выхода, разрешить или запретить покупки/проаджи, указать тейк-профит и стоп-лосс и другое.
На примере оптимизации используется всего 20% от депозита. Это сделано для диверсификации, так как на фьючерсах бинансе присутсвует 37 контрактов (на момент написания описания скрипта). Т.е., оптимизировав параметры под разные валюты, можно очень хорошо снизить риски.

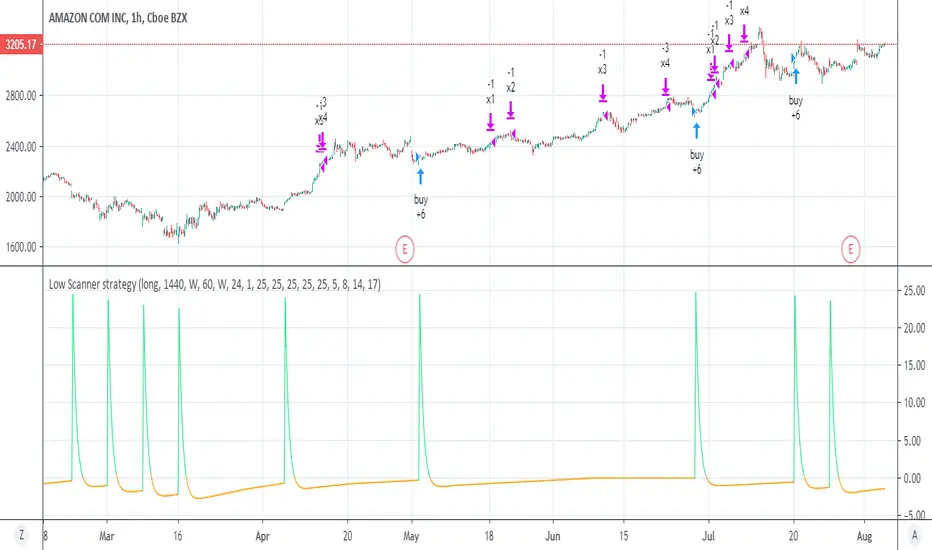
Low Scanner strategyThis is the strategy I made using low scanner
there is no repaint as there is no security at all
the exit is by using multiple exit point by equity shown in the script of adolgov
so you can set the low low scanner to any position you want by no security MTF (look on the study for detail about it)
the exit you set acording to % and the equity as suggested by adolgov
this scripyt is free you can make the exit diiferent
it just example how to create better non repainting strategies with MTF
look on the same setting on stocks just 1 hour candle look very nice there:)
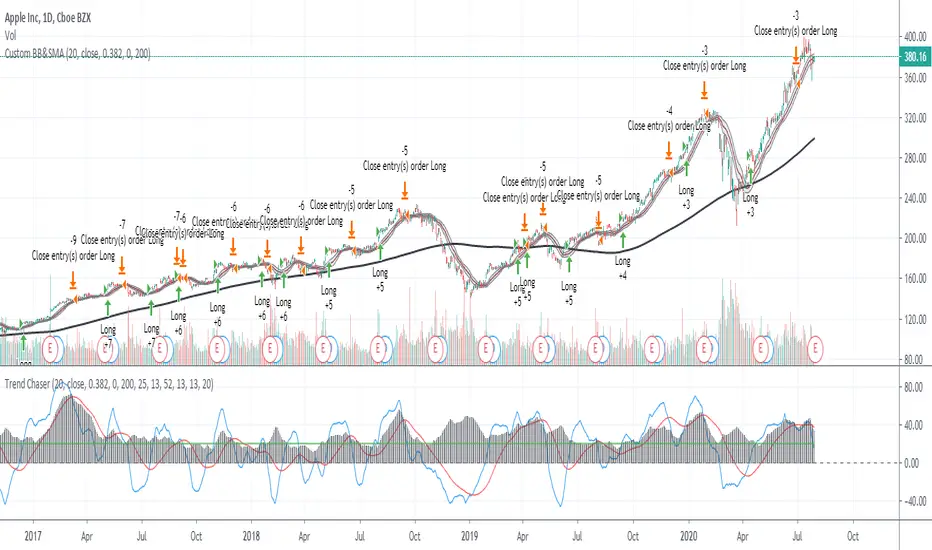
ADX_TSI_Bol Band Trend ChaserThe idea of this script is to be a low risk strategy on trending stocks (or any other trending market), aiming to achieve minimal draw down (e.g. at time of writing AAPL only had ~1.36% draw down, FB ~1.93% draw down and the SPY was 0.80% draw down and all remained profitable).
Testing proved it shouldn't be used in choppy stocks and best period was on daily charts. The back test filter goes back until 2010 so you can obtain 10 years of data.
The strategy utilizes the 200 Moving Average, a Custom Bollinger Band, a TSI with 52 period weighted moving average and ADX strength.
Although back test dates are set to 2010 - 2020, all other filters (moving average, ADX, TSI , Bollinger Band) are not locked so they can be user amended if desired. However the current settings have been tested with manual trading for quite some time to get this combination correct.
Buy signal is given when trading above the 200 moving average + 5 candles have closed above the upper custom Bollinger + the TSI is positive + ADX is above 20.
As back testing proved that this traded better only in tends then some Sell/Short conditions have been removed from the script and this only takes Long orders.
Only requires 2 additional lines of code to add shorting order and then remove the "buy" condition and this could be used for a downward trending stock instead.
Close for either long or short trades is signaled once the TSI crosses in the opposite direction indicating change in trend strength.
Further optimization could be achieved by adding a stop loss, which I may do in the future.
NOTE: This only shows the lower indicators however for visualization you can use my script "CUSTOM BOLLINGER WITH SMA", which is the upper indicators in this strategy.
This is my first attempt at coding a strategy so I'm happy to receive any feedback or hints on how this could be written better from any experienced coders!
NASDAQ:AAPL AMEX:SPY
Volume Based Buy/SellThis is my very first scrip on this platform. It's the first version of the script, It works on the volume-based moving averages and exponential moving average.
I have added the buy/sell signals for educational purposes only. While adding the buy/sell signal I have an additional check on the strength of the trend to reduce loss to a minimum.
How to use:
1. Use with Heikin Ashi Chart.
2. Use 15 Min timeframe for intraday.
Some improvements I am working in the near future is:
1. Exit tread with the maximum profit.
2. Reduce down false trad to 0%.
To encourage and support please like the script try using for your own paper trading.
Dont forget to leave a comment on if you see any improvement in the script or any idea you have. Happy treading together.

XProfit Strategy BacktesterHello,
This Script is a Backtesting Strategy tester of XProfit and allows users to clearly define a profitable strategy.
To Define a profitable strategy, there is the option to modify the parameters "XR" and "Sensitivity".
The Script in itself is build on ATR which gives Long or Short signal.
Note: The strategy script does not allow alerts. It does only allow backtesting.
How To Get Access: DM me for a Trial or use the links below this post to purchase the Indicator which will automatically come with XProfit
Happy Trading.

GoldMode On (Triple compromise strategy) TF 60-240BINANCE:BTCUSDT
Greetings.
I am publishing this script in order to get feedback for further work on it.
The script combines a compromise between several classic strategies, and each of them uses modifications of classic indicators on specially selected averaging sliding indicators.
1. The script uses an ATR-based filter (it's off by default, as it's better on BTCUSD , but you can enable it in the settings if you want to use it on EURUSD , for example, or on other symbols).
2. A strategy based on crossing the moving.
3. A strategy based on determining the direction of movement of the modified slow and fast RSI .
4. A strategy based on the modified ADX +DI -DI .
The essence of the strategy in finding a compromise decision on the signals coming from each of these three strategies.
=====
Приветствую.
Данный скрипт публикую с целью получить обратную связь для дальнейшей работы над ним.
Скрипт сочетает в себе компромисс между несколькими классическими стратегиями, причём каждая из них использует модификации классических индикаторов на специальным образом подобранные усредняющие скользящие.
1. В скрипте используется фильтр на основе ATR (по умолчанию выключен, т.к. на BTCUSD так лучше, но можно включить в настройках, если хотите использовать его на EURUSD , например, или на других инструментах).
2. Стратегия основанная на пересечении скользящих.
3. Стратегия основанная на определении направления движения модифицированных медленной и быстрой RSI .
4. Стратегия основанная на модифицированном ADX +DI -DI .
Суть стратегии в поиске компромиссного принятия решения по сигналам поступающим от каждой из этих трёх стратегий.
sma dipsparity and sdvFXBTCJPY 1min contrarian script (2020/1/30)
1分足の逆張りです.
If you want to use other timescale, need to change disparity rate and sdv.
To display disparity(sma) and standard deviation, and to draw a hline(pine function) a certain valu. And lets think. I thought disparity rate 1~1.3 or -1~-1.3 are able to use constrarian trade (and sdv>600).
In bottom, disparity index is auxiliary. It is different from the multiple in the script to make the value easier to understand.
Sorry if the expiration date of the script has expired.

Multi RIS Length RSI Strategy calibrated to 20min timeframeI have been working on many itterations of this script, on multiple time frames, with multiple settings.
It's not exactly how I want it, but if used on the 20 min timeframe (I chose this one to publish, not because it's the most profitable, or percent profitable , but for multiple other reasons.
1) From my back testing, this seems to be the most stable (gives the greatest margin for error). By that I mean, I am not a bot, I am a human trader, so I actually have to sleep, and work, and can't always trade all the time when I when I get my signals. So I need some margin of error.
The 20min time frame gives me this, it's still decently profitable (52K), and allows me some margin of error for being human.
2) It not exactly how I want it, because you have to use it in conjunction with the strategy tester to see if it is in longs or shorts (open trades). You can't see that on the app, or even if you are logged in to TV on a browser on a smart phone. At least I cant, I can only see the strategy tester when I am logged in on my computer, which obviously I can not be all the time.
3) It's also not exactly how I want it because it doesn't tell you when it is switching from buying additional longs (or shorts), and closing them out, and reversing. You can figure this out from the strategy tester, but I would like my script to make it more clear in real time.
4) The alerts on the script only fire after the current bar is closed. So really to use this you need to be a non free member or TV, because then you can add the appropriate RSIs to your chart, and set up real time alerts on them that will fire in real time, as opposed to displaying on the chart after the bar closes (a lot can happen in 20 minutes). Which is sad, and not my intent, I want this to be useful to free members, I just don't know how to do that given they don't have custom time frames (like 20 min), and multiple real time alerts. I can't fix that, that's a limitation of TV.

MoneyBible QTUMUSDT BacktesterMoneybible BINANCE:QTUMUSDT backtester on 15m candlestick . It will be re-optimized monthly.
The script is written in PineScript V.3, makes no use of the security() function and does not use the Trailing Stop-Loss function from TradingView. No repainting issue.
DM me for joining discord and getting a trial.
Alert script here :

MoneyBible ETHUSD BacktesterMoneybible BITMEX:ETHUSD backtester on 15m candlestick . It will be re-optimized monthly.
The script is written in PineScript V.3, makes no use of the security() function and does not use the Trailing Stop-Loss function from TradingView. No repainting issue.
Alert script here :

MoneyBible XBTUSD BacktesterMoneybible BITMEX:XBTUSD backtester on 10m candlestick . It will be re-optimized monthly.
The script is written in PineScript V.3, makes no use of the security() function and does not use the Trailing Stop-Loss function from TradingView. No repainting issue.
Alert script here :

[M10] Ichimoku Keltner Channel Scalper [Backtest]Hey all,
This script combines a couple of popular indicators to create a reliable yet versatile opportunity to automate trades based on the Ichimoku Cloud. The idea is to use bullish/bearish Ichimoku crossovers to enter positions whilst taking advantage of a modified Keltner Channel to exit these positions at maximum profit.
The script has been backtested on various timeframes and proves effective in both trending and ranging markets.
I have also added the ability to limit your positions to only long, or short, if this is of preference.
An alerts version of this script is also available at no cost on my page - enjoy!
Any questions? Let me know!

FREE BACKTEST STRATEGY BTC/USDT 15m Binance LONGA long only strategy for trading BINANCE:BTCUSDT in a 15m timeframe built upon Donchian Channels.
The script is already configured for this market /timeframe.
I built it using my generic version that you can request access by leaving a comment:
To get access to the alert setup version and automate the strategy, you need to purchase a subscription on my website .
Thanks for the feedback/support !

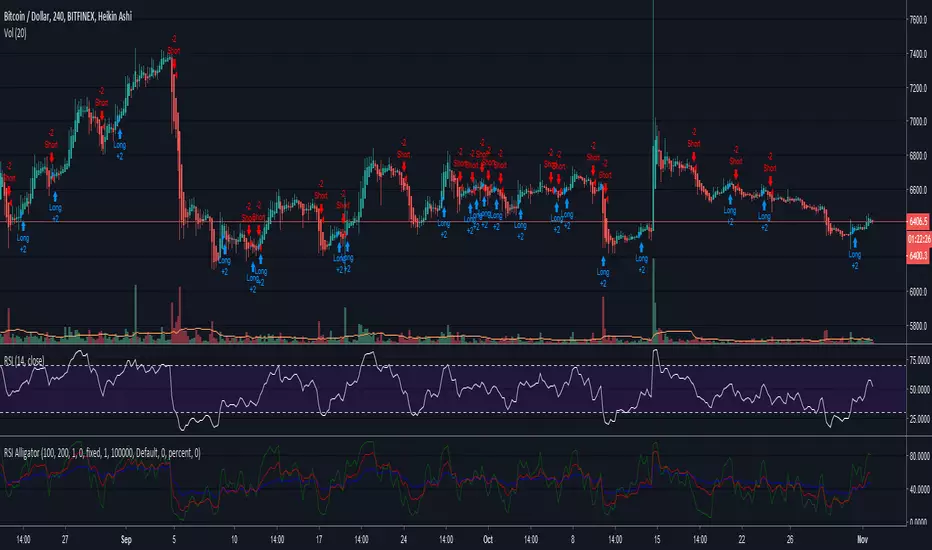
RSI Alligator StrategyHello trading family! Just wanted to give a quick write up and share the new code for the RSI Alligator Strategy. I amended it to show every crossover signal, weak and strong, so we can accurately gauge its effectiveness.
Having played with this for a couple hours now I have learned a few things
-Using Heikin Ashi seems to smooth it out a bit and provides about 20% fewer signals, leading to overall more accuracy. However, it can be misleading as the Heikin Ashi opening price doesn't always line up with the market price, especially in cases of large moves. Overall though it didn't seem too far off except for a few instances.
-Also, using the Heikin Ashi gives you a better idea of the trend, which this indicator is primarily used to detect and exploit.
-Having tested on TF of 1H-1D, overall profitability is found to be highest between 4H-12H, with 1D giving the "safest" longer term signals, and lower TF's generating many more signals due to volatility.
-Instead of waiting for the next signal in order to close, you can often use a crossover/crossunder of the 5 and 13 to close the previous trade, especially if paired with a Heikin Ashi of opposite color (green to close a short, red to close a long)
-You will also notice several instances where the Green 5 period show divergences that aren't visible on the regular RSI, another handy little feature
So far I have still only tested this on BTCUSD. Feel free to apply it to any coin and let me know what you find.
Here is the script. If you have any ideas or suggestions please let me know!
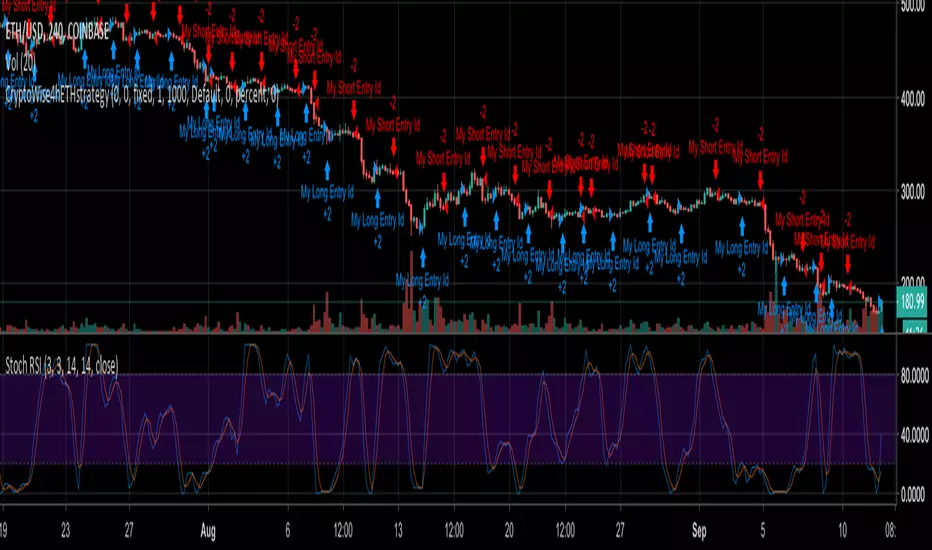
CryptoWise4hETHstrategyCrypto Wise 4h ETH Trading Script with Alerts
ETH is very volatile, and that's what makes this script great: Being able to catch the next Move Up or Down.
No repainting.
Better to be used on a 4hr Chart.
No indicator is perfect, but when it gets integrated into a great strategy, and used together with other indicators like the Stoch RSI , you can easily make great trades.
You can get access to the script for $20 / month. Payments accepted in BTC, ETH, LTC, BCH.
72hr Trial given upon request.
Crypto Reversal Scalper DEMO / FREE BacktesterCrypto Reversal Scalper Lite
This is a lite version of:
This script allows anyone to try out the capability of the script with restrictions to some features. If you want to unlock all the features, consider upgrading.
Full version also includes alerts for automated trading.

Market Sniper V1 [Strategy]Market Sniper is a trend-based script born and created with leverage trading in mind. I created this to trade automatically with leverage using AutoView Chrome Extension on BitMex XBTUSD.
Features:
• Trend-Based: use higher timeframe to check the trend of the coin, and a threshold to evaluate the trend strength.
• Dual-Behavior: different settings are used when the trend is strong and when it is weak. With a strong trend it can catch big trades, with a stable trend it can act like a scalper with smaller and faster trades.
• Smart Profit: you can set a percentage gain and a trail setting. The script will try to trail the price if the trend is strong, otherwise it will exit at the specified gain.
• Loss Control: you can set a percentage stop-loss to cover bad entries. The market is unpredictable, no script is perfect, sooner or later it will take a bad choice.
The chart shows the result for the full month of August using leverage 10.
If you want to try it just contact me.

Prometheus Trend SurferPrometheus Trend Surfer is a strategy built to follow trends and make the best use of it by giving you long and short entries.
It works on all time frames and has a tight tolerance for non-profitable entries so you won’t get stuck in losing positions.
Gives you an option to set trend length so you can fit it to your style of trading.
You also have the option to backtest from the date you set in the options dialog.
Instructions
1. Load the script
2. Use Heikin-Ashi candles
Did we get your attention? If you wish to buy our script, shoot us a PM.
We are not analysts, investment advisors or anything of that sort. Everything that we provide with this script is purely for guidance, informational and educational purposes. All information contained herein should be independently verified and confirmed. We do not accept any liability for any loss or damage whatsoever caused in reliancee upon such information or services. Please be aware of the risks involved with any trading done in any financial market. Do not trade with money that you cannot afford to lose. When in doubt, you should consult a qualified financial advisor before making any investment decisions.

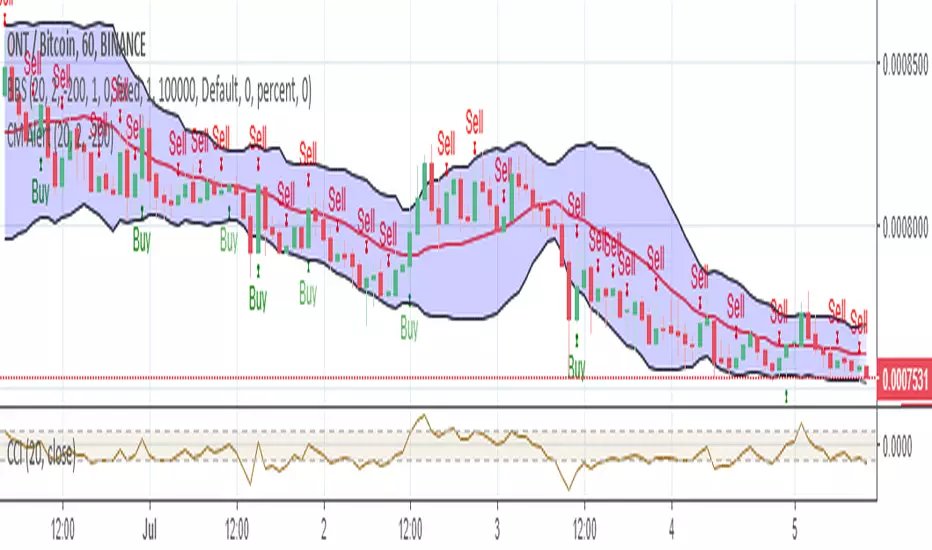
Bollinger Bear SniperThis script uses Bollinger Band but with different interpretation. The upper Bollinger Band is the resistant level, the lower Bollinger Band is the base or support level. The Commodity Channel Index (CCI) and the Bollinger Bandwidth helps us avoid high risk.
The script identifies candles that are marking bold upward moves in prices and fires buy signal. Sales signals are fired when the candle closes in positive. The idea is to buy and sell on the same candle or next positively closed candle. This is anti-bear-anti-bags strategy. You either make profit or loss holding no bag. When you gain more than lose you are in business. This script is set to gain more than lose. We however offer no guarantee, expressed or implied. We are NOT responsible.
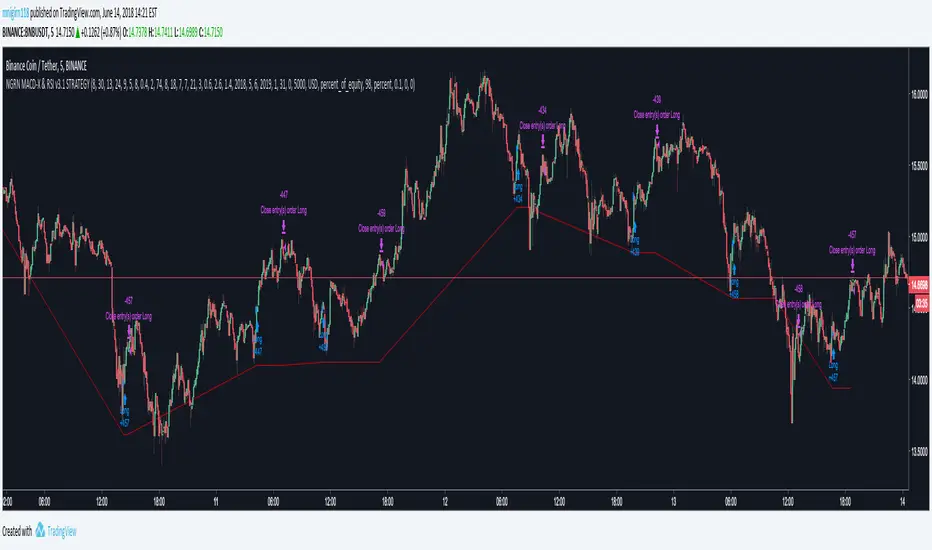
NGRN MACD-X & RSI v3.1 STRATEGYMACD-X, RSI & Volume Indicator Strategy - Version 3.1
Overview
This strategy and it's associated study were modeled after the famous Philakone described algorithms on his now defunct instructional video series.
This indicator allows for full customisation of parameters and interaction between three indicators that allow users to shape their trading methods to their desired goals. This associated strategy also allows users to backtest the study alerts script and find the best settings towards that end.
MACD + RSI + VOLUME - are of the most powerful and widely usded indicators, MACD/Histogram crosses, coupled with RSI & Volume increases/decreases will detects areas of deeply oversold / overbought and buys/sells on the reversal
Features
Full customisation - All parameters are open for customising to allow the trader to build their own strategy and adapt from market to market.
Clean/Simple UI - Facilitating ease of use.
Enable Buying or Selling, - or have them both active at the same time.
Toggle off and on ALTERNATING Buy and Sell feature (pyramiding) - to allow for consecutive dollar cost averaging style buys or SCALING out of an entry (partial sell).
Customizable Stop-Loss plot - to enable users to create a STOP-LOSS alert option or other alert(s) based on the plot location. See settings screenshot.
Study and associated Strategy - to use the TradingView ‘Strategy Tester’ back-testing features to find the best alert settings for specific coins in bear, bull and sideways markets.
Changes Version 3.1
UI consolidates reduntant script inputs making the script easier to use.
Fixes STOP-LOSS algorithm.
Adds a STOP-LOSS Plot (red line) to enable users to create a STOP-LOSS alert option or other alert(s) based on the plot location. See settings screenshot.
Access
Full Access is 0.1 ETH , one time fee for LIFETIME access to the STUDY indicator, STRATEGY and future updates as well as support and SETTINGS for various markets on the Binance Exchange.
Settings
BUY SETTINGS: prntscr.com
SELL SETTINGS: prntscr.com
STOP-LOSS SETTINGS : prntscr.com