Adaptive Fractal Grid Scalping StrategyThis Pine Script v6 component implements an "Adaptive Fractal Grid Scalping Strategy" with an added volatility threshold feature.
Here's how it works:
Fractal Break Detection: Uses ta.pivothigh and ta.pivotlow to identify local highs and lows.
Volatility Clustering: Measures volatility using the Average True Range (ATR).
Adaptive Grid Levels: Dynamically adjusts grid levels based on ATR and user-defined multipliers.
Directional Bias Filter: Uses a Simple Moving Average (SMA) to determine trend direction.
Volatility Threshold: Introduces a new input to specify a minimum ATR value required to activate the strategy.
Trade Execution Logic: Places limit orders at grid levels based on trend direction and fractal levels, but only when ATR exceeds the volatility threshold.
Profit-Taking and Stop-Loss: Implements profit-taking at grid levels and a trailing stop-loss based on ATR.
How to Use
Inputs: Customize the ATR length, SMA length, grid multipliers, trailing stop multiplier, and volatility threshold through the input settings.
Visuals: The script plots fractal points and grid levels on the chart for easy visualization.
Trade Signals: The strategy automatically places buy/sell orders based on the detected fractals, trend direction, and volatility threshold.
Profit and Risk Management: The script includes logic for taking profits and setting stop-loss levels to manage trades effectively.
This strategy is designed to capitalize on micro-movements during high volatility and avoid overtrading during low-volatility trends. Adjust the input parameters to suit your trading style and market conditions.
Pesquisar nos scripts por "the script"

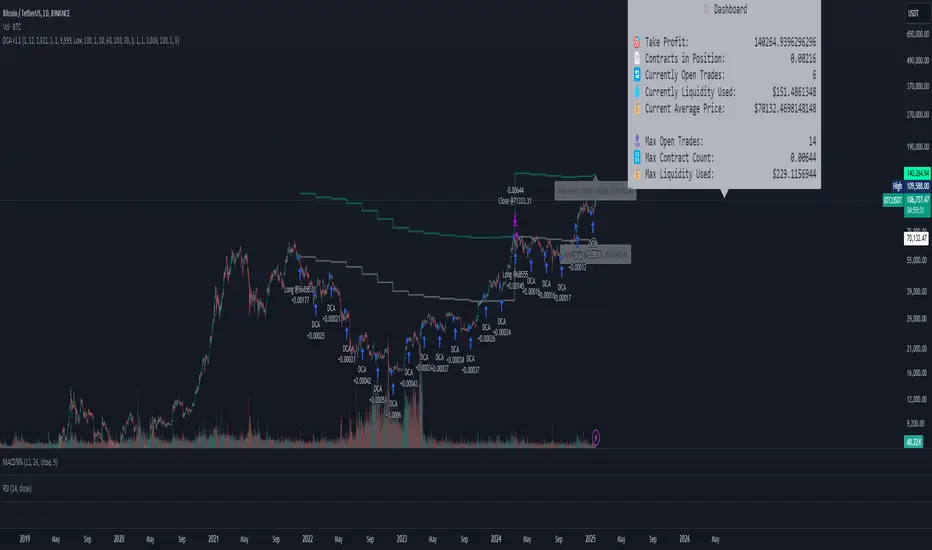
DCA Simulation for CryptoCommunity v1.1Overview
This script provides a detailed simulation of a Dollar-Cost Averaging (DCA) strategy tailored for crypto traders. It allows users to visualize how their DCA strategy would perform historically under specific parameters. The script is designed to help traders understand the mechanics of DCA and how it influences average price movement, budget utilization, and trade outcomes.
Key Features:
Combines Interval and Safety Order DCA:
Interval DCA: Regular purchases based on predefined time intervals.
Safety Order DCA: Additional buys triggered by percentage price drops.
Interactive Visualization:
Displays buy levels, average price, and profit-taking points on the chart.
Allows traders to assess how their strategy adapts to price movements.
Comprehensive Dashboard:
Tracks money spent, contracts acquired, and budget utilization.
Shows maximum amounts used if profit-taking is active.
Dynamic Safety Orders:
Resets safety orders when a new higher high is established.
Customizable Parameters:
Adjustable buy frequency, safety order settings, and profit-taking levels.
Suitable for traders with varying budgets and risk tolerances.
Default Strategy Settings:
Account Size: Default account size is set to $10,000 to represent a realistic budget for the average trader.
Commission & Slippage: Includes realistic trading fees and slippage assumptions to ensure accurate backtesting results.
Risk Management: Defaults to risking no more than 5% of the account balance per trade.
Sample Size: Optimized to generate a minimum of 100 trades for meaningful statistical analysis. Users can adjust parameters to fit longer timeframes or different datasets.
Usage Instructions:
Configure Your Strategy: Set the base order, safety order size, and buy frequency based on your preferred DCA approach.
Analyze Historical Performance: Use the chart and dashboard to understand how the strategy performs under different market conditions.
Optimize Parameters: Adjust settings to align with your risk tolerance and trading objectives.
Important Notes:
This script is for educational and simulation purposes. It is not intended to provide financial advice or guarantee profitability.
If the strategy's default settings do not meet your needs, feel free to adjust them while keeping risk management in mind.
TradingView limits the number of open trades to 999, so reduce the buy frequency if necessary to fit longer timeframes.
Advanced Position Management [Mr_Rakun]Advanced Position Management
This Pine Script code is for a strategy titled "Advanced Position Management," aimed at effective trade execution and management using multiple take profit levels, trailing stop loss, and dynamic position sizing.
Take Profit Levels: It defines up to three take profit (TP) levels, allowing partial position exits at different price thresholds. The take profit levels and their respective quantities are adjustable using inputs.
Stop Loss and Trailing Stop: The script implements an initial stop loss based on a percentage from the entry price. Additionally, it features a trailing stop that moves based on either a percentage or previous TP levels, dynamically adjusting to maximize gains while protecting profits.
Position Size: The position size is customizable and based on USD value, allowing the trader to manage risk more effectively.
Advantages:
Flexibility: Multiple take profit levels and a dynamic stop loss system allow traders to lock in profits while keeping the position open for further gains.
Risk Management: The initial stop loss and trailing stop help to limit losses and protect profits as the trade moves in the desired direction.
Automation: Once the strategy is deployed, it automatically handles entry, exit, and stop management, reducing the need for constant monitoring.
------ TR ------
Gelişmiş Pozisyon Yönetimi
Bu Pine Script kodu, Gelişmiş Pozisyon Yönetimi için kendi stratejilerinize kolayca entegre edeceğiniz bir risk yönetimidir. Çoklu kâr al seviyeleri, takip eden stop-loss ve dinamik pozisyon büyüklüğü kullanarak işlem yürütme ve yönetiminde etkilidir.
Gelişmiş Pozisyon Yönetimi
Kâr Alma Seviyeleri;
Kod, pozisyonların farklı fiyat seviyelerinde kısmi kapatılmasını sağlayan üç farklı kâr alma (TP) seviyesini tanımlar. Bu kâr alma seviyeleri ve ilgili miktarları, girişlerle ayarlanabilir.
Stop Loss ve Takip Eden Stop;
Koda, giriş fiyatından bir yüzdeye dayalı olarak başlangıçta stop-loss uygulanır. Ayrıca, fiyat hareketine göre kendini ayarlayan takip eden bir stop-loss sistemi bulunur. Ayrıca TP seviyelerini takip eden stop loss özelliğide vardır.
Avantajları:
Esneklik;
Çoklu kâr alma seviyeleri ve dinamik stop-loss sistemi, trader'ların kazançlarını kilitleyip aynı zamanda pozisyonu açık tutmalarına olanak tanır.
Risk Yönetimi;
Başlangıç stop-loss ve takip eden stop, zararı sınırlamaya ve kazançları korumaya yardımcı olur.
Otomasyon;
Strateji bir kez devreye alındığında, giriş, çıkış ve stop yönetimi otomatik olarak gerçekleştirilir, bu da sürekli takip ihtiyacını azaltır.

Custom Buy BID StrategyThis Pine Script strategy is designed to identify and capitalize on upward trends in the market using the Average True Range (ATR) as a core component of the analysis. The script provides the following features:
Customizable ATR Calculation: Users can switch between different methods of ATR calculation (traditional or simple moving average).
Adjustable Parameters: The strategy allows for adjustable ATR periods, ATR multipliers, and custom time windows for executing trades.
Buy Signal Alerts: The strategy generates buy signals when the market shifts from a downtrend to an uptrend, based on ATR and price action.
Profit and Stop-Loss Management: Built-in take profit and stop-loss conditions are calculated as a percentage of the entry price, allowing for automatic position management.
Visual Enhancements: The script highlights the uptrend with green lines and optionally colors bars to help visualize market direction.
Flexible Timeframe: Users can configure a specific date range to activate the strategy, offering more control over when trades are executed.
This strategy is ideal for traders looking to automate their buy entries and manage risk with a straightforward trend-following approach. By utilizing customizable settings, it adapts to various market conditions and timeframes.

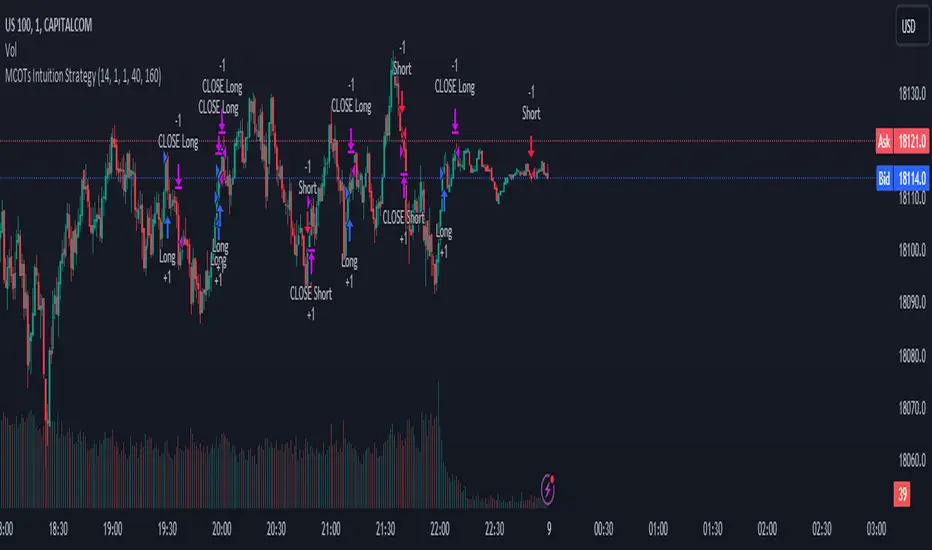
MCOTs Intuition StrategyInitial Capital: The strategy starts with an initial capital of $50,000.
Execution: Trades are executed on every price tick to capture all potential movements.
Contract Size: The default position size is one contract per trade.
Timeframe: Although not explicitly mentioned, this strategy is intended for a one-minute timeframe.
RSI Calculation: The Relative Strength Index (RSI) is calculated over a user-defined period (default is 14 periods).
Standard Deviation: The script calculates the standard deviation of the change in RSI values to determine the threshold for entering trades.
Exhaustion Detection: Before entering a long or short position, the script checks for exhaustion in the RSI’s momentum. This is to avoid entering trades during extreme conditions where a reversal is likely.
Entry Conditions: A long position is entered when the current RSI momentum exceeds the standard deviation threshold and is less than the previous momentum multiplied by an exhaustion factor. A short position is entered under the opposite conditions.
Limit Orders for Exit: Instead of traditional stop loss and take profit orders, the strategy uses limit orders to exit positions. This means the strategy sets a desired price level to close the position and waits for the market to reach this price.
Profit Target and Stop Loss: The script allows setting a profit target and stop loss in terms of ticks, which are the smallest measurable increments in price movement for the traded asset.
blah blah whatever
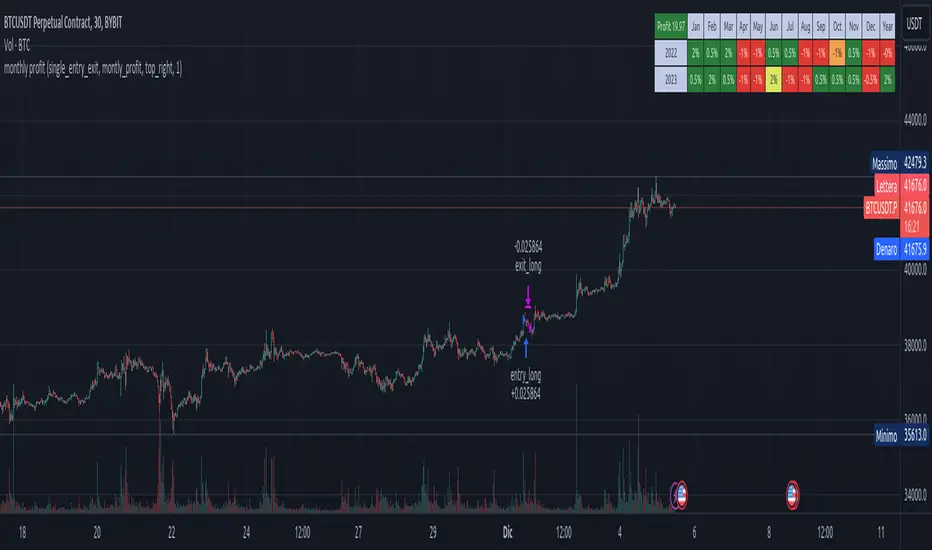
Stx Monthly Trades ProfitMonthly profit displays profits in a grid and allows you to know the gain related to the investment during each month.
The profit could be computed in terms of gain/trade_cost or as percentage of equity update.
Settings:
- Profit: Monthly profit percentage or percentage of equity
- Table position
This strategy is intended only as a container for the code and for testing the script of the profit table.
Setting of strategy allows to select the test case for this snippet (percentage grid).
Money management: not relevant as strategy is a test case.
This script stand out as take in account the gain of each trade in relation to the capital invested in each trade. For example consider the following scenario:
Capital of 1000$ and we invest a fixed amount of 1000$ (I know is too risky but is a good example), we gain 10% every month.
After 10 months our capital is of 2000$ and our strategy is perfect as we have the same performance every month.
Instead, evaluating the percentage of equity we have 10% the first month, 9.9% the second (1200$/1100$ - 1) and 5.26% the tenth month. So seems that strategy degrade with times but this is not true.
For this reason, to evaluate my strategy I prefer to see the montly return of investment.
WARNING: The strategy provided with this script is only a test case and allows to see the behavior with different "trades" management, for these reason commision are set to zero.
At the moment only the provided test cases are handled:
test 1 - single entry and single exit;
test 2 - single entry and multiple exits;
test 3 - single entry and switch position;
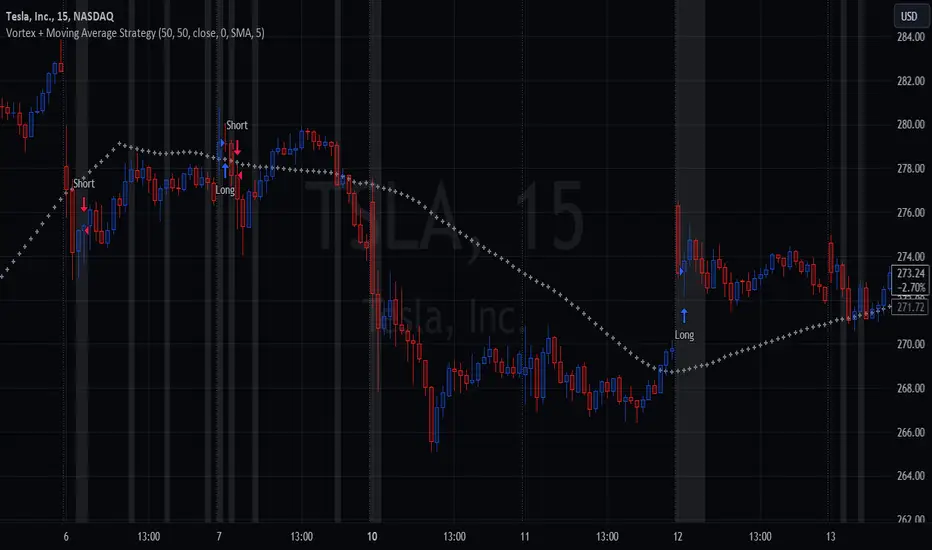
Vortex Cross w/MA ConfirmationThis script is a trading strategy that combines the Vortex Indicator and a Moving Average (MA) to generate potential entry signals for long and short positions.
1. Vortex Indicator:
The Vortex Indicator consists of two lines: Vortex Positive (VIP) and Vortex Negative (VIM). It is designed to identify trend direction and measure the strength of a trend.
2. Moving Average (MA):
The script uses a chosen type of Moving Average (SMA, EMA, SMMA, WMA, or VWMA) to smooth the price data. The smoothed line is referred to as the "Smoothing Line."
3. Determine Long and Short Conditions:
The script looks for potential long entry signals when VIP crosses above VIM, highlighting each crossover on the chart, and the closing price is above the Smoothing Line. It searches for short entry signals when VIM crosses above VIP, with the closing price is below the Smoothing Line. When the long or short conditions are met, the strategy enters either a long or short position accordingly.
Potential Usage:
The strategy can be utilized in trending markets, where the Vortex Indicator helps identify trend direction and strength, and the Moving Average smooths the price data to filter out some noise. It aims to capture trends and ride them while avoiding false signals during choppy or sideways markets.
Ta StrategyHello guys
This script follows traditional technical indicators
MACD, ADX, RSI and pivot points
If the price is above the resistance and the MACD has crossover ,and the RSI 14 is above 50
ADX is higher than 20, and DI+ is higher than DI-. This is a buy signal and vice versa for a sell signal
The script moves the stop loss to the entry price after the first target is reached
You can specify the quantity you want to sell when the price reaches the first target
There are also options like if you want the script to entry long or short, or both
you can reverse the strategy if it does not work well
If you want to inquire about any details, please let me know in the comments

The Z-score The Z-score, also known as the standard score, is a statistical measurement that describes a value's relationship to the mean of a group of values. It's measured in terms of standard deviations from the mean. If a Z-score is 0, it indicates that the data point's score is identical to the mean score. Z-scores may be positive or negative, with a positive value indicating the score is above the mean and a negative score indicating it is below the mean.
The concept of Z-score was introduced by statistician Carl Friedrich Gauss as part of his "method of the least squares," which was an important step in the development of the normal distribution and Z-score tables. It's a key concept in statistics and is used in various statistical tests.
In financial analysis, Z-scores are used to determine whether a data point is usual or unusual. You can think of it as a measure of how many standard deviations an element is from the mean. For instance, a Z-score of 1.0 would denote a value that is one standard deviation from the mean. Z-scores are also used to predict probabilities, with Z-scores having a distribution that is expected to be normal.
In trading, a Z-score is used to determine how often a trading system may produce a string of winners or losers. It can help a trader to understand whether the losses or profits they see are something that the system would most likely produce, or if it's a once in a blue moon situation. This helps traders make decisions about when to start or stop a system.
I just wanted to play a bit with the Z-score I guess.
Feel free to share your findings if you discover additional applications for this strategy or identify timeframes where it appears to perform more optimally.
How it works:
This strategy is based on a statistical concept called Z-score, which measures the number of standard deviations a data point is from the mean. In other words, it helps determine how unusual or usual a data point is.
In the context of this strategy, Z-score is applied to a 10-period EMA (Exponential Moving Average) of Heikin-Ashi candlestick close prices. The Z-score is calculated over a look-back period of 25 bars.
The EMA of the Z-score is then calculated over a 20-bar period, and the upper and lower thresholds (bounds for buy and sell signals) are defined using the 90th and 10th percentiles of this EMA score.
Long positions are taken when the Z-score crosses above the lower threshold or crosses above the mid-line (50th percentile). An additional long entry is made when the Z-score crosses above the highest value the EMA has been in the past 100 periods.
Short positions are initiated when the EMA crosses below the upper threshold, lower threshold or the highest value the EMA has been in the past 100 periods.
Positions are closed when opposing entry conditions are met, for example, a long position is closed when the short entry condition is true, and vice versa.
Set your desired start date for the strategy. This can be modified in the timestamp("YYYY MM DD") function at the top of the script.

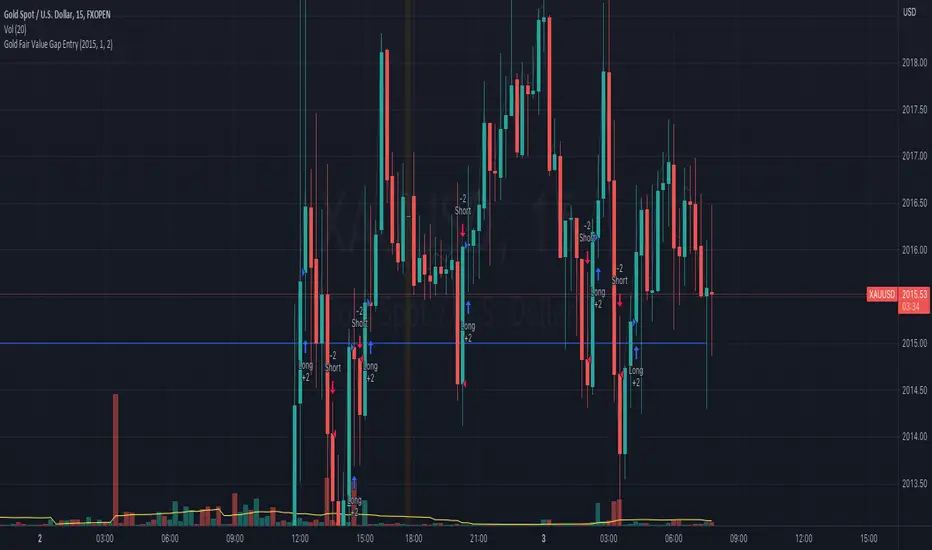
Gold Fair Value Gap Entry(FVG GOLD)This script calculates the fair value of gold, which is set as an input parameter. It then gets the current price of gold and calculates the gap between the price and the fair value. If the gap is positive, it enters a long trade, and if it's negative, it enters a short trade.
The script also uses proper risk management techniques by setting a stop loss and take profit for each trade. The plot() function is used to display the fair value and gap on the chart.
Please note that this is just an example script, and you should customize it based on your specific trading strategy and criteria. It's also important to backtest your strategy and refine it before using it with real money.
[SPOILED]SuperTrench - ETH Super ScalperHi Traders,
I'm republishing this script as I finally polished it to perfection IMO. The script uses 5 coding sections: entry, trend filter, pivot filter, take profit, and stop loss. The script mainly uses trailing as take profit; this is probably the easiest way to make a profitable scalper strategy.
Backtest capital is set to 1000 USDT, 35% equity, 0.04% commission, limited backtest date from Jan 2022 to now, backtested on ETH/USDT prep contracts 15m timeframe, result as shown below.
It looks unreal right? Hell no, I actually tested this strategy on Binance from Dec 06 to Dec 10. I got 8.29% return with 4x leverage, 50% equity setup; 75% win rate,1.58 profit factor, with 4.3% max drawdown, it is amazingly close to the backtest result.
User Manual
Entry >>> Stoch RSI:
I added 5 MA types to the Stoch RSI which is HMA/VWMA/WMA/EMA/SMA, HMA with Length setting of 5, 8 seems to be most efficient, VWMA and WMA with 8, 13 will generate less entry signals but with less entry risks.
Entry >>> R Style:
It based on price action, with candlestick makes a U turn, after 2nd candlestick confirmed, it generates entry signal, this will give you some extra entries, better leave it enabled.
Entry >>> Price Step:
This probably is the core feature of this strategy; also my secret ingredient to making this strategy this efficient. It is recommended to enable step 1-5, more steps basically means more entries, but they are not necessarily profitable.
Trend Filter >>> Price Step:
I couldn't tell you much details about how this indicator works, but it is a reliable indicator, based on price action, and I got some ideas from Demark9 indicator. The bigger the level, the stronger the filter is, please note that if 'Price Step Entries' less than Price Step Trend, entries will be ignored.
Pivot Filter >>> RSI Pivot & Pinbar Pivot:
RSI Pivot detects if the RSI signal line making U turn in certain condition, Pinbar detection combines R Style entry when price action U turn took place, these 2 pivot filter will close the trade once it is counter trend, so it better enable and leave it as is.
Trend Filter >>> Trend Magic:
Trend Magic uses CCI and ATR to calculate trend status, green means uptrend, red means downtrend, pretty straight forward, the best value for this indicator would be, 21, 34, 55, 89.
Trend Filter >>> Alpha:
This filter combines R style pivot, price step, EMA all together to detects consolidation area, because EMA was involved, so the best look back period would be around 15-35, it is best to use default value IMO, in another hands, if you need stronger filter, feel free to use 10, 18, 20, 25, 30, 35, make sure look back period should increase or decrease by 5 every time.
Take Profit and Stop Loss:
The default value for tp is set to 0.4%, but I also give you option to switch to ATR TP; you can adjust in the ATR multiplier, default ATR trailing stop loss uses 1 ATR, but you can adjust it for better drawdown tolerance. Fixed ATR SL is also given when fixed ATR is enabled. There will be a failsafe SL default set to 1% if price moves counter direction of opened position, it will close trade no matter what happens.
Enjoy :)

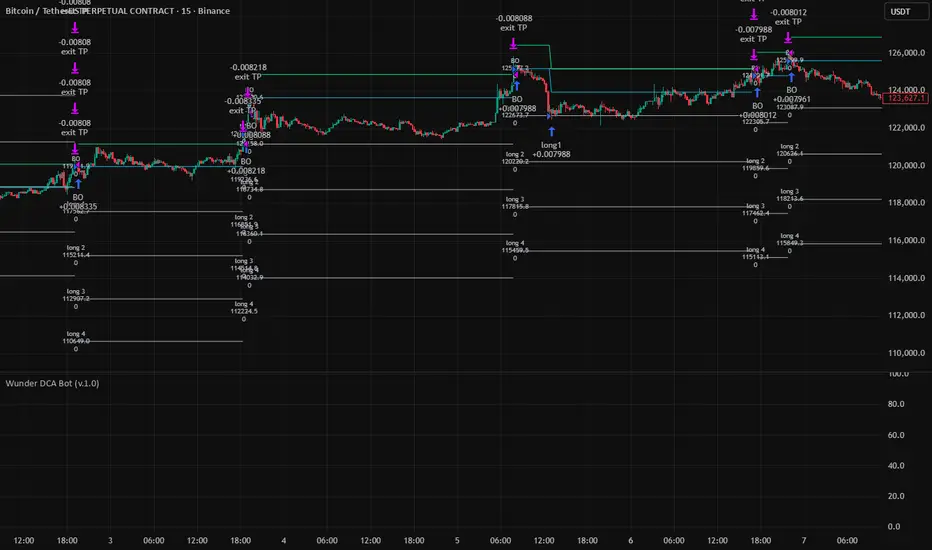
Wunder DCA BotThe bot is based on the DCA system.
1. DCA is the investment method in which you buy a certain portion of the asset after the determined price deviation.
2. For entry, we evaluate the maximum and minimum levels for a given period that you can adjust in the script. The bot enters when price rebound from the specified levels.
3. For the exit, the bot will use the take profit percentage that you will specify in settings.
It is also possible to choose how the take profit is calculated either from the average entry price or from the entry order (first order).
4. DCA uses the following settings:
- Base order Volume: Volume of your first order on entry signal
- Subsequent orders volume: The volume of all subsequent orders except the first
- DCA orders count: This parameter will determine how many entries your overall strategy will have. For example: If you will put 3, that will mean that including your initial position you will have 2 additional orders.
- DCA order price deviation:
This is the value in % which determines the deviation of the additional entries from the entry price. Example: If you go long and the price of the asset is 100$ and you put an order price deviation of 1% that will mean that the first additional entry will occur when the price will drop by 1%, and the second entry will be triggered when the overall price will drop by 2% (as the interval between the first and the second additional entry will be 1%).
- DCA Order Volume Multiplier:
This parameter will determine the amount that you put into each additional position. If this parameter is equal to 1 that means that each additional entry will be equal to the initial amount. The extra volume will be added to your position from the second DCA entry. Example: Your initial position was 10$ and your Volume Multiplier is set to 2. When you reach your 1st DCA target your additional order will have the same volume of 10$. When you reach your 2nd DCA target your additional order will be 20$ (previous position volume * multiplier). Your 3rd DCA target will place the order of 40$.
- DCA order price Deviation Multiplier:
This value will increase the price deviation between each additional entry. It is calculated as the price deviation multiplied by the deviation multiplier. For example: if you enter long at the price 100$ and have a price deviation of 1% with the price deviation multiplier of 2 that will mean that the first additional entry will occur when the price will drop to 99$ however the second will occur when the price will go to 97$. The third additional position will be entered at 94$
5. For full automation of the bot, you should set your comments to the input in the bot settings in the "LONG" and "SHORT" fields. You also need to create an alert signal and set a Webhook to send signals.
IMPORTANT!!!
1. Position calculation should take into account several factors: your deposit, leverage, the number of DCA orders, the distance to the last DCA order;
2. When choosing leverage, it is important to correctly calculate the possible drawdown. If you set a high leverage value, then liquidation awaits and the bot will not be able to take profits and will exit the position ahead of time;
3. The size of the position must be determined in accordance with all risks and take into account the size of your deposit;
4. This DCA Bot is able to earn consistently with the correct calculated money management.
EHMA Range Index Basket StrategyThis script is a modified version of my EHMA Range Strategy.
EHMA Range Strategy
In addition to the EHMA, this script works with a range around the EHMA (which can be modified), in an attempt to be robust against fake signals. Many times a bar will close below a moving average, only to reverse again the next bar, which eats away at your profits. Especially on shorter timeframes, but also on choppy longer timeframes this can make a strategy unattractive to use.
With the range around the EHMA, the strategy only enters a long/exit-short position if a bar crosses above the upper range. Vice versa, it only enters a short/exit-long position if a bar crosses below the lower range. This avoids positions if bars behave choppy within the EHMA range & only enters a position if the market is confident in it's direction. Having said that, fakeouts are still possible, but a lot less frequent. Having backtested this strategy vs the regular EHMA strategy (and having experimented with various settings), this version seems to be a lot more robust & profitable!
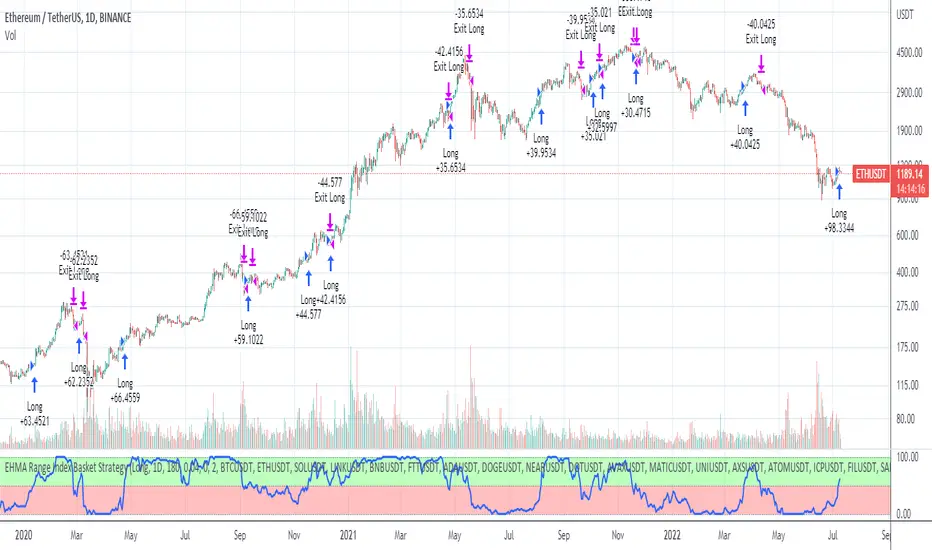
EHMA Range Index Basket Strategy
The EHMA Range Index Basket Strategy aims to make the EHMA Range Strategy even more robust, by taking nearly 40 of the most traded crypto trading pairs and applying the EHMA Range Strategy to them. For each pair it assigns a 0 (Sell signal) or 1 (Buy signal) and adds them up. If the number of Buy signals outweigh the number of Sell signals, the index strategy triggers its Buy signal (and vice versa). The results are even more profitable & robust than with the EHMA Range Strategy on its own. Next to that, it performs a lot better on most crypto pairs, due to it's robustness. Because of that, this strategy is a lot less prone to overfitting and will likely produce better results during live trading conditions!
Disclaimer
Please remember that past performance may not be indicative of future results.
Due to various factors, including changing market conditions, the strategy may no longer perform as good as in historical backtesting.
This post and the script don’t provide any financial advice.
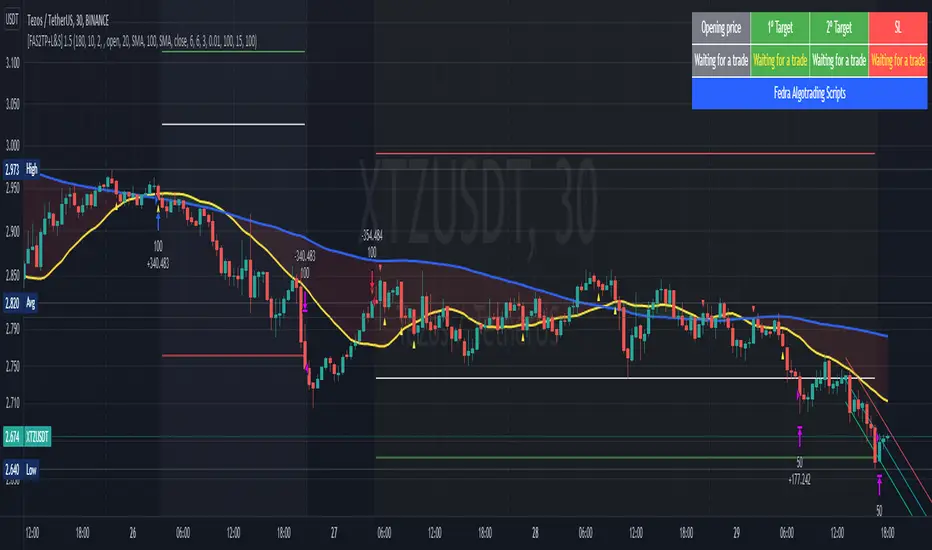
[Fedra Algotrading Strategy 2tp+L&S] Futures Long or ShortStrategy for crypto market, designed for automatic algorithmic trading with bots.
Can place long and short orders
Calculates your entries based on the breakout of the simple deviation of the linear regression of the last X periods.
Configures TP (green line) and SL (red line) percentages, the TP is a trailing TP.
Optionally, you can set a first TP (white line) that sells half of the position.
Advanced trend filter to not open trades against the market. SMA (yellow line), WMA (blue line) and secret sauce
Includes an advanced system to control the backtest period (choose how many days to backtest).
Risk management by volume of capital or amount of losing trades (kill switches that will exit the trade and stop the script)
The script includes default commissions of 0.2% per trade (configurable).
- Dinamic table with Price positions to plan your limit orders if you are trading manually
- Highly customizable and optimizable.
If you want to trade longs and shorts, it is advisable to create 2 different alerts. In most cases, the optimal parameters for longs are not the same as for shorts. In a forthcoming update I will enable separate configurations.
For better performance the script uses real time price information, for this reason Tradingview may warn you that there is "repainting", as the backtest information does not contain the information of each tick but only the open, close, high and low values of each candle.
To avoid this, you can disable the "calculate on every tick" option from the strategy settings panel.
Plutus - StrategyPlutus is a Script I've been working on for the past several months, and It's finally ready to go live! I would like to have few volunteers to help me forward-test it with different assets, preferably, with any Binance Perpetual contract traded under US$50.
The Script is delivering a Net PnL of circa 350% (0.04% commission deducted from the ~500% gross) in 14 days on the backtest when plotted on the WAVESUSDTPERP 2-min chart. Good results also with RUNEUSDTPERP and OGNUSDTPERP .
To whomever contributes with a constructive (technical) feedback, a better Stop-Loss strategy, other potential (Binance Futures ) pairs where the Script would delivery a 15-Day PnL of 400%+, and MAINLY who collaborate fowardtesting it, I'll grant access to the Strategy (which will have its Privacy Setting changed from Public to Private in 7 days from now) for a period of 2 months.
Please, explored it with different time frames, assets, markets and leave your comments!
Thanks a lot!
PS.: Tomorrow I'll write a better description.

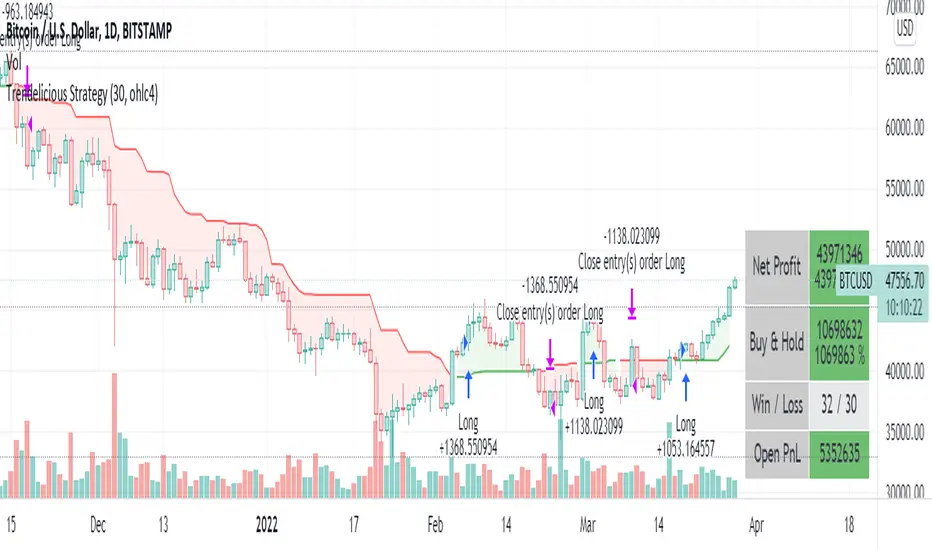
Trendelicious StrategyA simple strategy based on Trendelicious indicator
We go long when an uptrend started 2 candles ago.
We close the position when an uptrend ended 2 candles ago.
Parameters are just the required parameters for the indicator + backtest timeframe
To avoid the noise and catch big uptrends, run on higher timeframes (4h, 1D ...)
The script also contains a code to show some stats suitable when on a mobile device.
DISCLAIMER:
This is not an advice to trade. Use at your own risk.
The author of this script cannot be held responsible for any losses incurred directly or indirectly by the usage of this strategy.
Ultimate Ichimoku Cloud StrategyThe goal of this strategy script is to provide the ultimate experience to anyone interested in the Ichimoku Kinkō Hyō (Ichimoku Cloud). The script is designed to be highly customizable and allows the user to set a custom trade date range and select any combination of inputs and conditions that satisfy their goals. Additionally, the script allows the user to visually see any combination of their set conditions by clicking the " Show Conditions Visually " checkbox. Doing so will color the background in a different color where the conditions align. Finally, a simple Stop/Take profit is added for those that wish to exit based on percentages over Ichimoku conditions.
As always, please let me know if there are any bugs, something useful that could be added or if you need some help. Leave a like if you wish!
TENKAN BOLTTENKAN BOLT
7 major point in this indicator are as follows :-
•Tenkan-sen
•Ichimoku Cloud
•Exponential Moving Average
•Change of Volume Analysis (calculated in background)
•Modified Keltner Channel (calculated in background)
•RSI Divergence (calculated in background)
•Entry and Exit Point
www.tradingview.com
There will be 2 types of Long entry alert and 2 types of Short entry alert.
•The first one is marked as "Long" or "Short" only which indicates the signal calculated by Keltner Channel, Tenkan-sen and change of volume in sudden time.
•The second one is marked as "Long Divergence" and "Short Divergence" which indicates signal by RSI Divergence in my own way (not aggressive).
The idea of this script is only trade the highest probability setup and I shall call it the "High Probability, Probability Trading". This is definitely not a buy or sell call as the idea of the script is to give a good direction for trader and to learn the high probability trading setup which includes the volatility of the market.
This script specifically created for Futures Crude Palm OIL (FCPO) market and may works differently in different market. It works great in 1 minute time-frame and 3 minute time-frame
(with slight adjustment).
Kindly contact me for usage. Thanks!

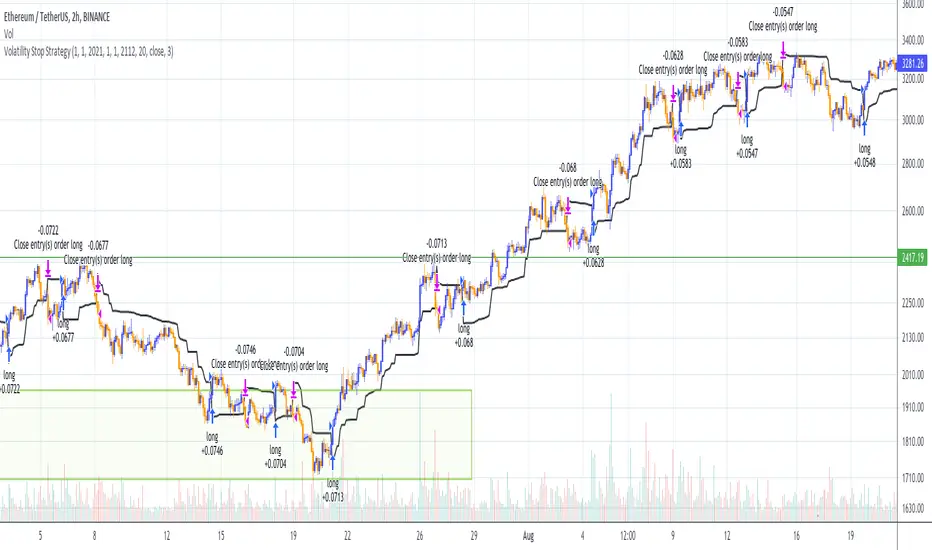
Volatility Stop Strategy (by Coinrule)Traders often use the volatility stop to protect trades dynamically, adjusting the stop price gradually based on the asset's volatility.
Just like the volatility stop is a great way to capture trend reversals on the downside, the opposite applies as well. Therefore, another useful application of the volatility stop is to add it to a trading system to signal potential trend reversals to catch a good buy opportunity.
ENTRY
- When the price crosses above the Volatility Stop
EXIT
- When the price crosses below the Volatility Stop
For this strategy, the Volatility stop's multiplier is set to 3 to allow more flexibility to the trade. The strategy is designed for medium-term trades.
Based on the backtest result from a sample of crypto trading pairs, the most profitable time frame is the 2-hr.
The strategy works well with both crypto-to-crypto and crypto-to-fiat pairs. To make results more realistic, a trading fee of 0.1% is added to the script. The fee is aligned to the base fee applied on Binance.
Bagheri IG Ether v2In this version, the winning ratio has been decreased, but the Risk to Reward Ratio (RRR) has been set to be better than the previous version.
This is a technical trading strategy for Ethereum ( BINANCE:ETHUSDT ). We built and developed it on MetaEditor and optimized it with MetaTrader optimizer.
The main indicators are Donchian Channel, Oscillator of ROC , Bears Power, Balance of Power , and Simple Moving Average ( SMA ). Default values in the input panel are the best combination of these indicators, but you can change any of them and try it for better results.
Please notice that this strategy has been optimized on the 1-minute chart of Ethereum .
For each position, you can see the Take Profit (TP) and Stop Loss (SL) levels. Also, you can find the values of mentioned TP and SL in points from the input panel of the script.
Attention: The price of Ethereum has 2 decimal places.
Therefore, 3000 points for TP means 30 USDT for trading 1 BINANCE:ETHUSDT .

Bagheri IG EtherThis is a technical trading strategy for Ethereum ( BINANCE:ETHUSDT ). We built and developed it on MetaEditor and optimized it with MetaTrader optimizer.
The main indicators are Donchian Channel, Oscillator of ROC, Bears Power, Balance of Power, and Simple Moving Average (SMA). Default values in the input panel are the best combination of these indicators, but you can change any of them and try it for better results.
Please notice that this strategy has been optimized on the 1-minute chart of Ethereum.
For each position, you can see the Take Profit (TP) and Stop Loss (SL) levels. Also, you can find the values of mentioned TP and SL in points from the input panel of the script.
Attention: The price of Ethereum has 2 decimal places.
Therefore, 3000 points for TP means 30 USDT for trading 1 BINANCE:ETHUSDT .

(IK) Base Break BuyThis strategy first calculates areas of support (bases), and then enters trades if that support is broken. The idea is to profit off of retracement. Dollar-cost-averaging safety orders are key here. This strategy takes into account a .1% commission, and tests are done with an initial capital of 100.00 USD. This only goes long.
The strategy is highly customizable. I've set the default values to suit ETH/USD 15m. If you're trading this on another ticker or timeframe, make sure to play around with the settings. There is an explanation of each input in the script comments. I found this to be profitable across most 'common sense' values for settings, but tweaking led to some pretty promising results. I leaned more towards high risk/high trade volume.
Always remember though: historical performance is no guarantee of future behavior . Keep settings within your personal risk tolerance, even if it promises better profit. Anyone can write a 100% profitable script if they assume price always eventually goes up.
Check the script comments for more details, but, briefly, you can customize:
-How many bases to keep track of at once
-How those bases are calculated
-What defines a 'base break'
-Order amounts
-Safety order count
-Stop loss
Here's the basic algorithm:
-Identify support.
--Have previous candles found bottoms in the same area of the current candle bottom?
--Is this support unique enough from other areas of support?
-Determine if support is broken.
--Has the price crossed under support quickly and with certainty?
-Enter trade with a percentage of initial capital.
-Execute safety orders if price continues to drop.
-Exit trade at profit target or stop loss.
Take profit is dynamic and calculated on order entry. The bigger the 'break', the higher your take profit percentage. This target percentage is based on average position size, so as safety orders are filled, and average position size comes down, the target profit becomes easier to reach.
Stop loss can be calculated one of two ways, either a static level based on initial entry, or a dynamic level based on average position size. If you use the latter (default), be aware, your real losses will be greater than your stated stop loss percentage . For example:
-stop loss = 15%, capital = 100.00, safety order threshold = 10%
-you buy $50 worth of shares at $1 - price average is $1
-you safety $25 worth of shares at $0.9 - price average is $0.966
-you safety $25 worth of shares at $0.8. - price average is $0.925
-you get stopped out at 0.925 * (1-.15) = $0.78625, and you're left with $78.62.
This is a realized loss of ~21.4% with a stop loss set to 15%. The larger your safety order threshold, the larger your real loss in comparison to your stop loss percentage, and vice versa.
Indicator plots show the calculated bases in white. The closest base below price is yellow. If that base is broken, it turns purple. Once a trade is entered, profit target is shown in silver and stop loss in red.

Donchian Channels Trending Breakout StrategyThis script looks for two entry signals. Long is when the previous breakout of the donchian channels was a low, price is above the input EMA, current price is equal or higher than the upper band and we're not in a position yet. Short is the other way around, so previous breakout of the donchian channels was a high, price is below the input EMA, current price is equal or lower than the lower band.
I haven't found a script that does take the previous highs and lows into consideration. Works for any markets in any conditions because the stop loss and profit targets are based on the upper and lower band of the donchian channels, which means the stop loss and profit targets move with the trend.
For more details see the script itself, I wrote a ton of comments.
