[astropark] Super Stochastic RSI [strategy]Dear Followers,
today a new Scalper Tool , which works great on 3 minutes and 5 minutes timeframes !
I called it " Super Stochastic RSI ", as it is based on StochRSI and inherits some basic functionality from it.
If you check its settings, you will see that you can have 3 different buy-sell sources (first two are active by default):
STRONG BUY/SELL : buy when green area deeply falls into oversold zone and sell when red area gets into overbought zone (you can set and edit at which level oversold and overbought zones start);
K/D CROSSES : buy when k-line cross above d-line and sell viceversa (you can set and edit specific cross ranges for both buy and sell);
WEAK BUY/SELL : buy when green area at least go below 50 level and sell when red area at least goes above 50 level (you can edit both levels); these conditions are highlighted as background color and are very useful for taking (at least partial) profits in trades.
By default the script will be placed as oscillator on a specific pane below the chart, but
> you can disable the oscillator plot by enabling the "hide all plot" option
> and place it as overlay on chart by clicking on the black arrow at then end on the indicator name in chart and selecting "move to -> existing pane above"
This strategy can trigger till 10 buy or 10 sell signals in a row before reverting, so use a proper money management .
Strategy results are calculated on 20 trading days using 1000$ as initial capital and working at 10x leverage.
The user who wants to use this strategy, especially via an automated bot, must always set a stoploss at 3-5% from entry point or use a proper risk management strategy .
This is not the "Holy Grail", so use it with caution.
This script will let you backtest the strategy and find best settings for your preferred market.
The alarms script version of this indicator, which will let you set all notifications you may need in order to be alerted on each triggered signals, can be found here below:
This is a premium indicator , so send me a private message in order to get access to this script .
Pesquisar nos scripts por "the script"

[Strategy]-=The Script=- On Fire - Leverage EditionStrategy version of =The Scrip=- On Fire - Leverage Edition
Back-test period starts 01-01-2018
The settings used
• Strategy Period 3h and Chart Period 7 minute
DISCLAIMER:
The creators of these script are not financial advisors, and as such, this script is not financial advice. Anything seen or used within this script is here simply for educational purposes and it is up to you to decide what to do with this information and results. Please do your own research and verify any outcome made before deciding to act upon them. Do not commit any of your own resources to any trading or cryptocurrency activities without first verifying the accuracy of the information and know that your decisions are your own.

Chart Formation DetectionThis script is designed to recognise a chart formation that is bullish. However, the script is optimised to default as using a very accurate formation.
This script works best on the 1-15 minute time frames. Anything higher is subject to macroeconomic events as apposed to high-frequency-trading algorithms which we are relying on in order for this script to work.
This seems to work very well on certain instruments as apposed to others(e.g. gold seems to work better than the US30). You will find what you like the best and develop your own uses for these indicators.

GMAE Original (By Kevin Manrrique)This script is called GMAE Original by me (Kevin Manrrique). I'm publishing this to the public because we are all traders and we need to support each other as a TVcommunity. This is something I built for fun. This script uses a series of EMA's. NO REPAINT, NO LAGGING! It works better for short-term trends as you can see. Please leave the copyright on the script at all times even if you rebuild it. If you need any help or have questions please inbox me privately. If you interested in joining up and building an indicator or strategy please inbox me as well. Thank you and I hope you enjoy this script as much as I do.
Remember there are no holy grails. The only holy grail there is are indicators built together to stop faulty signals and be as accurate as possible and this is one of them.
Sincerely,
Kevin Manrrique

Gold Smart Scalper V3 - Clean ChartOverview
The Gold Smart Scalper V3 is a trend-following momentum strategy specifically optimized for XAU/USD (Gold). It focuses on catching "value pullbacks" within a strong trend, avoiding the noise of sideways markets. Unlike many scalpers that use lagging indicators for exits, this version uses fixed ATR-based targets to lock in profits during high-volatility moves common in Gold.
Core Methodology
The strategy operates on three layers of confirmation:
Macro Trend (HTF Filter): Uses a 50-period EMA to ensure trades are only taken in the direction of the higher-timeframe momentum.
The Value Zone: Instead of "chasing" green or red candles, the script waits for a pullback to the space between the 9 EMA and 21 EMA. This ensures a better risk-to-reward entry point.
The Trigger: A trade is only executed when price confirms the resumption of the trend by crossing back over the signal EMA after the pullback.
Key Features
Fixed Profit Targets: Replaced dynamic trailing stops with fixed Take Profit (TP) and Stop Loss (SL) levels based on ATR, ensuring exits aren't "hunted" by Gold's signature volatility spikes.
C lean Chart Interface : All moving average plots are hidden. The only visuals provided are the active TP/SL levels when a trade is live, keeping your workspace clutter-free.
Single-Trade Logic: The script includes a "One Trade Per Cross" gate, preventing the strategy from over-trading or "stacking" positions during choppy price action.
Settings & OptimizationATR Multipliers :
Stop Loss (SL): Default $2.0 \times ATR$. Protects against standard market noise.Take Profit (TP): Default $3.0 \times ATR$. Designed for a high Risk/Reward profile.Timeframe Recommendation: Optimized for 15m and 1H for swing scalping, or 5m for aggressive scalping.Instrument: Specifically tuned for Gold (XAU/USD), but applicable to other high-volatility pairs like GBP/JPY or NASDAQ.
Disclaimer
This script is for educational and backtesting purposes only. Past performance does not guarantee future results. Always practice proper risk management.

Nifty_2MIN_ Rangereversal_Long _StrategySummary
This strategy is an intraday trend-following system designed for the Nifty index on a 2-minute timeframe. It focuses exclusively on long entries, seeking to identify high-probability recovery points within an established uptrend.
Concept & Core Logic
The strategy identifies entries based on a confluence of trend direction, price recovery levels, and specific candlestick patterns:
Trend Confirmation: The script utilizes the slope and positioning of the 20-period and 200-period Exponential Moving Averages (EMA). A long signal is only considered when the trend is determined to be positive, ensuring trades align with the broader market momentum.
Recovery Zone Filtering: To avoid buying at local peaks, the strategy filters for entries that occur when the market has retraced but is showing signs of recovery. Specifically, it looks for price to be within the 35% to 75% recovery range relative to the day's high.
Candlestick Trigger: The actual entry trigger is a "Bullish Reversal" sequence:
Two consecutive bearish candles (representing a minor pullback).
Followed immediately by a strong bullish candle (representing the resumption of strength).
Risk Management
The strategy uses fixed point-based exits to maintain a disciplined approach:
Take Profit: 30 points (underlying Nifty price).
Stop Loss: 35 points (underlying Nifty price).
Intended Use
This script is designed for traders interested in mechanical trend-following systems. It provides a structured way to observe how moving average slopes and specific price action sequences interact during intraday recoveries.
Disclaimer: This script is for educational and informational purposes only. It is not financial advice. All trading involves risk, and past performance is not indicative of future results. Please conduct your own research and backtesting before making any trading decisions.

Dhanesh_CustomTrendlineLogicUsed framma in getting the trades.
You can also define the custom horizontal and an inclined trendline breaking of which can trigger the trade. Enjoy the script.
RastaRasta — Educational Strategy (Pine v5)
Momentum · Smoothing · Trend Study
Overview
The Rasta Strategy is a visual and educational framework designed to help traders study momentum transitions using the interaction between a fast-reacting EMA line and a slower smoothed reference line.
It is not a signal generator or profit system; it’s a learning tool for understanding how smoothing, crossovers, and filters interact under different market conditions.
The script displays:
A primary EMA line (the fast reactive wave).
A Smoothed line (using your chosen smoothing method).
Optional fog zones between them for quick visual context.
Optional DNA rungs connecting both lines to illustrate volatility compression and expansion.
Optional EMA 8 / EMA 21 trend filter to observe higher-time-frame alignment.
Core Idea
The Rasta model focuses on wave interaction. When the fast EMA crosses above the smoothed line, it reflects a shift in short-term momentum relative to background trend pressure. Cross-unders suggest weakening or reversal.
Rather than treating this as a trading “signal,” use it to observe structure, study trend alignment, and test how smoothing type affects reaction speed.
Smoothing Types Explained
The script lets you experiment with multiple smoothing techniques:
Type Description Use Case
SMA (Simple Moving Average) Arithmetic mean of the last n values. Smooth and steady, but slower. Trend-following studies; filters noise on higher time frames.
EMA (Exponential Moving Average) Weights recent data more. Responds faster to new price action. Momentum or reactive strategies; quick shifts and reversals.
RMA (Relative Moving Average) Used internally by RSI; smooths exponentially but slower than EMA. Momentum confirmation; balanced response.
WMA (Weighted Moving Average) Linear weights emphasizing the most recent data strongly. Intraday scalping; crisp but potentially noisy.
None Disables smoothing; uses the EMA line alone. Raw comparison baseline.
Each smoothing method changes how early or late the strategy reacts:
Faster smoothing (EMA/WMA) = more responsive, good for scalping.
Slower smoothing (SMA/RMA) = more stable, good for trend following.
Modes of Study
🔹 Scalper Mode
Use short EMA lengths (e.g., 3–5) and fast smoothing (EMA or WMA).
Focus on 1 min – 15 min charts.
Watch how quick crossovers appear near local tops/bottoms.
Fog and rung compression reveal volatility contraction before bursts.
Goal: study short-term rhythm and liquidity pulses.
🔹 Momentum Mode
Use moderate EMA (5–9) and RMA smoothing.
Ideal for 1 H–4 H charts.
Observe how the fog color aligns with trend shifts.
EMA 8 / 21 filter can act as macro bias; “Enter” labels will appear only in its direction when enabled.
Goal: study sustained motion between pullbacks and acceleration waves.
🔹 Trend-Follower Mode
Use longer EMA (13–21) with SMA smoothing.
Great for daily/weekly charts.
Focus on periods where fog stays unbroken for long stretches — these illustrate clear trend dominance.
Watch rung spacing: tight clusters often precede consolidations; wide rungs signal expanding volatility.
Goal: visualize slow-motion trend transitions and filter whipsaw conditions.
Components
EMA Line (Red): Fast-reacting short-term direction.
Smoothed Line (Yellow): Reference trend baseline.
Fog Zone: Green when EMA > Smoothed (up-momentum), red when below.
DNA Rungs: Thin connectors showing volatility structure.
EMA 8 / 21 Filter (optional):
When enabled, the strategy will only allow Enter events if EMA 8 > EMA 21.
Use this to study higher-trend gating effects.
Educational Applications
Momentum Visualization: Observe how the fast EMA “breathes” around the smoothed baseline.
Trend Transitions: Compare different smoothing types to see how early or late reversals are detected.
Noise Filtering: Experiment with fog opacity and smoothing lengths to understand trade-off between responsiveness and stability.
Risk Concept Simulation: Includes a simple fixed stop-loss parameter (default 13%) for educational demonstrations of position management in the Strategy Tester.
How to Use
Add to Chart → “Strategy.”
Works on any timeframe and instrument.
Adjust Parameters:
Length: base EMA speed.
Smoothing Type: choose SMA, EMA, RMA, or WMA.
Smoothing Length: controls delay and smoothness.
EMA 8 / 21 Filter: toggles trend gating.
Fog & Rungs: visual study options only.
Study Behavior:
Use Strategy Tester → List of Trades for entry/exit context.
Observe how different smoothing types affect early vs. late “Enter” points.
Compare trend periods vs. ranging periods to evaluate efficiency.
Combine with External Tools:
Overlay RSI, MACD, or Volume for deeper correlation analysis.
Use replay mode to visualize crossovers in live sequence.
Interpreting the Labels
Enter: Marks where fast EMA crosses above the smoothed line (or when filter flips positive).
Exit: Marks where fast EMA crosses back below.
These are purely analytical markers — they do not represent trade advice.
Educational Value
The Rasta framework helps learners explore:
Reaction time differences between moving-average algorithms.
Impact of smoothing on signal clarity.
Interaction of local and global trends.
Visualization of volatility contraction (tight DNA rungs) and expansion (wide fog zones).
It’s a sandbox for studying price structure, not a promise of profit.
Disclaimer
This script is provided for educational and research purposes only.
It does not constitute financial advice, trading signals, or performance guarantees. Past market behavior does not predict future outcomes.
Users are encouraged to experiment responsibly, record observations, and develop their own understanding of price behavior.
Author: Michael Culpepper (mikeyc747)
License: Educational / Open for study and modification with credit.
Philosophy:
“Learning the rhythm of the market is more valuable than chasing its profits.” — Rasta

SMC Adaptive Breakout v1XSMC Adaptive Breakout v1X — Adaptive Smart Money Breakout Strategy
SMC Adaptive Breakout v1X is a Smart-Money–inspired breakout strategy that adapts to changing volatility and market structure in real time. It identifies recent pivot structure, verifies volatility expansion, uses ATR-scaled stops, and manages exits with fixed profit targets plus price-based trailing.
Why this strategy is unique / original
This strategy combines three concept layers into a single, cohesive system: (1) structure detection using adaptive pivots, (2) a normalized volatility filter (range percentile over a long lookback) to permit only expansion-phase breakouts, and (3) context-aware trade management using ATR-scaled stops and percentage-based profit/ trailing rules. The combination reduces false breakouts during low-volatility periods while preserving entries when institutional-style expansion occurs.
Core logic (high level)
1. Structure detection: recent pivot highs and lows (configurable lookback) form the active Support and Resistance reference levels used to define breakouts.
2. Volatility confirmation: raw bar range is normalized into a percentile within a long volatility lookback window; breakouts are only considered when normalized volatility exceeds the user filter threshold.
3. Order-block / gap detection: the script detects large price gaps relative to ATR(200) and flags them as bullish/bearish gaps (order-block style footprints) to add confluence to entries.
4. Entry criteria: a long entry is signalled when price closes above the most recent resistance and the volatility filter is satisfied (or a bullish gap condition is met). Shorts mirror this logic below support. Debug/force flags allow manual/backtest forcing of trades.
5. Risk & exits: stops are ATR-based (ATR length configurable, multiplier configurable) giving context-aware stop distances. Each entry sets a profit target as a percent of entry and attaches a trailing exit (points and offset defined as percent of price) to protect profits. Exits are placed with one strategy.exit per entry so they are executed by the strategy engine.
6. Non-premature confirmation: entries are determined using closed-bar conditions (no intrabar triggers), consistent with strategy backtesting expectations.
Key inputs (and what they control)
1. Levels Period (length) — pivot lookback used to compute support/resistance structure; larger values = larger, fewer zones.
2. Volatility Filter (filter 0–100) — normalized volatility threshold (percentile) required to allow breakout signals. Increase to reduce signals during quiet markets.
3. Volatility lookback (volatility_len) — window length used to normalize the raw range into a percentile.
4. ATR length (atr_len) & ATR Stop Multiplier (atr_multiplier) — ATR parameters used for stop distance; ATR gives volatility-adaptive stop sizing.
5. Profit target (%) — target as percent of entry price.
6. Trailing points (%) & offset (%) — trailing stop size and activation offset, expressed as percent of price (converted internally to price points).
7. Visual & debug toggles — show/hide levels, entry markers, and enable debug/force entry flags for manual/backtest validation.
Practical Usage & Recommended Settings
Timeframes – Works efficiently across multiple time horizons.
• 5–15 minutes → Scalping setups.
• 15 minutes–1 hour → Intraday opportunities.
• 4 hours–1 day → Swing trading confirmation.
Adjust length and Volatility Filter parameters to match your timeframe and instrument behavior.
Default Sensitivity –
The default length = 20 offers balanced structure detection.
• Lower values → faster, more frequent signals.
• Higher values → smoother structure and fewer breakouts.
Volatility Tuning –
Modify the Volatility Filter (0–100) according to market conditions.
• Increase the filter during low-volume or choppy sessions to reduce false signals.
• Decrease it during trending or high-volatility markets for greater responsiveness.
Stop / Target Sizing –
ATR-based stop-losses automatically adapt to market volatility.
• Recommended starting point: ATR Multiplier = 1.5 and Profit Target = 1.5%.
• Fine-tune both based on each asset’s typical volatility profile.
Backtesting –
Use TradingView’s built-in Strategy Tester to analyze results over different symbols and timeframes.
The strategy executes only on bar close, ensuring accurate, non-repainting backtest results.
What the strategy plots / visual cues
•Forward-extended pivot lines for support/resistance (configurable color/transparency).
•Order-block / gap markers when large ATR-scaled gaps are detected.
•Entry labels (“LONG” / “SHORT”) at position changes if enabled.
•Strategy entries/exits are placed through strategy.entry and strategy.exit so performance reports are available in the Tester.
Risk management & notes
•This script is a discretionary tool — it automates entries and exits for backtesting and strategy simulation, but users should still confirm trades with broader market context and higher-timeframe bias.
•Always run thorough backtests (multi-symbol, multi-timeframe) and forward test on a paper account before any live deployment.
•Adjust position sizing externally; the strategy code sets orders and exits but does not enforce a specific money-management sizing rule. Use the strategy tester’s default position size controls or integrate a sizing method in your own workflow.
Technical details & behavior
•Pine Script v6 strategy.
•Uses closed-bar confirmation for signals (no repainting on close).
•Order-block / gap detection uses ATR(200) as a volatility reference to identify large structural gaps.
•Trail calculations convert percent-based inputs to absolute price units each bar to maintain consistent behavior across price levels.
Limitations & disclaimers
•Past performance is not indicative of future results. This strategy does not guarantee profits and will produce losing trades.
•Results depend on parameter choices, instrument volatility, market regime, and execution slippage. Always test on the exact symbol and timeframe you intend to trade.
Invite-only / Access note (for Publish window)
This strategy is invite-only. Please use the TradingView Request Access button on this page to request access.

v2.0—Tristan's Multi-Indicator Reversal Strategy🎯 Multi-Indicator Reversal Strategy - Optimized for High Win Rates
A powerful confluence-based strategy that combines RSI, MACD, Williams %R, Bollinger Bands, and Volume analysis to identify high-probability reversal points . Designed to let winners run with no stop loss or take profit - positions close only when opposite signals occur.
Also, the 3 hour timeframe works VERY well—just a lot less trades.
📈 Proven Performance
This strategy has been backtested and optimized on multiple blue-chip stocks with 80-90%+ win rates on 1-hour timeframes from Aug 2025 through Oct 2025:
✅ V (Visa) - Payment processor
✅ MSFT (Microsoft) - Large-cap tech
✅ WMT (Walmart) - Retail leader
✅ IWM (Russell 2000 ETF) - Small-cap index
✅ NOW (ServiceNow) - Enterprise software
✅ WM (Waste Management) - Industrial services
These stocks tend to mean-revert at extremes, making them ideal candidates for this reversal-based approach. I only list these as a way to show you the performance of the script. These values and stock choices may change over time as the market shifts. Keep testing!
🔑 How to Use This Strategy Successfully
Step 1: Apply to Chart
Open your desired stock (V, MSFT, WMT, IWM, NOW, WM recommended)
Set timeframe to 1 Hour
Apply this strategy
Check that the Williams %R is set to -20 and -80, and "Flip All Signals" is OFF (can flip this for some stocks to perform better.)
Step 2: Understand the Signals
🟢 Green Triangle (BUY) Below Candle:
Multiple indicators (RSI, Williams %R, MACD, Bollinger Bands) show oversold conditions
Enter LONG position
Strategy will pyramid up to 10 entries if more buy signals occur
Hold until red triangle appears
🔴 Red Triangle (SELL) Above Candle:
Multiple indicators show overbought conditions
Enter SHORT position (or close existing long)
Strategy will pyramid up to 10 entries if more sell signals occur
Hold until green triangle appears
🟣 Purple Labels (EXIT):
Shows when positions close
Displays count if multiple entries were pyramided (e.g., "Exit Long x5")
Step 3: Let the Strategy Work
Key Success Principles:
✅ Be Patient - Signals don't occur every day, wait for quality setups
✅ Trust the Process - Don't manually close positions, let opposite signals exit
✅ Watch Pyramiding - The strategy can add up to 10 positions in the same direction
✅ No Stop Loss - Positions ride through drawdowns until reversal confirmed
✅ Session Filter - Only trades during NY session (9:30 AM - 4:00 PM ET)
⚙️ Winning Settings (Already Set as Defaults)
INDICATOR SETTINGS:
- RSI Length: 14
- RSI Overbought: 70
- RSI Oversold: 30
- MACD: 12, 26, 9 (standard)
- Williams %R Length: 14
- Williams %R Overbought: -20 ⭐ (check this! And adjust to your liking)
- Williams %R Oversold: -80 ⭐ (check this! And adjust to your liking)
- Bollinger Bands: 20, 2.0
- Volume MA: 20 periods
- Volume Multiplier: 1.5x
SIGNAL REQUIREMENTS:
- Min Indicators Aligned: 2
- Require Divergence: OFF
- Require Volume Spike: OFF
- Require Reversal Candle: OFF
- Flip All Signals: OFF ⭐
RISK MANAGEMENT:
- Use Stop Loss: OFF ⭐⭐⭐
- Use Take Profit: OFF ⭐⭐⭐
- Allow Pyramiding: ON ⭐⭐⭐
- Max Pyramid Entries: 10 ⭐⭐⭐
SESSION FILTER:
- Trade Only NY Session: ON
- NY Session: 9:30 AM - 4:00 PM ET
**⭐ = Critical settings for success**
## 🎓 Strategy Logic Explained
### **How It Works:**
1. **Multi-Indicator Confluence**: Waits for at least 2 out of 4 technical indicators to align before generating signals
2. **Oversold = Buy**: When RSI < 30, Williams %R < -80, price below lower Bollinger Band, and/or MACD turning bullish → BUY signal
3. **Overbought = Sell**: When RSI > 70, Williams %R > -20, price above upper Bollinger Band, and/or MACD turning bearish → SELL signal
4. **Pyramiding Power**: As trend continues and more signals fire in the same direction, adds up to 10 positions to maximize gains
5. **Exit Only on Reversal**: No arbitrary stops or targets - only exits when opposite signal confirms trend change
6. **Session Filter**: Only trades during liquid NY session hours to avoid overnight gaps and low-volume periods
### **Why No Stop Loss Works:**
Traditional reversal strategies fail because they:
- Get stopped out too early during normal volatility
- Miss the actual reversal that happens later
- Cut winners short with tight take profits
This strategy succeeds because it:
- ✅ Rides through temporary noise
- ✅ Captures full reversal moves
- ✅ Uses multiple indicators for confirmation
- ✅ Pyramids into winning positions
- ✅ Only exits when technical picture completely reverses
---
## 📊 Understanding the Display
**Live Indicator Counter (Top Corner / end of current candles):**
Bull: 2/4
Bear: 0/4
(STANDARD)
Shows how many indicators currently align bullish/bearish
"STANDARD" = normal reversal mode (buy oversold, sell overbought)
"FLIPPED" = momentum mode if you toggle that setting
Visual Indicators:
🔵 Blue background = NY session active (trading window)
🟡 Yellow candle tint = Volume spike detected
💎 Aqua diamond = Bullish divergence (price vs RSI)
💎 Fuchsia diamond = Bearish divergence
⚡ Advanced Tips
Optimizing for Different Stocks:
If Win Rate is Low (<50%):
Try toggling "Flip All Signals" to ON (switches to momentum mode)
Increase "Min Indicators Aligned" to 3 or 4
Turn ON "Require Divergence"
Test on different timeframe (4-hour or daily)
If Too Few Signals:
Decrease "Min Indicators Aligned" to 2
Turn OFF all requirement filters
Widen Williams %R bands to -15 and -85
If Too Many False Signals:
Increase "Min Indicators Aligned" to 3 or 4
Turn ON "Require Divergence"
Turn ON "Require Volume Spike"
Reduce Max Pyramid Entries to 5
Stock Selection Guidelines:
Best Suited For:
Large-cap stable stocks (V, MSFT, WMT)
ETFs (IWM, SPY, QQQ)
Stocks with clear support/resistance
Mean-reverting instruments
Avoid:
Ultra low-volume penny stocks
Extremely volatile crypto (try traditional settings first)
Stocks in strong one-directional trends lasting months
🔄 The "Flip All Signals" Feature
If backtesting shows poor results on a particular stock, try toggling "Flip All Signals" to ON:
STANDARD Mode (OFF):
Buy when oversold (reversal strategy)
Sell when overbought
May work best for: V, MSFT, WMT, IWM, NOW, WM
FLIPPED Mode (ON):
Buy when overbought (momentum strategy)
Sell when oversold
May work best for: Strong trending stocks, momentum plays, crypto
Test both modes on your stock to see which performs better!
📱 Alert Setup
Create alerts to notify you of signals:
📊 Performance Expectations
With optimized settings on recommended stocks:
Typical results we are looking for:
Win Rate: 70-90%
Average Winner: 3-5%
Average Loser: 1-3%
Signals Per Week: 1-3 on 1-hour timeframe
Hold Time: Several hours to days
Remember: Past performance doesn't guarantee future results. Always use proper risk management.

ES cuhthis strategy uses laggard rsi to compute the best parameters to go long and tp at key levels. the overall trend strength within the rsi laggard indicator is what is used to automate the calculations within the script. enjoy and paramter optimize

Hilly 3.0 Advanced Crypto Scalping Strategy - 1 & 5 Min ChartsHow to Use
Copy the Code: Copy the script above.
Paste in TradingView: Open TradingView, go to the Pine Editor (bottom of the chart), paste the code, and click “Add to Chart.”
Check for Errors: Verify no errors appear in the Pine Editor console. The script uses Pine Script v5 (@version=5).
Select Timeframe:
1-Minute Chart: Use defaults (emaFastLen=7, emaSlowLen=14, rsiLen=10, rsiOverbought=80, rsiOversold=20, slPerc=0.5, tpPerc=1.0, useCandlePatterns=false, patternLookback=10).
5-Minute Chart: Adjust to emaFastLen=9, emaSlowLen=21, rsiLen=14, rsiOverbought=75, rsiOversold=25, slPerc=0.8, tpPerc=1.5, useCandlePatterns=true, patternLookback=10.
Apply to Chart: Use a liquid crypto pair (e.g., BTC/USDT, ETH/USDT on Binance or Coinbase).
Verify Signals:
Green “BUY” or “EMA BUY” labels and triangle-up arrows below candles for bullish signals (EMA crossovers, bullish engulfing, hammer, doji, morning star, three white soldiers, double bottom).
Red “SELL” or “EMA SELL” labels and triangle-down arrows above candles for bearish signals (EMA crossovers, bearish engulfing, shooting star, doji, evening star, three black crows, double top).
Green/red background highlights for signal candles.
Backtest: Use TradingView’s Strategy Tester to evaluate performance over 1–3 months, checking Net Profit, Win Rate, and Drawdown.
Demo Test: Run on a demo account to confirm signal visibility and performance before trading with real funds.

Hilly 2.0 Advanced Crypto Scalping Strategy - 1 & 5 Min ChartsHow to Use
Copy the Code: Copy the script above.
Paste in TradingView: Open TradingView, go to the Pine Editor (bottom of the chart), paste the code, and click “Add to Chart.”
Check for Errors: Verify no errors appear in the Pine Editor console. The script uses Pine Script v5 (@version=5).
Select Timeframe:
1-Minute Chart: Use defaults (emaFastLen=7, emaSlowLen=14, rsiLen=10, rsiOverbought=80, rsiOversold=20, slPerc=0.5, tpPerc=1.0, useCandlePatterns=false).
5-Minute Chart: Adjust to emaFastLen=9, emaSlowLen=21, rsiLen=14, rsiOverbought=75, rsiOversold=25, slPerc=0.8, tpPerc=1.5, useCandlePatterns=true.
Apply to Chart: Use a liquid crypto pair (e.g., BTC/USDT, ETH/USDT on Binance or Coinbase).
Verify Signals:
Green “BUY” or “EMA BUY” labels and triangle-up arrows below candles.
Red “SELL” or “EMA SELL” labels and triangle-down arrows above candles.
Green/red background highlights for signal candles.
Arrows use size.normal for consistent visibility.
Backtest: Use TradingView’s Strategy Tester to evaluate performance over 1–3 months, checking Net Profit, Win Rate, and Drawdown.
Demo Test: Run on a demo account to confirm signal visibility and performance before trading with real funds.

Signalgo Strategy ISignalgo Strategy I: Technical Overview
Signalgo Strategy I is a systematically engineered TradingView strategy script designed to automate, test, and manage trend-following trades using multi-timeframe price/volume logic, volatility-based targets, and multi-layered exit management. This summary covers its operational structure, user inputs, entry and exit methodology, unique technical features, and practical application.
Core Logic and Workflow
Multi-Timeframe Data Synthesis
User-Defined Timeframe: The user chooses a timeframe (e.g., 1H, 4H, 1D, etc.), on which all strategy signals are based.
Cross-Timeframe Inputs: The strategy imports closing price, volume, and Average True Range (ATR) for the selected interval, independently from the chart’s native timeframe, enabling robust multi-timeframe analysis.
Price Change & Volume Ratio: It calculates the percent change of price per bar and computes a volume ratio by comparing current volume to its 20-bar moving average—enabling detection of true “event” moves vs. normal market noise.
Hype Filtering
Anti-Hype Mechanism: An entry is automatically filtered out if abnormal high volume occurs without corresponding price movement, commonly observed during manipulation or announcement periods. This helps isolate genuine market-driven momentum.
User Inputs
Select Timeframe: Choose which interval drives signal generation.
Backtest Start Date: Specify from which date historical signals are included in the strategy (for precise backtests).
Take-Profit/Stop-Loss Configuration: Internally, risk levels are set as multiples of ATR and allow for three discrete profit targets.
Entry Logic
Trade Signal Criteria:
Price change magnitude in the current bar must exceed a fixed sensitivity threshold.
Volume for the bar must be significantly elevated compared to average, indicating meaningful participation.
Anti-hype check must not be triggered.
Bullish/Bearish Determination: If all conditions are met and price change direction is positive, a long signal triggers. If negative, a short signal triggers.
Signal Debouncing: Ensures a signal triggers only when a new condition emerges, avoiding duplicate entries on flat or choppy bars.
State Management: The script tracks whether an active long or short is open to avoid overlapping entries and to facilitate clean reversals.
Exit Strategy
Take-Profits: Three distinct profit targets (TP1, TP2, TP3) are calculated as fixed multiples of the ATR-based stop loss, adapting dynamically to volatility.
Reversals: If a buy signal appears while a short is open (or vice versa), the existing trade is closed and reversed in a single step.
Time-Based Exit: If, 49 bars after entry, the trade is in-profit but hasn’t reached TP1, it exits to avoid stagnation risk.
Adverse Move Exit: The position is force-closed if it suffers a 10% reversal from entry, acting as a catastrophic stop.
Visual Feedback: Each TP/SL/exit is plotted as a clear, color-coded line on the chart; no hidden logic is used.
Alerts: Built-in TradingView alert conditions allow automated notification for both entries and strategic exits.
Distinguishing Features vs. Traditional MA Strategies
Event-Based, Not Just Slope-Based: While classic moving average strategies enter trades on MA crossovers or slope changes, Signalgo Strategy I demands high-magnitude price and volume confirmation on the chosen timeframe.
Volume Filtering: Very few MA strategies independently filter for meaningful volume spikes.
Real Market Event Focus: The anti-hype filter differentiates organic market trends from manipulated “high-volume, no-move” sessions.
Three-Layer Exit Logic: Instead of a single trailing stop or fixed RR, this script manages three profit targets, time-based closures, and hard adverse thresholds.
Multi-Timeframe, Not Chart-Dependent: The “main” analytical interval can be set independently from the current chart, allowing for in-depth cross-timeframe backtests and system runs.
Reversal Handling: Automatic handling of signal reversals closes and flips positions precisely, reducing slippage and manual error.
Persistent State Tracking: Maintains variables tracking entry price, trade status, and target/stop levels independently of chart context.
Trading Application
Strategy Sandbox: Designed for robust backtesting, allowing users to simulate performance across historical data for any major asset or interval.
Active Risk Management: Trades are consistently managed for both fixed interval “stall” and significant loss, not just via trailing stops or fixed-day closes.
Alert Driven: Can power algorithmic trading bots or notify discretionary traders the moment a qualifying market event occurs.

System 0530 - Stoch RSI Strategy with ATR filterStrategy Description: System 0530 - Multi-Timeframe Stochastic RSI with ATR Filter
Overview:
This strategy, "System 0530," is designed to identify trading opportunities by leveraging the Stochastic RSI indicator across two different timeframes: a shorter timeframe for initial signal triggers (assumed to be the chart's current timeframe, e.g., 5-minute) and a longer timeframe (15-minute) for signal confirmation. It incorporates an ATR (Average True Range) filter to help ensure trades are taken during periods of adequate market volatility and includes a cooldown mechanism to prevent rapid, successive signals in the same direction. Trade exits are primarily handled by reversing signals.
How It Works:
1. Signal Initiation (e.g., 5-Minute Timeframe):
Long Signal Wait: A potential long entry is considered when the 5-minute Stochastic RSI %K line crosses above its %D line, AND the %K value at the time of the cross is at or below a user-defined oversold level (default: 30).
Short Signal Wait: A potential short entry is considered when the 5-minute Stochastic RSI %K line crosses below its %D line, AND the %K value at the time of the cross is at or above a user-defined overbought level (default: 70). When these conditions are met, the strategy enters a "waiting state" for confirmation from the 15-minute timeframe.
2. Signal Confirmation (15-Minute Timeframe):
Once in a waiting state, the strategy looks for confirmation on the 15-minute Stochastic RSI within a user-defined number of 5-minute bars (wait_window_5min_bars, default: 5 bars).
Long Confirmation:
The 15-minute Stochastic RSI %K must be greater than or equal to its %D line.
The 15-minute Stochastic RSI %K value must be below a user-defined threshold (stoch_15min_long_entry_level, default: 40).
Short Confirmation:
The 15-minute Stochastic RSI %K must be less than or equal to its %D line.
The 15-minute Stochastic RSI %K value must be above a user-defined threshold (stoch_15min_short_entry_level, default: 60).
3. Filters:
ATR Volatility Filter: If enabled, trades are only confirmed if the current ATR value (converted to ticks) is above a user-defined minimum threshold (min_atr_value_ticks). This helps to avoid taking signals during periods of very low market volatility. If the ATR condition is not met, the strategy continues to wait for the condition to be met within the confirmation window, provided other conditions still hold.
Signal Cooldown Filter: If enabled, after a signal is generated, the strategy will wait for a minimum number of bars (min_bars_between_signals) before allowing another signal in the same direction. This aims to reduce overtrading.
4. Entry and Exit Logic:
Entry: A strategy.entry() order is placed when all trigger, confirmation, and filter conditions are met.
Exit: This strategy primarily uses reversing signals for exits. For example, if a long position is open, a confirmed short signal will close the long position and open a new short position. There are no explicit take profit or stop loss orders programmed into this version of the script.
Key User-Adjustable Parameters:
Stochastic RSI Parameters: RSI Length, Stochastic RSI Length, %K Smoothing, %D Smoothing.
Signal Trigger & Confirmation:
5-minute %K trigger levels for long and short.
15-minute %K confirmation thresholds for long and short.
Wait window (in 5-minute bars) for 15-minute confirmation.
Filters:
Enable/disable and configure the Signal Cooldown filter (minimum bars between signals).
Enable/disable and configure the ATR Volatility filter (ATR period, minimum ATR value in ticks).
Strategy Parameters:
Leverage Multiplier (Note: This primarily affects theoretical position sizing for backtesting calculations in TradingView and does not simulate actual leveraged trading risks).
Recommendations for Users:
Thorough Backtesting: Test this strategy extensively on historical data for the instruments and timeframes you intend to trade.
Parameter Optimization: Experiment with different parameter settings to find what works best for your trading style and chosen markets. The default values are starting points and may not be optimal for all conditions.
Understand the Logic: Ensure you understand how each component (Stochastic RSI on different timeframes, ATR filter, cooldown) interacts to generate signals.
Risk Management: Since this version does not include explicit stop-loss orders, ensure you have a clear risk management plan in place if trading this strategy live. You might consider manually adding stop-loss orders through your broker or using TradingView's separate strategy order settings for stop-loss if applicable.
Disclaimer:
This strategy description is for informational purposes only and does not constitute financial advice. Past performance is not indicative of future results. Trading involves significant risk of loss. Always do your own research and understand the risks before trading.

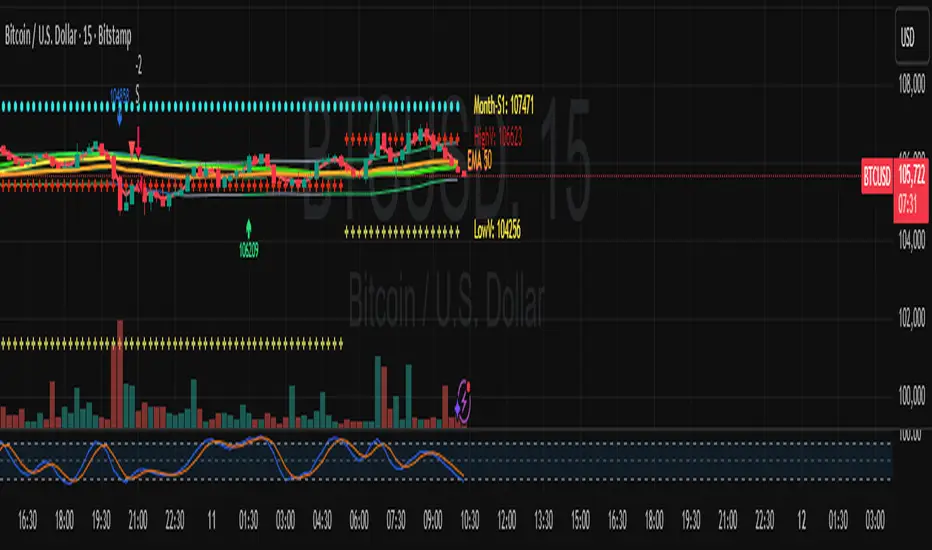
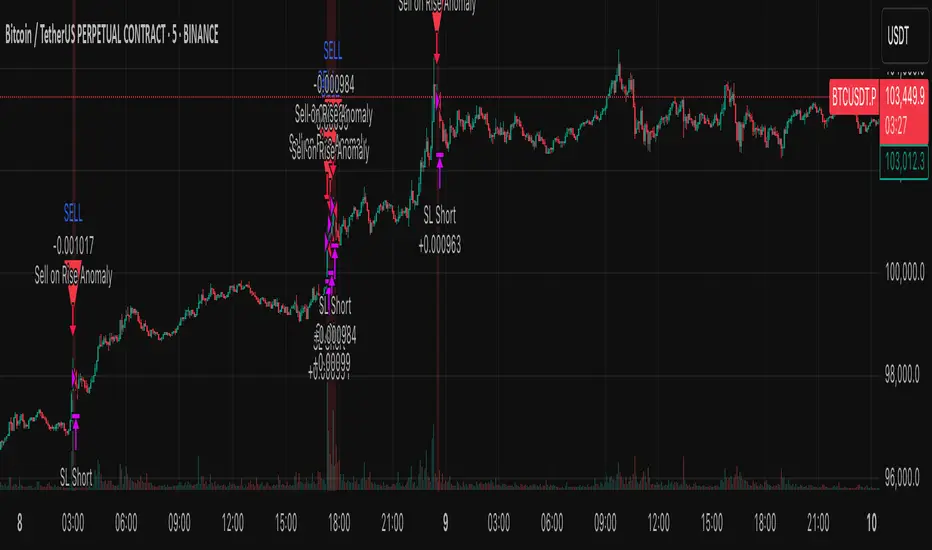
Anomaly Counter-Trend StrategyA mean-reversion style strategy that automatically spots unusually large price moves over a configurable lookback period and takes the opposite side, with full risk-management, commission and slippage modeling—built in Pine Script® v6.
🔎 Overview
ACTS monitors the percent-change over the past N minutes and, when that move exceeds your chosen threshold, enters a counter-trend position (short on a strong rise; long on a sharp fall). It’s ideal for markets that often “overshoot” and snap back, and can be applied on any symbol or timeframe.
⚙️ Key Features
Anomaly Detection: Detect abnormal price swings based on a user-defined % change over a lookback period.
Counter-Trend Entries: Auto-enter short on rise anomalies, long on fall anomalies (with seamless flat↔reverse transitions).
Risk Management: Configurable stop-loss and take-profit in ticks per trade.
Realistic Modeling: Simulates commissions (0.05 % default), slippage (2 ticks), and percent-of-equity sizing.
Immediate Bar-Close Execution: Orders processed on bar close for faster fills.
Visual Aids: Optional on-chart BUY/SELL triangles and background highlights during anomaly periods.
⚙️ Inputs
Input Default Description
Percentage Threshold (%) 2.00 Min % move over lookback to trigger an anomaly.
Lookback Period (Minutes) 15 Number of minutes over which to measure change.
Stop Loss (Ticks) 100 Distance from entry for stop-loss exit.
Take Profit (Ticks) 200 Distance from entry for take-profit exit.
Plot Trade Signal Shapes (on/off) true Show BUY/SELL triangles on chart.
Highlight Anomaly Background true Shade background during anomaly bars.
📊 How to Use
Add to Chart: Apply the script to any ticker & timeframe.
Tune: Adjust your percentage threshold and lookback to match each instrument’s volatility.
Review Backtest: Check built-in strategy performance (drawdown, Sharpe, etc.) under the Strategy Tester tab.
Go Live: Once optimized, link to alerts or your trade execution system.
⚠️ Disclaimer
This script is provided “as-is” for educational purposes and backtesting only. Past performance does not guarantee future results. Always backtest thoroughly, manage your own risk, and consider market conditions before live trading.
Enjoy experimenting—and may your counter-trend entries catch the next big snapback!
Breadth-Driven Swing StrategyWhat it does
This script trades the S&P 500 purely on market breadth extremes:
• Data source : INDEX:S5TH = % of S&P 500 stocks above their own 200-day SMA (range 0–100).
• Buy when breadth is washed-out.
• Sell when breadth is overheated.
It is long-only by design; shorting and ATR trailing stops have been removed to keep the logic minimal and transparent.
⸻
Signals in plain English
1. Long entry
A. A 200-EMA trough in breadth is printed and the trough value is ≤ 40 %.
or
B. A 5-EMA trough appears, its prominence passes the user threshold, and the lowest breadth reading in the last 20 bars is ≤ 20 %.
(Toggle this secondary trigger on/off with “ Enter also on 5-EMA trough ”.)
2. Exit (close long)
First 200-EMA peak whose breadth value is ≥ 70 %.
3. Risk control
A fixed stop-loss (% of entry price, default 8 %) is attached to every long trade.
⸻
Key parameters (defaults shown)
• Long EMA length 200 • Short EMA length 5
• Peak prominence 0.5 pct-pts • Trough prominence 3 pct-pts
• Peak level 70 % • Trough level 40 % • 5-EMA trough level 20 %
• Fixed stop-loss 8 %
• “Enter also on 5-EMA trough” = true (allows additional entries on extreme momentum reversals)
Feel free to tighten or relax any of these thresholds to match your risk profile or account for different market regimes.
⸻
How to use it
1. Load the script on a daily SPX / SPY chart.
(The price chart drives order execution; the breadth series is pulled internally and does not need to be on the chart.)
2. Verify the breadth feed.
INDEX:S5TH is updated after each session; your broker must provide it.
3. Back-test across several cycles.
Two decades of daily data is recommended to see how the rules behave in bear markets, range markets, and bull trends.
4. Adjust position sizing in the Properties tab.
The default is “100 % of equity”; change it if you prefer smaller allocations or pyramiding caps.
⸻
Why it can help
• Breadth signals often lead price, allowing entries before index-level momentum turns.
• Simple, rule-based exits prevent “waiting for confirmation” paralysis.
• Only one input series—easy to audit, no black-box math.
Trade-offs
• Relies on a single breadth metric; other internals (advance/decline, equal-weight returns, etc.) are ignored.
• May sit in cash during shallow pullbacks that never push breadth ≤ 40 %.
• Signals arrive at the end of the session (breadth is EoD data).
⸻
Disclaimer
This script is provided for educational purposes only and is not financial advice. Markets are risky; test thoroughly and use your own judgment before trading real money.
ストラテジー概要
本スクリプトは S&P500 のマーケットブレッド(内部需給) だけを手がかりに、指数をスイングトレードします。
• ブレッドデータ : INDEX:S5TH
(S&P500 採用銘柄のうち、それぞれの 200 日移動平均線を上回っている銘柄比率。0–100 %)
• 買い : ブレッドが極端に売られたタイミング。
• 売り : ブレッドが過熱状態に達したタイミング。
余計な機能を削り、ロングオンリー & 固定ストップ のシンプル設計にしています。
⸻
シグナルの流れ
1. ロングエントリー
• 条件 A : 200-EMA がトラフを付け、その値が 40 % 以下
• 条件 B : 5-EMA がトラフを付け、
・プロミネンス条件を満たし
・直近 20 本のブレッドス最小値が 20 % 以下
• B 条件は「5-EMA トラフでもエントリー」を ON にすると有効
2. ロング決済
最初に出現した 200-EMA ピーク で、かつ値が 70 % 以上 のバーで手仕舞い。
3. リスク管理
各トレードに 固定ストップ(初期価格から 8 %)を設定。
⸻
主なパラメータ(デフォルト値)
• 長期 EMA 長さ : 200 • 短期 EMA 長さ : 5
• ピーク判定プロミネンス : 0.5 %pt • トラフ判定プロミネンス : 3 %pt
• ピーク水準 : 70 % • トラフ水準 : 40 % • 5-EMA トラフ水準 : 20 %
• 固定ストップ : 8 %
• 「5-EMA トラフでもエントリー」 : ON
相場環境やリスク許容度に合わせて閾値を調整してください。
⸻
使い方
1. 日足の SPX / SPY チャート にスクリプトを適用。
2. ブレッドデータの供給 (INDEX:S5TH) がブローカーで利用可能か確認。
3. 20 年以上の期間でバックテスト し、強気相場・弱気相場・レンジ局面での挙動を確認。
4. 資金配分 は プロパティ → 戦略実行 で調整可能(初期値は「資金の 100 %」)。
⸻
強み
• ブレッドは 価格より先行 することが多く、天底を早期に捉えやすい。
• ルールベースの出口で「もう少し待とう」と迷わずに済む。
• 入力 series は 1 本のみ、ブラックボックス要素なし。
注意点・弱み
• 単一指標に依存。他の内部需給(A/D ライン等)は考慮しない。
• 40 % を割らない浅い押し目では機会損失が起こる。
• ブレッドは終値ベースの更新。ザラ場中の変化は捉えられない。
⸻
免責事項
本スクリプトは 学習目的 で提供しています。投資助言ではありません。
実取引の前に必ず自己責任で十分な検証とリスク管理を行ってください。

Price Flip StrategyPrice Flip Strategy with User-Defined Ticker Max/Max
This strategy leverages an inverted price calculation based on user-defined maximum and minimum price levels over customizable lookback periods. It generates buy and sell signals by comparing the previous bar's original price to the inverted price, within a specified date range. The script plots key metrics, including ticker max/min, original and inverted prices, moving averages, and HLCC4 averages, with customizable visibility toggles and labels for easy analysis.
Key Features:
Customizable Inputs: Set lookback periods for ticker max/min, moving average length, and date range for signal generation.
Inverted Price Logic: Calculates an inverted price using ticker max/min to identify trading opportunities.
Flexible Visualization: Toggle visibility for plots (e.g., ticker max/min, prices, moving averages, HLCC4 averages) and last-bar labels with user-defined colors and sizes.
Trading Signals: Generates buy signals when the previous original price exceeds the inverted price, and sell signals when it falls below, with alerts for real-time notifications.
Labeling: Displays values on the last bar for all plotted metrics, aiding in quick reference.
How to Use:
Add to Chart: Apply the script to a TradingView chart via the Pine Editor.
Configure Settings:
Date Range: Set the start and end dates to define the active trading period.
Ticker Levels: Adjust the lookback periods for calculating ticker max and min (e.g., 100 bars for max, 100 for min).
Moving Averages: Set the length for exponential moving averages (default: 20 bars).
Plots and Labels: Enable/disable specific plots (e.g., Inverted Price, Original HLCC4) and customize label colors/sizes for clarity.
Interpret Signals:
Buy Signal: Triggered when the previous close price is above the inverted price; marked with an upward label.
Sell Signal: Triggered when the previous close price is below the inverted price; marked with a downward label.
Set Alerts: Use the built-in alert conditions to receive notifications for buy/sell signals.
Analyze Plots: Review plotted lines (e.g., ticker max/min, HLCC4 averages) and last-bar labels to assess price behavior.
Tips:
Use in trending markets by enabling ticker max for uptrends or ticker min for downtrends, as indicated in tooltips.
Adjust the label offset to prevent overlapping text on the last bar.
Test the strategy on a demo account to optimize lookback periods and moving average settings for your asset.
Disclaimer: This script is for educational purposes and should be tested thoroughly before use in live trading. Past performance is not indicative of future results.

Vinicius Setup ATR
Description:
This script is a strategy based on the Supertrend indicator combined with volume analysis, candle strength, and RSI. Its goal is to identify potential entry points for buy and sell trades based on technical criteria, without promising profitability or guaranteed results.
Script Components:
Supertrend: Used as the main trend compass. When the trend is positive (direction = 1), buy signals are considered; when negative (direction = -1), sell signals are considered.
Volume: Entries are only validated if the volume is above the average of the last 20 candles, adjusted with a 1.2 multiplier.
Candle Body: The candle body must be larger than a certain percentage of the ATR, ensuring sufficient strength and volatility.
RSI: Used as a filter to avoid trades in extreme overbought or oversold zones.
Support and Resistance: Identified based on simple pivots (5 periods before and after).
Customizable Parameters:
ATR Length and Multiplier: Controls the sensitivity of the Supertrend.
RSI Period: Adjusts the relative strength filter.
Minimum Volume and Candle Body: Settings to validate entry signals.
Entry Conditions:
Buy: Positive trend + strong candle + high volume + RSI below 70.
Sell: Negative trend + strong candle + high volume + RSI above 30.
Exit Conditions:
The trade is closed upon the appearance of an opposite signal.
Notes:
This is a technical system with no profit guarantees.
It is recommended to test with realistic capital values and parameters suited to your risk management.
The script is not optimized for specific profitability, but rather to support study and the construction of setups with objective criteria.

Reversal & Breakout Strategy with ORB### Reversal & Breakout Strategy with ORB
This strategy combines three distinct trading approaches—reversals, trend breakouts, and opening range breakouts (ORB)—into a single, cohesive system. The goal is to capture high-probability setups across different market conditions, leveraging a mashup of technical indicators for confirmation and risk management. Below, I’ll explain why this combination works, how the components interact, and how to use it effectively.
#### Why the Mashup?
- **Reversals**: Identifies overextended moves using RSI (overbought/oversold) and SMA50 crosses, filtered by VWAP and SMA200 trend direction. This targets mean-reversion opportunities in trending markets.
- **Breakouts**: Uses EMA9/EMA20 crossovers with VWAP and SMA200 confirmation to catch momentum-driven trend continuations.
- **Opening Range Breakout (ORB)**: Detects early momentum by breaking the high/low of a user-defined opening range (default: 15 bars) with volume confirmation. This adds a time-based edge, ideal for intraday trading.
The synergy comes from blending these methods: reversals catch pullbacks, breakouts ride trends, and ORB exploits early volatility—all filtered by trend (SMA200) and anchored by VWAP for context.
#### How It Works
1. **Indicators**:
- **EMA9/EMA20**: Fast-moving averages for breakout signals.
- **SMA50**: Medium-term trend filter for reversals.
- **SMA200**: Long-term trend direction to align trades.
- **RSI (14)**: Measures overbought (>70) or oversold (<30) conditions.
- **VWAP**: Acts as a dynamic support/resistance level.
- **ATR (14)**: Sets stop-loss distance (default: 1.5x ATR).
- **Volume**: Confirms ORB breakouts (1.5x average volume of opening range).
2. **Entry Conditions**:
- **Long**: Triggers on reversal (SMA50 cross + RSI < 30 + below VWAP + uptrend), breakout (EMA9 > EMA20 + above VWAP + uptrend), or ORB (break above opening range high + volume).
- **Short**: Triggers on reversal (SMA50 cross + RSI > 70 + above VWAP + downtrend), breakout (EMA9 < EMA20 + below VWAP + downtrend), or ORB (break below opening range low + volume).
3. **Risk Management**:
- Risks 5% of equity per trade (based on the initial capital set in the strategy tester).
- Stop-loss: Based on lowest low/highest high over 7 bars ± 1.5x ATR.
- Targets: Two exits at 1:1 and 1:2 risk:reward (50% of position at each).
- Break-even: Stop moves to entry price after the first target is hit.
4. **Backtesting Settings**:
- Commission: Hardcoded at 0.1% per trade (realistic for most brokers).
- Slippage: Hardcoded at 2 ticks (realistic for most markets).
- Tested on datasets yielding 100+ trades (e.g., 2-min or 5-min charts over months).
#### How to Use It
- **Timeframe**: Works best on intraday (2-min, 5-min) or daily charts. Adjust `Opening Range Bars` (e.g., 15 bars = 30 min on 2-min chart) for your timeframe.
- **Settings**:
- Set your initial equity in the TradingView strategy tester’s "Properties" tab under "Initial Capital" (e.g., $10,000). The script automatically risks 5% of this equity per trade.
- Adjust `Stop Loss ATR Multiplier` or `Risk:Reward Targets` based on your risk tolerance.
- Note that commission (0.1%) and slippage (2 ticks) are fixed in the script for backtesting consistency.
- **Execution**: Enter on signal, monitor plotted stop (red) and targets (green/blue). The strategy supports pyramiding (up to 2 positions) for scaling into trends.
#### Backtesting Notes
Results are realistic with commission (0.1%) and slippage (2 ticks) included. For a sufficient sample, test on volatile instruments (e.g., stocks, forex) over 3-6 months on lower timeframes. The default 1.5x ATR stop may seem wide, but it’s justified to avoid premature exits in volatile markets—feel free to tweak it with justification. The script assumes an initial capital of $10,000 in the strategy tester for the 5% risk calculation (e.g., $500 risk per trade); adjust this in the "Properties" tab as needed.
This mashup isn’t just a random mix; it’s a deliberate fusion of complementary strategies, offering traders flexibility across market phases. Questions? Let me know!

RSI + Stochastic + WMA StrategyThis script is designed for TradingView and serves as a trading strategy (not just a visual indicator). It's intended for backtesting, strategy optimization, or live trading signal generation using a combination of popular technical indicators.
📊 Indicators Used in the Strategy:
Indicator Description
RSI (Relative Strength Index) Measures momentum; identifies overbought (>70) or oversold (<30) conditions.
Stochastic Oscillator (%K & %D) Detects momentum reversal points via crossovers. Useful for timing entries.
WMA (Weighted Moving Average) Identifies the trend direction (used as a trend filter).
📈 Trading Logic / Strategy Rules:
📌 Long Entry Condition (Buy Signal):
All 3 conditions must be true:
RSI is Oversold → RSI < 30
Stochastic Crossover Upward → %K crosses above %D
Price is above WMA → Confirms uptrend direction
👉 Interpretation: Market was oversold, momentum is turning up, and price confirms uptrend — bullish entry.
📌 Short Entry Condition (Sell Signal):
All 3 conditions must be true:
RSI is Overbought → RSI > 70
Stochastic Crossover Downward → %K crosses below %D
Price is below WMA → Confirms downtrend direction
👉 Interpretation: Market is overbought, momentum is turning down, and price confirms downtrend — bearish entry.
🔄 Strategy Execution (Backtesting Logic):
The script uses:
pinescript
Copy
Edit
strategy.entry("LONG", strategy.long)
strategy.entry("SHORT", strategy.short)
These are Pine Script functions to place buy and sell orders automatically when the above conditions are met. This allows you to:
Backtest the strategy
Measure win/loss ratio, drawdown, and profitability
Optimize indicator settings using TradingView Strategy Tester
📊 Visual Aids (Charts):
Plots WMA Line: Orange line for trend direction
Overbought/Oversold Zones: Horizontal lines at 70 (red) and 30 (green) for RSI visualization
⚡ Strategy Type Summary:
Category Setting
Strategy Type Momentum Reversal + Trend Filter
Timeframe Flexible (Works best on 1H, 4H, Daily)
Trading Style Swing/Intraday
Risk Profile Medium to High (due to momentum triggers)
Uses Leverage Possible (adjust risk accordingly)

Optimized Auto-Detect Strategy (MA, ATR, Trend, RSI) Overview
This script is designed for traders seeking a trend-following approach that adapts to different currency pairs (e.g., EURUSD, NZDUSD, XAUUSD). It combines moving average crossovers with ATR-based stops, optional trend filters, and RSI filters to help reduce false signals and capture larger moves.
Key Features
1. Auto-Detect Logic
- Automatically applies different moving average periods and ATR multipliers based on the symbol (e.g., XAUUSD, EURUSD, NZDUSD).
- Makes it easy to switch charts without manually adjusting parameters each time.
2. ATR-Based Stop
- Uses the Average True Range (ATR) to set dynamic stop-loss levels, adapting to each market’s volatility.
3. Optional Trend Filter
- Filters out trades if price is below the 200 SMA for longs (and above for shorts), aiming to avoid choppy, range-bound markets.
4. Optional RSI Filter
- Only enters long if RSI is above a certain threshold (e.g., 50), or short if below another threshold, reducing entries during low momentum.
5. Partial Exit & Trailing/Break-Even
- Locks in partial profit at a chosen R:R (e.g., 1:1), then either trails the remaining position or moves the stop to break-even.
- This helps capture additional gains if the trend extends beyond the initial target.
6. Customizable Parameters
- You can toggle on/off each filter (Trend, RSI) and adjust the ATR multiplier, MA periods, partial exit levels, etc.
- Allows easy optimization for different pairs or timeframes.
How to Use
1. Add to Chart: Click “Add to chart” in the Pine Editor.
2. Configure Inputs: In the script’s settings, toggle the filters you want (Trend Filter, RSI Filter, etc.) and set your desired ATR multiplier, RSI thresholds, partial exit ratio, etc.
3. Strategy Tester: Check the performance under the “Strategy Tester” tab. Adjust parameters if needed.
4. Realistic Settings: Consider adding spreads/commissions in the “Properties” tab for more accurate backtests, especially if you trade pairs with higher spreads (like XAUUSD).
Disclaimer
No Guarantee: This script does not guarantee profits. Markets are unpredictable, and results may vary with market conditions.
For Educational Purposes: Always do your own research and forward testing. Past performance does not indicate future results.

Strategy SuperTrend SDI WebhookThis Pine Script™ strategy is designed for automated trading in TradingView. It combines the SuperTrend indicator and Smoothed Directional Indicator (SDI) to generate buy and sell signals, with additional risk management features like stop loss, take profit, and trailing stop. The script also includes settings for leverage trading, equity-based position sizing, and webhook integration.
Key Features
1. Date-based Trade Execution
The strategy is active only between the start and end dates set by the user.
times ensures that trades occur only within this predefined time range.
2. Position Sizing and Leverage
Uses leverage trading to adjust position size dynamically based on initial equity.
The user can set leverage (leverage) and percentage of equity (usdprcnt).
The position size is calculated dynamically (initial_capital) based on account performance.
3. Take Profit, Stop Loss, and Trailing Stop
Take Profit (tp): Defines the target profit percentage.
Stop Loss (sl): Defines the maximum allowable loss per trade.
Trailing Stop (tr): Adjusts dynamically based on trade performance to lock in profits.
4. SuperTrend Indicator
SuperTrend (ta.supertrend) is used to determine the market trend.
If the price is above the SuperTrend line, it indicates an uptrend (bullish).
If the price is below the SuperTrend line, it signals a downtrend (bearish).
Plots visual indicators (green/red lines and circles) to show trend changes.
5. Smoothed Directional Indicator (SDI)
SDI helps to identify trend strength and momentum.
It calculates +DI (bullish strength) and -DI (bearish strength).
If +DI is higher than -DI, the market is considered bullish.
If -DI is higher than +DI, the market is considered bearish.
The background color changes based on the SDI signal.
6. Buy & Sell Conditions
Long Entry (Buy) Conditions:
SDI confirms an uptrend (+DI > -DI).
SuperTrend confirms an uptrend (price crosses above the SuperTrend line).
Short Entry (Sell) Conditions:
SDI confirms a downtrend (+DI < -DI).
SuperTrend confirms a downtrend (price crosses below the SuperTrend line).
Optionally, trades can be filtered using crossovers (occrs option).
7. Trade Execution and Exits
Market entries:
Long (strategy.entry("Long")) when conditions match.
Short (strategy.entry("Short")) when bearish conditions are met.
Trade exits:
Uses predefined take profit, stop loss, and trailing stop levels.
Positions are closed if the strategy is out of the valid time range.
Usage
Automated Trading Strategy:
Can be integrated with webhooks for automated execution on supported trading platforms.
Trend-Following Strategy:
Uses SuperTrend & SDI to identify trend direction and strength.
Risk-Managed Leverage Trading:
Supports position sizing, stop losses, and trailing stops.
Backtesting & Optimization:
Can be used for historical performance analysis before deploying live.
Conclusion
This strategy is suitable for traders who want to automate their trading using SuperTrend and SDI indicators. It incorporates risk management tools like stop loss, take profit, and trailing stop, making it adaptable for leverage trading. Traders can customize settings, conduct backtests, and integrate it with webhooks for real-time trade execution. 🚀
Important Note:
This script is provided for educational and template purposes and does not constitute financial advice. Traders and investors should conduct their research and analysis before making any trading decisions.
