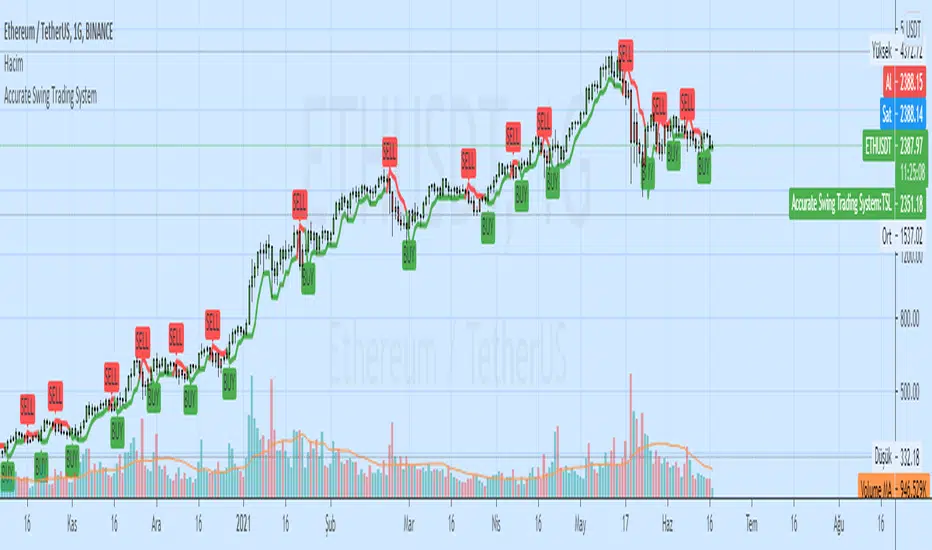
Swing Trading System v5 - Dynamic SL/Targets with LabelsThe Swing Trading System v5 is a fully-automated swing-trend framework designed to identify high-confidence breakout entries, generate dynamic stop-loss and target levels, and visually label actionable trade zones on the chart.
It adapts to market conditions using structure breaks, EMA trend filters, candle confirmation, and volume expansion signals.
Core Features
1. Swing Breakout Engine (Structure-Based)
The system detects short-term swing highs/lows and evaluates whether price has broken out above resistance or broken down below support.
A directional bias is established using a structure-based confirmation variable and automatically updated trailing stop logic.
2. Trend Filter (EMA 20/50/200)
To avoid counter-trend trades, the engine uses:
EMA-200 for primary trend direction
EMA-20 and EMA-50 for near-term momentum
Signals align only when structure breaks AND the major trend confirm each other.
3. Candle Confirmation
Entry signals require classical reversal momentum patterns:
Bullish Engulfing for long trades
Bearish Engulfing for short trades
This filters out weak structure breaks and ensures institutional momentum.
4. Volume Confirmation
Volume must exceed a configurable SMA-based threshold.
This prevents false signals during low-liquidity or consolidation phases.
Signal Logic
Long Signal Triggers
A Buy signal is printed when:
Price crosses above the dynamic trailing stop (swing resistance)
Price is above EMA-200 (bull trend)
Candle forms a bullish engulfing confirmation
Volume > SMA(10) × Multiplier
Short Signal Triggers
A Sell signal occurs when:
Price crosses below the dynamic trailing stop (swing support)
Price is below EMA-200 (bear trend)
Candle forms a bearish engulfing confirmation
Volume expansion confirms downside momentum
Dynamic Stop-Loss & Profit Targets
When a signal triggers, the system automatically calculates:
Stop-Loss (SL):
Long trades: last swing low
Short trades: last swing high
Target 1 (TP1): 1.5R relative to swing distance
Target 2 (TP2): 3.0R for trend continuation moves
SL, TP1, and TP2 are displayed on-chart using extended line plots and right-side labels for clean visualization.
Labels for old signals are automatically deleted to keep the chart uncluttered.
Visual Components
The indicator provides:
BUY/SELL signal labels
Dynamic SL, TP1, TP2 lines with color coding
SL/TP labels positioned at the end of each new trade
Clean breakout detection based on structural pivots
All elements update automatically as new swings form.
Intended Use
This system is built for:
Swing Traders
Systematic Discretionary Traders
Trend Followers
Breakout/Momentum Traders
Works well on:
Stocks
Crypto
Forex
Indices
Commodities
Optimal timeframes: 1H, 4H, Daily, Weekly
Summary
The Swing Trading System v5 provides:
High-quality breakout entries
Trend-aligned signals
Volume-filtered confirmation
Automated risk-reward generation
Clean and dynamic chart labels
A complete, self-contained swing-trading solution for systematic execution and disciplined risk management.
Pesquisar nos scripts por "swing trading"

Swing Trading Indicator: RSI + EMA + MACD + BB Signals**Swing Trading Indicator: Multi-Indicator Confluence Signals**
This indicator identifies high-probability swing trading setups using RSI pullbacks, EMA trend filter, MACD momentum confirmation, and Bollinger Bands for volatility-based entries. Perfect for daily/4H charts on stocks like TSLA or SPY.
**Key Features:**
- **Long Signal (Green ↑ Arrow)**: Uptrend (above 200 EMA) + RSI crosses above oversold (default 30) + MACD bullish crossover + Price at/near BB lower band + Optional squeeze filter.
- **Short Signal (Red ↓ Arrow)**: Mirror for downtrends.
- **Real-Time Dashboard**: Top-right table shows condition status (✓/✗) and "LONG/SHORT READY" alerts.
- **Customizable**: Adjust RSI levels, BB multiplier, enable/disable shorts/squeeze/arrows.
- **Alerts**: Built-in for entry notifications.
**How to Use:**
1. Add to chart (daily timeframe recommended).
2. Watch for arrows + "READY" in dashboard.
3. Manual entry: Risk 1% per trade, target 1:2 reward (e.g., trail stops).
**Backtest Note**: Based on similar setups, ~55-65% win rate in trending markets (test yourself). Not financial advice—trading involves risk. Fork and improve!
#swingtrading #RSI #MACD #BollingerBands #PineScript

Swing Trading IndicatorThis script is a swing‑trading dashboard designed for BTC, ETH, S&P 500 (for now). It combines weekly RSI, USDT.D, VIX, moving averages and Fisher Transform into a single visual tool, with background highlights, an on‑chart info table and ready‑made alerts to help you time high‑probability swing entries and manage risk.
1. Overview
The indicator is intended to work on daily timeframe.
Signals are context‑aware: BTC and ETH get USDT.D conditions, SPX gets VIX and EMA‑100 logic, and all non‑ETH symbols can also use Fisher Transform as a mean‑reversion filter.
2. Conditions and background highlights
Each component sets a boolean condition and, when active, paints a background layer:
Weekly RSI condition
True when weekly RSI is below its symbol‑specific threshold.
USDT.D conditions
BTC: triggered when USDT.D is above the user threshold and the chart symbol is BTC.
ETH: same logic for ETH, but tracked separately..
VIX condition (SPX only)
True when VIX high is at or above the VIX threshold while the chart is SPX.
EMA condition (BTC & SPX)
BTC: daily close below EMA‑200.
SPX: daily close below EMA‑100.
Fisher Transform condition (non‑ETH)
Fisher Transform on the chart timeframe, using the configured period.
True when Fisher value is below the Fisher threshold.
3. Intended use and notes
This indicator is designed as a confluence tool for swing traders, not a standalone buy/sell system. It works best on assets that are in a clear uptrend, where the main idea is to accumulate during corrections within that broader bullish structure.
During larger market shocks, deep corrections, or black‑swan events, trend‑based and mean‑reversion filters can produce false signals, because volatility and correlations often behave abnormally in those periods. For that reason, this script should always be combined with independent risk management, higher‑timeframe trend analysis, and your own discretion.

Swing Trading Indicators (Improved)This "Swing Trading Indicators" script is a sophisticated trading tool designed for traders who wants to use technical analysis for identifying optimal entry points, safeguarding profits, and protect their capital. With foundations loosely based on the momentum burst strategy by Pradeep Bonde, Kristjan Kullamaggie's trading methodologies, and incorporating automatic stop-losses based on Average Daily Range (ADR) and Average True Range (ATR), this script offers a comprehensive solution if you want to capitalize on short-term market movements.
Key Features:
Indicators and Moving Averages: Includes EMA (5, 10, 20, 50 days), SMA (200 days), and the highest and lowest prices over 200 days to provide a multifaceted view of market trends and momentum.
Thrust Indicator: Central to the script, the thrust indicator signals a buy point when a candlestick bar closes above the highs of the last two days, indicating a momentum burst. This feature is particularly inspired by Pradeep Bonde's 4% breakout strategy, highlighting the script's capability to identify range expansion and upward thrusts as key entry moments.
Automatic Stop-Levels: Utilizes ADR and ATR to set dynamic stop-losses, helping traders to manage risk effectively by adapting to market volatility.
Comprehensive Market Analysis : Through volume analysis, RSI, closing range, and other parameters, the script offers a deep dive into market dynamics, aiding in decision-making.
Who Should Use It:
This tool is ideal for swing traders and momentum traders focused on short to medium-term gains. Its robust set of features makes it suitable for those who prefer a data-driven approach to identify buying opportunities and manage risk.
Trading Style Compatibility:
The thrust indicator shines in momentum trading strategies, providing clear signals for entering trades ahead of potential price jumps. The integration of moving averages and volume analysis supports a variety of trading styles, including day trading and swing trading, by offering insights into trend strength and potential reversals.
How the Thrust Indicator Works:
When you see a thrust indicator (green upwards arrow below a candle) when the price is moving out of a consolidation or low volatility price-range , that's the buy point.
The thrust indicator is NOT indended as an indicator for long term positions or trend reversals, but for entries at a good price while capturing the first day of a potential 5-20% move in the coming 3-5 days.
The thrust indicator pinpoints moments when a stock shows a strong upward momentum, characterized by a candlestick closing above the highs of the preceding two days. This identifies a momentum burst, signaling an optimal entry point for traders looking to profit from a short-term price movement, typically ranging from 5-20% over the following 3-5 days. Such precision in identifying entry points is invaluable for traders focusing on capturing quick gains from market volatility.
"Top / Watch out" Indicator:
In addition to the script's core functionality, the "WatchOut" indicator plays a crucial role in identifying potential reversals after significant price movements. By analyzing conditions such as recent price increases compared to the average daily range, RSI levels, and the opening price distance from the EMA, the "WatchOut" indicator alerts traders to exercise caution. This feature is pivotal for those looking to avoid entering trades that might be on the verge of a pullback or reversal, enhancing the script's utility in managing risk.

Enhanced ShareGenius Swing TradingSwing Trading Strategy Features:
1. Point out candles where days low price matched 20 day low price (Blue Triangle with Yellow Bar)
2. Hollow Body candles depict days when days close is within the threshold of 20 day high (defaulted to 5%). An indication to start GTT buy orders.
3. Point out candles when GTT buy order was triggered (Light Green body)
Experimental:
1. Using tolerance to low price matching logic (instead of exact match)
As a result if the days low is within the tolerance, such candles will be highlighted with light blue triangle and yellow body

Nifty50 Swing Trading Super Indicator# 🚀 Nifty50 Swing Trading Super Indicator - Complete Guide
**Created by:** Gaurav
**Date:** August 8, 2025
**Version:** 1.0 - Optimized for Indian Markets
---
## 📋 Table of Contents
1. (#quick-start-guide)
2. (#indicator-overview)
3. (#installation-instructions)
4. (#parameter-settings)
5. (#signal-interpretation)
6. (#trading-strategy)
7. (#risk-management)
8. (#optimization-tips)
9. (#troubleshooting)
---
## 🎯 Quick Start Guide
### What You Get
✅ **2 Complete Pine Script Indicators:**
- `swing_trading_super_indicator.pine` - Universal version for all markets
- `nifty_optimized_super_indicator.pine` - Specifically optimized for Nifty50 & Indian stocks
✅ **Key Features:**
- Multi-component signal confirmation system
- Optimized for daily and 3-hour timeframes
- Built-in risk management with dynamic stops and targets
- Real-time signal strength monitoring
- Gap analysis for Indian market characteristics
### Immediate Setup
1. Copy the Pine Script code from `nifty_optimized_super_indicator.pine`
2. Paste into TradingView Pine Editor
3. Add to chart on daily or 3-hour timeframe
4. Look for 🚀BUY and 🔻SELL signals
5. Use the information table for signal confirmation
---
## 🔍 Indicator Overview
### Core Components Integration
**🎯 Range Filter (35% Weight)**
- Primary trend identification using adaptive volatility filtering
- Optimized sampling period: 21 bars for Indian market volatility
- Enhanced range multiplier: 3.0 to handle market gaps
- Provides trend direction and strength measurement
**⚡ PMAX (30% Weight)**
- Volatility-adjusted trend confirmation using ATR-based calculations
- Dynamic multiplier adjustment based on market volatility
- 14-period ATR with 2.5 multiplier for swing trading sensitivity
- Offers trailing stop functionality
**🏗️ Support/Resistance (20% Weight)**
- Dynamic level identification using pivot point analysis
- Tighter channel width (3%) for precise Indian market levels
- Enhanced strength calculation with historical interaction weighting
- Provides entry/exit timing and breakout signals
**📊 EMA Alignment (15% Weight)**
- Multi-timeframe moving average confirmation
- Key EMAs: 9, 21, 50, 200 (popular in Indian markets)
- Hierarchical alignment scoring for trend strength
- Additional trend validation layer
### Advanced Features
**🌅 Gap Analysis**
- Automatic detection of significant price gaps (>2%)
- Gap strength measurement and impact on signals
- Specific optimization for Indian market overnight gaps
- Visual gap markers on chart
**⏰ Multi-Timeframe Integration**
- Higher timeframe bias from daily/weekly data
- Configurable daily bias weight (default 70%)
- 3-hour confirmation for precise entry timing
- Prevents counter-trend trades against major timeframe
**🛡️ Risk Management**
- Dynamic stop-loss calculation using multiple methods
- Automatic profit target identification
- Position sizing guidance based on signal strength
- Anti-whipsaw logic to prevent false signals
---
## 📥 Installation Instructions
### Step 1: Access TradingView
1. Open TradingView.com
2. Navigate to Pine Editor (bottom panel)
3. Create a new indicator
### Step 2: Copy the Code
**For Nifty50 & Indian Stocks (Recommended):**
```pinescript
// Copy entire content from nifty_optimized_super_indicator.pine
```
**For Universal Use:**
```pinescript
// Copy entire content from swing_trading_super_indicator.pine
```
### Step 3: Configure and Apply
1. Click "Add to Chart"
2. Select daily or 3-hour timeframe
3. Adjust parameters if needed (defaults are optimized)
4. Enable alerts for signal notifications
### Step 4: Verify Installation
- Check that all components are visible
- Confirm information table appears in top-right
- Test with known trending stocks for signal validation
---
## ⚙️ Parameter Settings
### 🎯 Range Filter Settings
```
Sampling Period: 21 (optimized for Indian market volatility)
Range Multiplier: 3.0 (handles overnight gaps effectively)
Source: Close (most reliable for swing trading)
```
### ⚡ PMAX Settings
```
ATR Length: 14 (standard for daily/3H timeframes)
ATR Multiplier: 2.5 (balanced for swing trading sensitivity)
Moving Average Type: EMA (responsive to price changes)
MA Length: 14 (matches ATR period for consistency)
```
### 🏗️ Support/Resistance Settings
```
Pivot Period: 8 (shorter for Indian market dynamics)
Channel Width: 3% (tighter for precise levels)
Minimum Strength: 3 (higher quality levels only)
Maximum Levels: 4 (focus on strongest levels)
Lookback Period: 150 (sufficient historical data)
```
### 🚀 Super Indicator Settings
```
Signal Sensitivity: 0.65 (balanced for swing trading)
Trend Strength Requirement: 0.75 (high quality signals)
Gap Threshold: 2.0% (significant gap detection)
Daily Bias Weight: 0.7 (strong higher timeframe influence)
```
### 🎨 Display Options
```
Show Range Filter: ✅ (trend visualization)
Show PMAX: ✅ (trailing stops)
Show S/R Levels: ✅ (key price levels)
Show Key EMAs: ✅ (trend confirmation)
Show Signals: ✅ (buy/sell alerts)
Show Trend Background: ✅ (visual trend state)
Show Gap Markers: ✅ (gap identification)
```
---
## 📊 Signal Interpretation
### 🚀 BUY Signals
**Requirements for BUY Signal:**
- Price above Range Filter with upward trend
- PMAX showing bullish direction (MA > PMAX line)
- Support/resistance breakout or favorable positioning
- EMA alignment supporting upward movement
- Higher timeframe bias confirmation
- Overall signal strength > 75%
**Signal Strength Indicators:**
- **90-100%:** Extremely strong - Maximum position size
- **80-89%:** Very strong - Large position size
- **75-79%:** Strong - Standard position size
- **65-74%:** Moderate - Reduced position size
- **<65%:** Weak - Wait for better opportunity
### 🔻 SELL Signals
**Requirements for SELL Signal:**
- Price below Range Filter with downward trend
- PMAX showing bearish direction (MA < PMAX line)
- Resistance breakdown or unfavorable positioning
- EMA alignment supporting downward movement
- Higher timeframe bias confirmation
- Overall signal strength > 75%
### ⚖️ NEUTRAL Signals
**Characteristics:**
- Conflicting signals between components
- Low overall signal strength (<65%)
- Range-bound market conditions
- Wait for clearer directional bias
### 📈 Information Table Guide
**Component Status:**
- **BULL/BEAR:** Current signal direction
- **Strength %:** Component contribution strength
- **Status:** Additional context (STRONG/WEAK/ACTIVE/etc.)
**Overall Signal:**
- **🚀 STRONG BUY:** All systems aligned bullish
- **🔻 STRONG SELL:** All systems aligned bearish
- **⚖️ NEUTRAL:** Mixed or weak signals
---
## 💼 Trading Strategy
### Daily Timeframe Strategy
**Setup:**
1. Apply indicator to daily chart of Nifty50 or Indian stocks
2. Wait for 🚀BUY or 🔻SELL signal with >75% strength
3. Confirm higher timeframe bias alignment
4. Check for significant support/resistance levels
**Entry:**
- Enter on signal bar close or next bar open
- Use 3-hour chart for precise entry timing
- Avoid entries during major news events
- Consider gap analysis for overnight positions
**Position Sizing:**
- **>90% Strength:** 3-4% of portfolio
- **80-89% Strength:** 2-3% of portfolio
- **75-79% Strength:** 1-2% of portfolio
- **<75% Strength:** Avoid or minimal size
### 3-Hour Timeframe Strategy
**Setup:**
1. Confirm daily timeframe bias first
2. Apply indicator to 3-hour chart
3. Look for signals aligned with daily trend
4. Use for entry/exit timing optimization
**Entry Refinement:**
- Wait for 3H signal confirmation
- Enter on pullbacks to key levels
- Use tighter stops for better risk/reward
- Monitor intraday support/resistance
### Risk Management Rules
**Stop Loss Placement:**
1. **Primary:** Use indicator's dynamic stop level
2. **Secondary:** Below/above nearest support/resistance
3. **Maximum:** 2-3% of portfolio per trade
4. **Trailing:** Move stops with PMAX line
**Profit Taking:**
1. **Target 1:** First resistance/support level (50% position)
2. **Target 2:** Second resistance/support level (30% position)
3. **Runner:** Trail remaining 20% with PMAX
**Position Management:**
- Review positions at daily close
- Adjust stops based on new signals
- Exit if trend changes to opposite direction
- Reduce size during high volatility periods
---
## 🎯 Optimization Tips
### For Nifty50 Trading
- Use daily timeframe for primary signals
- Monitor sector rotation impact
- Consider index futures for better liquidity
- Watch for RBI policy and global cues impact
### For Individual Stocks
- Verify stock follows Nifty correlation
- Check sector-specific news and events
- Ensure adequate liquidity for position size
- Monitor earnings calendar for volatility
### Market Condition Adaptations
**Trending Markets:**
- Increase position sizes for strong signals
- Use wider stops to avoid whipsaws
- Focus on trend continuation signals
- Reduce counter-trend trading
**Range-Bound Markets:**
- Reduce position sizes
- Use tighter stops and quicker profits
- Focus on support/resistance bounces
- Increase signal strength requirements
**High Volatility Periods:**
- Reduce overall exposure
- Use smaller position sizes
- Increase stop-loss distances
- Wait for clearer signals
### Performance Monitoring
- Track win rate and average profit/loss
- Monitor signal quality over time
- Adjust parameters based on market changes
- Keep trading journal for pattern recognition
---
## 🔧 Troubleshooting
### Common Issues
**Q: Signals appear too frequently**
A: Increase "Trend Strength Requirement" to 0.8-0.9
**Q: Missing obvious trends**
A: Decrease "Signal Sensitivity" to 0.5-0.6
**Q: Too many false signals**
A: Enable "3H Confirmation" and increase strength requirements
**Q: Indicator not loading**
A: Check Pine Script version compatibility (requires v5)
### Parameter Adjustments
**For More Sensitive Signals:**
- Decrease Signal Sensitivity to 0.5-0.6
- Decrease Trend Strength Requirement to 0.6-0.7
- Increase Range Filter multiplier to 3.5-4.0
**For More Conservative Signals:**
- Increase Signal Sensitivity to 0.7-0.8
- Increase Trend Strength Requirement to 0.8-0.9
- Enable all confirmation features
### Performance Issues
- Reduce lookback periods if chart loads slowly
- Disable some visual elements for better performance
- Use on liquid stocks/indices for best results
---
## 📞 Support & Updates
This super indicator combines the best of Range Filter, PMAX, and Support/Resistance analysis specifically optimized for Indian market swing trading. The multi-component approach significantly improves signal quality while the built-in risk management features help protect capital.
**Remember:** No indicator is 100% accurate. Always combine with proper risk management, market analysis, and your trading experience for best results.
**Happy Trading! 🚀**

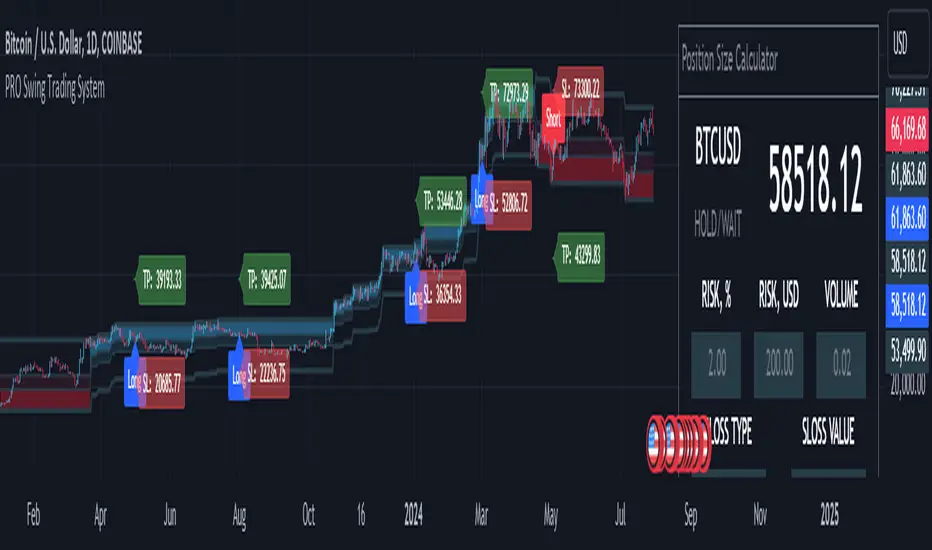
MQLSoftware - Pro Swing Trading SystemThe PRO Swing Trading System for TradingView is an advanced, fully integrated trading solution designed for traders who demand precision, versatility, and convenience in their trading strategies. Part of our Premium Collection, this system combines robust algorithms with hyper-customizable features to help traders effectively capitalize on market swings across various asset classes.
Our system embodies a comprehensive approach to trading, emphasizing risk management and capital preservation while maximizing trading efficiency. By seamlessly integrating risk management tools directly within the trading terminal, the PRO Swing Trading System eliminates the need for external spreadsheets or complex calculations, ensuring that traders can focus solely on executing their strategies. Every aspect of this system is designed to provide a streamlined, user-friendly experience where entry points, stop-loss levels, and take-profit targets are automatically calculated and displayed, allowing for rapid decision-making and execution.
KEY FEATURES
Advanced Trend Channels and Swing Levels
The PRO Swing Trading System features a unique, color-coded trend channel that visually adapts based on market trends. This channel helps traders identify optimal entry points by highlighting key swing levels for potential reversals or trend continuations. The system marks these levels on the chart as potential entry points for long or short positions, providing a clear visual cue for trading opportunities.
Comprehensive Signal and Trade Levels
Clear Stop-Loss and Take-Profit Levels: The system automatically marks stop-loss and take-profit levels on your charts, including absolute values to support informed decision-making. Traders can adjust these levels directly on the chart to match their trading style and risk tolerance, ensuring that risk management is always at the forefront of their trading strategy.
Dynamic Signal Adjustments: Customize your signals based on trend strength and market volatility to ensure you receive alerts that align with your specific trading strategies. This flexibility allows for a tailored trading experience that can adapt to various market conditions.
This image showcases a chart of BTC/USD on a one-hour timeframe. Here, we highlight the system's functionality, illustrating how different colors represent ascending and descending trends. The image includes features such as the Descending Channel, Extending Channel, Main Swing Level, Echo Swing Level, and Potential Entry points.
Additionally, it displays levels for managing profits and losses, such as Take Profit Levels and Stop Loss Level. The system allows setting either one or two take-profit levels for staged exit strategies. Traders can enter positions based on the Main Swing Level (primary entry point) or Echo Swing Level (secondary entry point), depending on their trading style or market conditions. This flexibility is useful for phased entry or if the primary entry opportunity is missed.
Integrated Position Size Calculator
Located in the top-right corner of the chart by default, the Position Size Calculator is a powerful tool that helps traders quickly determine the optimal trade size based on their risk settings. By integrating this calculator directly into the chart, traders can efficiently manage their trades with precision and confidence.
Configurable Risk Management: The calculator allows traders to set risk percentages, stop-loss types, and profit-to-loss ratios. It dynamically adjusts based on user inputs, optimizing trade volume and risk management to support a systematic trading approach.
This image presents a chart of ETH/USD on a 15-minute timeframe, clearly demonstrating the system’s ability to track trend changes accurately. The chart emphasizes the Position Size Calculator, part of the Risk Money Management Block. This panel allows users to set their risk (e.g., 2% of the deposit) and automatically calculates the appropriate position size. Absolute stop-loss and take-profit values are also calculated based on these settings, maintaining a consistent risk-reward ratio and supporting systematic trading.
Trend Strength Monitor
The Trend Strength Monitor is an essential tool for multi-timeframe analysis, helping traders identify the direction and strength of trends across higher timeframes. This feature aids in filtering out lower-probability trades, enhancing decision-making accuracy and ensuring that traders align their trades with the broader market trend.
This image features a chart of XAU/USD on an hourly timeframe, highlighting the Trend Strength Monitor. This tool helps traders understand the trend direction and strength across higher timeframes. The example shows that all higher timeframes indicate a buying zone, suggesting a safer long trade.
FILTERS AND SYSTEM USAGE
The indicator is equipped with a wide range of additional settings and filters that allow traders to adapt it to their specific needs and market conditions. Key features include:
Customizable Channel Width
The channel width is a crucial parameter that determines the indicator's adaptability to different market conditions. Traders can adjust the channel width to ensure the indicator responds quickly to market changes while remaining stable against false fluctuations. This flexibility is vital for trading in varying market conditions, such as ranging or trending markets.
Signal Frequency Control
This setting allows traders to control the frequency of signals generated by the system. By adjusting this parameter, traders can customize their trading approach to match their preferred style, whether it be a conservative, medium, or aggressive approach.
Alert and Notification Settings
The PRO Swing Trading System includes customizable alert settings to ensure traders are notified when key market conditions align with their strategy. Alerts can be set for specific entry points, trend reversals, or other significant market events, helping traders stay on top of their trades.
Trading Time Filters
Traders can set time filters to restrict trading activity to specific times of the day or week, ensuring their trading aligns with their schedule and market preferences. This feature is particularly useful for those who trade part-time or prefer to avoid trading during certain market sessions.
This image depicts a potentially risky LONG trade scenario after a prolonged downward movement on the AMD on an hourly timeframe. The recommendation is to avoid this trade, as the next three higher timeframes (H4, D1, W1) are in the red zone, indicating strong bearish trends.
CONCLUSION & ACCESS
The PRO Swing Trading System for TradingView is a powerful tool for traders who value precision, adaptability, and streamlined trading operations. With its advanced features, such as customizable trend channels, dynamic signal adjustments, and integrated risk management tools, this system supports a disciplined and systematic approach to trading. It's designed to enhance your trading experience by providing all the necessary tools to make informed decisions without the need for external resources.
To gain immediate access and start using the PRO Swing Trading System today, please refer to the Author's instructions below.
ELLIPSE: Bidirectional Swing Trading Strategy (Alert Version)This is the alert version of our original script ELLIPSE: Ultimate Bidirectional Swing Trading Strategy.
This release has the same internal algorithm as the ELLIPSE Strategy script. But instead of showing back test results, this script provides the functionality to add alerts that can notify the user via email / pop-up / sms / app once a signal is given! You must manually add these alerts via TradingView. If you need help setting up these alerts, feel free to ask in the comment box or send us a dm.
***The script is invite-only, message us to get script access***
-------------------------------------------------------------------------------------------------
User Guidelines:
The trading strategy was designed and optimized for trading cryptocurrencies only ; furthermore it works best on established cryptocurrencies that have a clear historical trend such as:
BTCUSD
ETHUSD
LTCUSD
XRPUSD
ADAUSD
The trading strategy is based on swing trading methodology. The script must therefore be used on 4h candles only .
Use USD trading pairs only (e.g. use ETHUSD instead of the ETHBTC) since the individual trend is captured more effectively and therefore gives better results.
The trading strategy is bidirectional , both long and short entries are generated.
-------------------------------------------------------------------------------------------------
Indicators used in this strategy:
Ichimoku Cloud ; acts as the leading indicator.
Volume ; without strong volume , a market move is not valid.
MACD and Vortex ; both being used as confirmation indicators.
Choppiness index ; avoids trading in choppy markets.
Simple and Exponential Moving Averages ; prevents trading against the trend.
The trading strategy is easy to use, bidirectional, trend based and without repainting, meaning once a signal has been made it is permanent and that no future data is used in the decision making. It detects the trend and filters out market noise based on more than 10 technical indicators. ONLY when all indicators align with each other the algorithm prints a LONG or SHORT signal. The trading strategy provides high probability trading signals and minimizes risk! This script aims to capture the profit from short to medium trending moves and by doing so filters out non-substantial trends and avoids the associated risks with these trades.
-------------------------------------------------------------------------------------------------
Features:
NO Repaint once candle is closed.
Stop loss feature ; set your own stop loss to manage your risks.
Customizable Display for the Ichimoku cloud indicator display.
Bidirectional ; both long and short trading positions can be enabled.
Full backtest feature ; Easily generate your own backtest results for each asset (Strategy Version Script).
Alerts ; Get notified via email / pop-up / sms / app once a signal is given! (Alert Version Script).
-------------------------------------------------------------------------------------------------
Backtest results
Below are the back test results. Only well established cryptocurrencies are displayed with a clear historical trend.
Back test results: (long and short trades, signal to signal, order size: 100% of equity, commision fee 0.1%, period: start of chart)
Exchange-----Asset---------Timeframe---Percent Profitable----Profit Factor-----Total Trades----Max Drawdown---Average bars in trade-----Net Profit
Bínance------BTCUSDT---------4H-----------------54.4---------------3.37-------------------57----------------14.9---------------------38------------------1978
Bínance------ETHUSD----------4H-----------------50.9---------------3.48------------------- 57---------------26.8----------------------37------------------3953
Bínance------LTCUSD-----------4H-----------------61.0---------------3.15-------------------59----------------20.9---------------------33------------------3098
Bínance------XRPUSD----------4H-----------------43.1---------------2.44--------------------51---------------22.4----------------------26------------------1226
Bínance------ADAUSD----------4H-----------------57.5---------------3.47--------------------47---------------34.7----------------------35------------------1233
-------------------------------------------------------------------------------------------------
Reminder: Use this trading strategy at your own risk and trade responsibly. We are not responsible for any financial loss using this strategy.
***The script is invite-only, message us to get script access***

Magic Swing Suite: Trend, Pullback & Risk DashboardMagic Swing Suite: Trend, Pullback & Risk Dashboard
This indicator is a complete Swing Trading System designed to identify high-probability trend continuation setups. It combines classic trend-following principles with a unique "3-Bar Retest" logic and provides a real-time Strategy Dashboard to help you manage positions without needing a separate strategy script.
How it Works:
The system looks for a "Confluence" of factors before generating a signal. It scores every bar out of 140 points based on the following criteria:
Trend Alignment: Price must be above EMA 10, and EMA 10 must be above EMA 20.
Momentum (RSI): RSI must be in the "Bullish Control Zone" (60-80) and above its SMA.
Volume: Volume must be significantly higher than the average (1.5x by default).
The "Magic" Retest: The script checks the last 2-5 bars to see if the price has pulled back to "kiss" the EMA 10. This ensures we are buying a dip in a trend, not chasing a top.
Breakout Confirmation: Checks for Darvas Box breakouts and price position relative to Pivot R1.
Features:
🎯 Virtual Strategy Dashboard: A table that mimics a strategy tester. It tracks Entry, Stop Loss (Trailing), Target 1, and Target 2 in real-time.
📊 Confluence Scorecard: A detailed table showing exactly why a signal was (or wasn't) generated (Trend, Retest, RSI, Volume, etc.).
🛡️ Risk Management: automatically calculates a Trailing Stop (EMA 10) and fixed Risk:Reward targets based on recent highs.
📉 Multi-Layered Overlays: Includes Auto-Pivots (Traditional, Fib, Woodie, etc.) and Darvas Boxes to identify support/resistance levels.
How to Use:
Wait for a Signal:
"FULL BUY SIGNAL" (Green): All conditions are met, including a recent retest of the EMA. This is the highest probability setup.
"BUY - NO RETEST" (Orange): Trend and momentum are strong, but price hasn't pulled back recently. Use caution, as this may be a breakout trade.
Monitor the Dashboard: Once a trade is active, the dashboard will change to "IN POSITION." Follow the "Action" row.
If the trend weakens, the Trailing Stop (EMA 10) will move up to protect profits.
Targets:
T1: Previous Swing High (or 5% if no high found).
T2: 1:1.6 Risk/Reward extension.
Settings:
Volume Spike Factor: Adjust how much volume is needed to confirm a move. Default is 1.2.
Retest Tolerance: Adjust how close the price needs to get to the EMA 10 to count as a "retest."
Dashboard Toggles: You can hide the tables if you prefer a clean chart.
Pivot Timeframes: customizable lookback for S/R levels.
FAQ:
Does this repaint?
No. All signals trigger only on confirmed bars.
Can I use this intraday?
Yes. Works great from 5m to 1D.
Are exits manual or automated?
The indicator tracks SL, T1, and T2, and marks them on the chart.
Does retest affect the buy signal?
Retest is optional. The buy logic does not require it, but adds weight to the score.
Disclaimer: This tool is for educational purposes only. The "Strategy Dashboard" is a simulation based on script calculations and does not execute real trades. Always manage your own risk.

Clean CPR for Intraday, Swing trading✅ Clean CPR for Intraday & Swing Trading (NSE-Optimized)
Simple, Accurate, No-Clutter CPR levels for NIFTY, BANKNIFTY, FINNIFTY & Stocks
Perfect for Indian intraday & swing traders who want clean charts, reliable zones, and fast decision-making without overcomplicated indicators.
✅ 📌 Short Summary
This indicator plots Previous Day High/Low, CPR, Support & Resistance, and high-probability shaded zones (PH↔R1 & PL↔S1). It’s built specifically to help Indian traders identify reversal zones, breakout levels, and trend direction quickly — without chart noise or unnecessary lines.
✅ 🔍 What This CPR Indicator Does
A clean, beginner-friendly version of CPR built for practical trading in NSE markets.
1️⃣ Previous Day High & Low (PH / PL)
Plots yesterday’s high & low with price labels
These act as powerful reference levels used heavily in Indian intraday setups
Helps spot opening range breakouts, rejections, and pullback entries
2️⃣ Central Pivot Range (CPR)
CPR gives the market structure for the day
Price above CPR → Bullish bias
Price below CPR → Bearish bias
Narrow CPR → Possible trending day
Wide CPR → Likely sideways market
This is especially useful in NIFTY, BANKNIFTY, which reacts strongly to CPR width.
3️⃣ Support & Resistance Levels (R1 / S1)
Plots the first major resistance and support levels
You can plot R1 to R5, S1 to S5
Each Line can be same or different color as per your choice
4️⃣ Smart Shaded Zones (High-Probability Areas)
These shaded blocks highlight the most important reversal zones:
✅ Resistance Zone → Area between PH and R1
✅ Support Zone → Area between PL and S1
These zones often act as:
Bounce areas
Reversal regions
Ideal trade entry/exit points
Especially powerful when combined with opening range & volume spikes.
5️⃣ Current Day Open Line
Shows the opening price of today, a key reference for:
Trend confirmation
Intraday bias
Opening drive setups
6️⃣ Clean Design — No Clutter
Old historic zones are automatically removed
Only the useful previous session zones remain
All prices shown as whole numbers (no decimals)
Clear labels, clean zones, easy to read even on mobile
✅ Why This Is Perfect for Indian Traders
This indicator is optimized for:
NIFTY Futures / Options
BANKNIFTY Futures / Options
FINNIFTY
NSE Stocks
Index scalping & options trading
Indian intraday traders rely heavily on:
Previous Day High/Low
CPR width
R1/S1 reactions
Day Open behavior
PH↔R1 reversal zones
PL↔S1 support zones
This tool highlights all of them automatically, without crowding your chart.
✅ Who Should Use This
✔ New traders
✔ Intraday scalpers
✔ Swing traders
✔ Option buyers/sellers
✔ Anyone who wants a clean CPR layout without confusing extras
✅ Benefits
Clear bullish/bearish bias
High-precision reversal zones
Better entries/exits
Faster chart reading
No overthinking — the zones show themselves

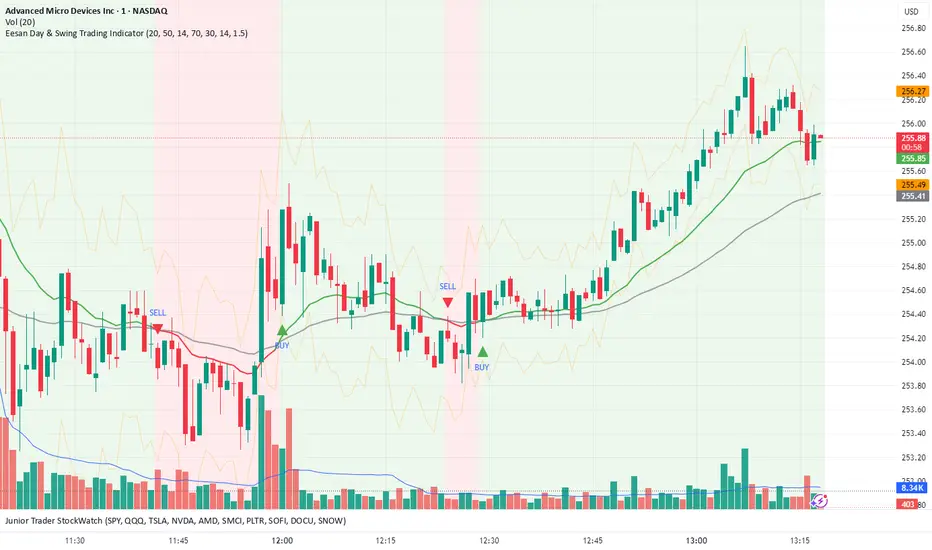
Eesan Day & Swing Trading Indicator🧭 Eesan Day & Swing Trading Indicator
🔍 Overview
The Eesan Day & Swing Trading Indicator is an all-in-one trend, momentum, and volatility tool designed for active traders who want clean, reliable signals for both day trading and swing trading.
It automatically detects buy and sell signals based on moving averages, RSI, and ATR — giving traders clear visual guidance on when to enter or exit trades.
⚙️ How It Works
This indicator combines three powerful concepts:
Trend Detection (EMA Crossovers)
Fast EMA (20) and Slow EMA (50) identify trend direction.
When the Fast EMA crosses above the Slow EMA → BUY Signal
When the Fast EMA crosses below the Slow EMA → SELL Signal
Momentum Confirmation (RSI Filter)
RSI ensures signals align with market momentum.
Avoids chasing overbought or oversold conditions.
Volatility Visualization (ATR Bands)
ATR Bands show potential price expansion zones.
Helps manage risk and visualize support/resistance.
🧠 Signal Logic
BUY → Fast EMA crosses above Slow EMA and RSI is below Overbought (70).
SELL → Fast EMA crosses below Slow EMA and RSI is above Oversold (30).
The background color changes with market trend:
🟩 Green = Bullish Trend
🟥 Red = Bearish Trend
📈 Visual Elements
Green & Red Triangles: Buy and Sell signal markers.
Colored EMAs: Reflect trend direction in real time.
ATR Bands: Show upper and lower price expansion zones.
Background Color: Indicates the dominant market trend.
⚡ Alerts
You’ll get alerts when:
✅ A BUY signal appears → “Eesan Indicator: BUY on @ ”
❌ A SELL signal appears → “Eesan Indicator: SELL on @ ”
Set alerts on the chart using “Condition → Eesan Day & Swing Trading Indicator → Buy Alert / Sell Alert.”
🧩 Best Used For
Intraday and Swing Trading
Stocks, Crypto, Forex, and Indexes
Works on all timeframes (15m, 1H, 4H, 1D recommended)
⚠️ Note
This tool is for educational and analytical purposes only.
Always confirm signals with your trading plan and proper risk management.
👤 Created by
Eesan — blending simplicity, clarity, and precision to empower traders.
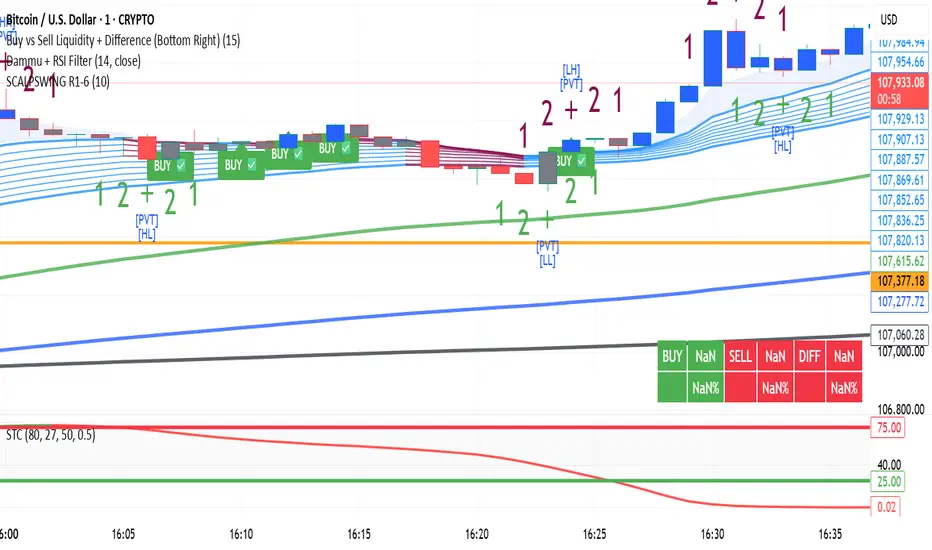
DAMMU SWING TRADING PROScalping and swing trading tool for 15-min and 1-min charts.
Designed for trend, pullback, and reversal analysis.
Works optionally with Heikin Ashi candles.
Indicators Used
EMAs:
EMA89/EMA75 (green)
EMA200/EMA180 (blue)
EMA633/EMA540 (black)
EMA5-12 channel & EMA12-36 ribbon for short-term trends
Price Action Channel (PAC) – EMA high/low/close, length adjustable
Fractals & Pristine Fractals (BW filter)
Higher High (HH), Lower High (LH), Higher Low (HL), Lower Low (LL) detection
Pivot Points – optional, disables fractals automatically
Bar color coding based on PAC:
Blue → Close above PAC
Red → Close below PAC
Gray → Close inside PAC
Trading Signals
PAC swing alerts: arrows or shapes when price exits PAC with optional 200 EMA filter.
RSI 14 signals (if added):
≥50 → BUY
<50 → SELL
Chart Setup
Two panes: 15-min (trend anchor) + 1-min (entry)
Optional Heikin Ashi candles
Use Sweetspot Gold2 for support/resistance “00” and “0” lines
Trendlines can be drawn using HH/LL or Pivot points
Usage Notes
Trade long only if price above EMA200; short only if below EMA200
Pullback into EMA channels/ribbons signals potential continuation
Fractals or pivot points help define trend reversals
PAC + EMA36 used for strong momentum confirmation
Alerts
Up/Down PAC exit alerts configurable with big arrows or labels
RSI labels show buy/sell zones (optional)
Works on both 15-min and 1-min timeframes
If you want, I can make an even shorter “super cheat-sheet” version for 1-page quick reference for trading. It will list only inputs, signals, and colors.

DAMMU Swing Trading PRODammu Scalping Pro – Short Notes
1️⃣ Purpose:
Scalping and swing trading tool for 15-min and 1-min charts.
Designed for trend continuation, pullbacks, and reversals.
Works well with Heikin Ashi candles (optional).
2️⃣ Core Components:
EMAs:
Fast: EMA5-12
Medium: EMA12-36 Ribbon
Long: EMA75/89 (1-min), EMA180/200 (15-min), EMA540/633
Price Action Channel (PAC): EMA-based High, Low, Close channel.
Fractals: Regular & filtered (BW) fractals for swing recognition.
Higher Highs / Lower Highs / Higher Lows / Lower Lows (HH, LH, HL, LL).
Pivot Points: Optional display with labels.
3️⃣ Bar Coloring:
Blue: Close above PAC
Red: Close below PAC
Gray: Close inside PAC
4️⃣ Alerts:
Swing Buy/Sell arrows based on PAC breakout and EMA200 filter.
Optional “Big Arrows” mode for visibility.
Alert messages: "SWING_UP" and "SWING_DN"
5️⃣ Workflow / Usage Tips:
Set chart to 15-min (for trend) + 1-min (for entry).
Optionally enable Heikin Ashi candles.
Trade long only above EMA200, short only below EMA200.
Watch for pullbacks into EMA channels or ribbons.
Confirm trend resumption via PAC breakout & bar color change.
Use fractals and pivot points to draw trendlines and locate support/resistance.
6️⃣ Optional Filters:
Filter PAC signals with 200 EMA.
Filter fractals for “Pristine/Ideal” patterns (BW filter).
7️⃣ Visuals:
EMA ribbons, PAC fill, HH/LL squares, fractal triangles.
Pivot labels & candle numbering for patterns.
8️⃣ Notes:
No extra indicators needed except optionally SweetSpot Gold2 for major S/R levels.
Suitable for scalping pullbacks with trend confirmation.
If you want, I can make an even shorter “one-screen cheat sheet” with colors, alerts, and EMAs, perfect for real-time chart reference.
Do you want me to do that?

DAMMU Swing Trading PRODammu Scalping Pro – Short Notes
1️⃣ Purpose:
Scalping and swing trading tool for 15-min and 1-min charts.
Designed for trend continuation, pullbacks, and reversals.
Works well with Heikin Ashi candles (optional).
2️⃣ Core Components:
EMAs:
Fast: EMA5-12
Medium: EMA12-36 Ribbon
Long: EMA75/89 (1-min), EMA180/200 (15-min), EMA540/633
Price Action Channel (PAC): EMA-based High, Low, Close channel.
Fractals: Regular & filtered (BW) fractals for swing recognition.
Higher Highs / Lower Highs / Higher Lows / Lower Lows (HH, LH, HL, LL).
Pivot Points: Optional display with labels.
3️⃣ Bar Coloring:
Blue: Close above PAC
Red: Close below PAC
Gray: Close inside PAC
4️⃣ Alerts:
Swing Buy/Sell arrows based on PAC breakout and EMA200 filter.
Optional “Big Arrows” mode for visibility.
Alert messages: "SWING_UP" and "SWING_DN"
5️⃣ Workflow / Usage Tips:
Set chart to 15-min (for trend) + 1-min (for entry).
Optionally enable Heikin Ashi candles.
Trade long only above EMA200, short only below EMA200.
Watch for pullbacks into EMA channels or ribbons.
Confirm trend resumption via PAC breakout & bar color change.
Use fractals and pivot points to draw trendlines and locate support/resistance.
6️⃣ Optional Filters:
Filter PAC signals with 200 EMA.
Filter fractals for “Pristine/Ideal” patterns (BW filter).
7️⃣ Visuals:
EMA ribbons, PAC fill, HH/LL squares, fractal triangles.
Pivot labels & candle numbering for patterns.
8️⃣ Notes:
No extra indicators needed except optionally SweetSpot Gold2 for major S/R levels.
Suitable for scalping pullbacks with trend confirmation.
If you want, I can make an even shorter “one-screen cheat sheet” with colors, alerts, and EMAs, perfect for real-time charT
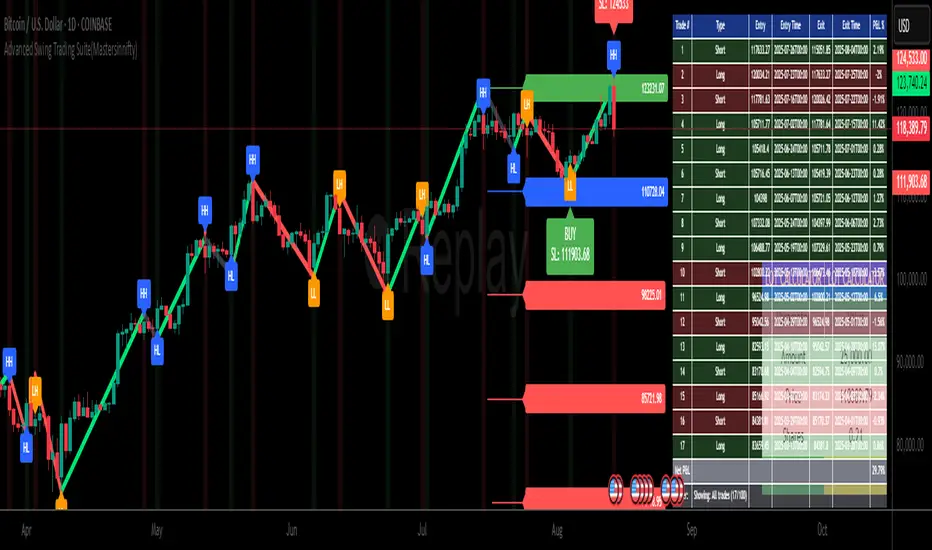
Advanced Swing Trading Suite(Mastersinnifty)🔹 Core Logic
The Advanced Swing Trading Suite is a complete framework for analyzing and trading market swings.
It combines:
A modified QQE momentum engine (adapted from the original QQE by © Peter_O under MPL 2.0).
RSI-based trend strength filter for validation.
Zigzag-driven swing structure detection (higher highs, higher lows, lower highs, lower lows).
Dynamic trade and risk management modules for practical execution.
By merging momentum, structure, and risk control, this tool goes beyond standalone indicators and provides a structured decision-support system for swing traders.
🔹 Uniqueness
While the QQE concept is freely available, this script builds an integrated swing trading ecosystem that adds multiple layers of functionality:
Swing structure analyzer that maps price action into HH, HL, LH, LL patterns in real time.
Dynamic percentage-based trade table that automatically logs entries, exits, P&L %, and timestamps.
Lot size calculator that converts account capital into position size per trade.
Swing extensions and retracement projections for planning targets.
Momentum confirmation via a tuned QQE + RSI engine.
This makes it not just an indicator, but a complete swing trading suite.
🔹 Key Features
✔ Modified QQE + RSI Momentum Filter → Early trend confirmation.
✔ Real-Time Swing Structure Labels (HH, HL, LH, LL) → Clear market context.
✔ Trade Performance Table → Tracks signals with percentage P&L and timing.
✔ Lot Size Calculator → Position sizing based on account capital.
✔ Dynamic Stops & Targets → Swing highs/lows as stops, extensions for projections.
✔ Alerts Ready → Configurable buy/sell alerts.
✔ Visual Labels → Background highlighting and trade markers.
🔹 How to Use
Entries: Green background = Long entry, Red background = Short entry.
Structure: HH/HL/LH/LL labels mark evolving swing structure.
Trade Table: Displays performance stats of past signals.
Risk Control: Use lot size calculator for instant position sizing.
Targets: Refer to swing extensions for profit zones.
Alerts: Set alerts for buy/sell triggers to receive notifications.
🔹 Disclaimer
This script integrates a modified version of QQE by © Peter_O (MPL 2.0 License).
Original QQE source: mozilla.org
All additional modules (swing analyzer, trade table, lot calculator, extensions) are original contributions by Mastersinnifty.
⚠️ Trading Disclaimer:
This script is for educational purposes only and does not constitute financial advice. Past performance is not indicative of future results. Always conduct your own research, test thoroughly, and trade with proper risk management.
Recent Range DetectorOverview
The Recent Range Detector is a specialized indicator designed to identify when an asset is currently range-bound, providing traders with clear support and resistance levels for range trading strategies. Unlike traditional indicators that focus on trend detection, this tool specifically answers the question: "Is the price range-bound right now, and what are the exact trading levels?"
Key Features
✅ Smart Range Detection - Uses a multi-factor scoring system to identify legitimate ranges
✅ Dynamic Support/Resistance Levels - Automatically calculates and displays key trading levels
✅ Range Quality Scoring - Provides confidence levels (Strong/Moderate/Weak Range)
✅ Touch Validation - Counts actual price touches to confirm range reliability
✅ Breakout Detection - Alerts when price exits the established range
✅ Visual Clarity - Clean boxes, lines, and labels for easy interpretation
How It Works
The indicator analyses recent price action using three core metrics:
Touch Quality (40%) - How many times price has respected support/resistance levels
Containment Quality (40%) - What percentage of recent bars stayed within the range
Recent Respect (20%) - Whether the latest price action confirms the range
These combine into a Range Score (0-1) that determines range strength and reliability.
Settings & Parameters
Range Lookback Period (Default: 15)
Number of bars to analyse for range detection
Shorter periods = more responsive to recent ranges
Longer periods = more stable, fewer false signals
Range Tolerance (Default: 2.0%)
Tolerance for price touches around exact highs/lows
Lower values = stricter range requirements
Higher values = more flexible range detection
Minimum Touches (Default: 3)
Required number of support/resistance touches for valid range
Higher values = more confirmed ranges, fewer signals
Lower values = more sensitive, earlier detection
Visual Options
Show Range Box: Displays the range boundaries
Show Support/Resistance Lines: Extends levels into the future
Understanding the Output
Range Score (0.000 - 1.000)
0.7+ = Strong Range (Green) - High confidence range trading setup
0.5-0.7 = Moderate Range (Yellow) - Decent range with some caution
0.3-0.5 = Weak Range (Orange) - Low confidence, be careful
<0.3 = Not Ranging - Avoid range trading strategies
Range Status Classifications
Strong Range - Perfect for range trading strategies
Moderate Range - Good range with normal risk
Weak Range - Marginal range, use smaller positions
Not Ranging - Price is trending or too choppy for range trading
Key Metrics in Info Table
Range Size (%) - Size of the range relative to price level
5-15% = Ideal range size for most strategies
<5% = Tight range, lower profit potential
>15% = Wide range, higher profit potential but more risk
Support/Resistance Levels - Exact price levels for entries/exits
Use these as your key trading levels
Support = potential buy zone
Resistance = potential sell zone
Total Touches - Number of times price respected the levels
3-5 touches = Newly formed range
6-10 touches = Well-established range
10+ touches = Very strong, reliable range
Price Position (%) - Current location within the range
0-20% = Near support (potential long opportunity)
80-100% = Near resistance (potential short opportunity)
40-60% = Middle of range (wait for better entry)
Visual Elements
Range Box
Green Box = Strong Range (Score ≥ 0.7)
Yellow Box = Moderate Range (Score 0.5-0.7)
Orange Box = Weak Range (Score 0.3-0.5)
Support/Resistance Lines
- Horizontal lines showing exact trading levels
- Extend into the future for forward guidance
- Colour matches the range strength
Background Colouring
- Subtle background tint during range periods
- Helps quickly identify ranging vs trending markets
Breakout Signals
- 📈 RANGE BREAK UP - Price breaks above resistance
- 📉 RANGE BREAK DOWN - Price breaks below support
- Only appears for confirmed ranges (Score ≥ 0.5)
Trading Applications
Range Trading Strategy
1. Look for Range Score ≥ 0.5
2. Buy near support (Price Position 0-20%)
3. Sell near resistance (Price Position 80-100%)
4. Set stops just outside the range
5. Exit on breakout signals
Breakout Strategy
1. Identify strong ranges (Score ≥ 0.7)
2. Wait for volume-confirmed breakout
3. Enter in breakout direction
4. Use previous resistance as support (or vice versa)
Market Context
- Strong ranges often occur after trending moves
- Use higher timeframes to confirm overall market structure
- Combine with volume analysis for better entries/exits
Best Practices
What to Look For
✅ Range Score ≥ 0.5 for trading consideration
✅ Multiple touches (5+) for confirmation
✅ Clear price rejection at levels
✅ Reasonable range size (5-15% for most assets)
✅ Recent price respect of boundaries
What to Avoid
❌ Trading ranges with Score < 0.3
❌ Very tight ranges (<3% size) - low profit potential
❌ Ranges with only 1-2 touches - not confirmed
❌ Ignoring breakout signals
❌ Trading against the higher timeframe trend
Alerts Available
- Range Detected - New range formation
- Range Break Up - Upward breakout
- Range Break Down - Downward breakout
- Range Ended - Range condition ended
Timeframe Recommendations
- Daily Charts - Best for swing trading ranges
- 4H Charts - Good for intermediate-term ranges
- 1H Charts - Suitable for day trading ranges
- Lower Timeframes - May produce more noise
Conclusion
The Recent Range Detector eliminates guesswork in range identification by providing objective, quantified range analysis. It's particularly valuable for traders who prefer range-bound strategies or need to identify when trending strategies should be avoided.
Remember: No indicator is perfect. Always combine with proper risk management, volume analysis, and broader market context for best results.
Disclaimer
This indicator is for educational purposes only and should not be considered as financial advice. Trading involves risk, and past performance does not guarantee future results. Always conduct your own research and consider your risk tolerance before making any trading decisions.

Gann Single Square Swing Trading System with Gann AnglesGann Single Square Swing Trading System
This script automatically detects "squares" - geometric patterns where price movement equals time movement. When price moves the same distance as the number of bars (time), it creates powerful support/resistance levels based on Gann theory.
Key Visual Elements
• Box: The detected square pattern
• Dark Blue Line (50%): Most important trading level
• Green Lines: Profit target levels (125%, 150%)
• Red Lines: Stop loss levels (-25%, -50%)
• Colored Angle Lines: Gann angles for trend direction
• Quality Score: Blue label showing setup strength (aim for 70%+)
Simple Trading Rules
LONG Trades (Green 🟢 Square)
1. Entry: Buy when price touches the dark blue 50% line from above
2. Stop Loss: Place below the red -25% line
3. Take Profit: Exit at green 125% line (first target) or 150% line (second target)
SHORT Trades (Red 🔴 Square)
1. Entry: Sell when price touches the dark blue 50% line from below
2. Stop Loss: Place above the red -25% line
3. Take Profit: Exit at green 125% line (first target) or 150% line (second target)
Entry Checklist
✅ Square quality score > 70%
✅ Price touches 50% level (dark blue line)
✅ Volume above average (if volume filter enabled)
✅ Clear square formation visible
Alerts
The script generates automatic alerts when price reaches the 50% trading level. Enable alerts in TradingView to get notified of setups.
Bottom Line: Wait for the alert → Check quality score → Enter at 50% level → Set stop at red line → Take profit at green line.

Compression Patterns (w/ Trend + Proximity Filter)🧠 Description:
This indicator identifies high-probability price compression patterns within trending environments — a setup prized by experienced swing and day traders alike. It combines the classic NR4, NR7, 2-Bar NR, 3-Bar NR, and Inside Day formations with a powerful trend filter and proximity logic to deliver clear, focused signals.
🔍 What's Inside:
▪️ Compression Patterns
The core of this tool lies in the logic of price compression. These patterns signal the market taking a breath — volatility contracts, volume dries up, and price coils like a spring.
When this happens in the right context, the next move is often explosive.
NR4 / NR7: Narrowest range in 4 or 7 bars — excellent for spotting the quiet before the storm.
2-Bar NR / 3-Bar NR: These identify the tightest consecutive 2 or 3-day ranges over the past 20 days — contextually rare and powerful.
Inside Day: A simple but highly effective consolidation pattern, especially when it clusters around key moving averages.
▪️ Trend Filter (EMA Stack)
You could say this is where most indicators fall apart — no context.
This one doesn’t make that mistake.
Signals only fire when the 10 EMA > 20 EMA > 50 EMA, and price is above the 20 EMA. That’s a strong, established uptrend — the only environment where breakouts are statistically favourable.
Why?
Because trend following works.
It may not give you fixed daily returns, but it’s the only strategy with theoretically infinite profit potential. You risk little, trade less, and position yourself for rare but massive moves. That’s the edge.
▪️ Proximity Filter (1 ATR to EMA)
We’ve added another layer of discipline. Signals only fire when price is:
Within 1 ATR of the 10 EMA (if price is above it), or
Within 1 ATR of the 20 EMA (if price is below the 10 EMA)
This ensures you’re not chasing. You’re waiting for tight, controlled pullbacks into dynamic support — exactly where institutions add size, not exit.
⚙️ Fully Customisable:
Toggle visibility of each pattern
Custom colours and transparency for label & background
Adjustable ATR length and multiplier
Change label text if needed (useful for translations or tweaks)
🎯 Ideal Use Case:
Swing trading off the daily chart
Day trading with VWAP/MACD filters (in alternate versions)
Supplementing price action strategies
🔚 Final Word:
This isn’t an “everything scanner.”
It’s a discerning sniper scope for traders who wait patiently for clean trends, tight consolidations, and perfect proximity — then strike.

Day & Swing Trading EMA Clouds with Adaptive LevelsDay & Swing Trading EMA Clouds with Adaptive Levels is a tool designed for traders who need a flexible indicator that adapts to both short-term (day trading) and long-term (swing trading) strategies. The indicator blends EMA clouds and adaptive support/resistance levels, making it suitable for analyzing trend strength and key price zones.
How It Works:
EMA Clouds for Trend Detection:
This indicator uses three EMAs (Fast, Intermediate, Slow) to create two clouds:
Fast Cloud: The area between the fast and Intermediate EMAs.
Slow Cloud: The area between the Intermediate and slow EMAs.
The cloud colors change based on trend direction:
Positive (uptrend): When the fast EMA is above the Intermediate EMA (turquoise) or the Intermediate EMA is above the slow EMA (teal).
Negative (downtrend): When the fast EMA is below the Intermediate EMA (pink) or the Intermediate EMA is below the slow EMA (magenta).
Traders can use these clouds to visually gauge market momentum and trend reversals.
Adaptive EMA Settings Based on Trading Mode:
The EMA lengths adjust automatically depending on whether you're in Day Trading or Swing Trading mode:
Day Trading Mode uses shorter periods to capture quick price movements:
Fast EMA: 5-period
Mid EMA: 13-period
Slow EMA: 21-period
Swing Trading Mode uses longer periods to capture broader trends:
Fast EMA: 12-period
Mid EMA: 26-period
Slow EMA: 50-period
This dynamic adjustment allows you to switch between trading styles seamlessly, with the EMAs reflecting the most relevant timeframes for each strategy.
Adaptive Support and Resistance Levels:
Depending on the selected trading mode, the indicator dynamically plots key levels:
Day Trading Mode: Previous day’s high, low, and midpoint, as well as 2-day levels.
Swing Trading Mode: Previous month’s high, low, and midpoint, as well as 2-month levels.
These levels act as dynamic support and resistance zones, giving traders critical areas to monitor for potential reversals or breakouts.
Buy & Sell Signals:
Visual buy/sell signals are generated when the fast EMA crosses above or below the slow EMA. These signals can help traders identify potential trend reversals.
Customization:
You can fully adjust the transparency and colors of the clouds to fit your personal preferences and trading style.
Why This Combination?
Combining EMA clouds with adaptive levels provides traders with a complete picture. The clouds highlight the underlying market momentum and trend strength, while the adaptive levels offer potential entry/exit points based on historical price action. This unique mashup allows traders to follow trends and plan trades around key support and resistance zones.

[FXAN] 77 Cygni Algorithm (Swing Trading)⚜️ FXAN CYGNI INDICATORS ORIGINALITY
Originality comes from proprietary formula we use to measure the relationship between Volume and Price Volatility in relation to overall current market positioning in developing Volume Profile and multiple custom period Volume Profiles. We combine that with our own approach to measure price velocity in correlation to average daily/weekly/monthly ranges of the given market.
The relationship between current volume and price volatility gives us information about how much the volume that is currently coming into the market affects the price movement (volatility) and which side is more dominant/involved in the market (Buyers/Sellers). We call this the "Volume Impact" factor.
This information is then compared in relation to the overall current market positioning in developing Volume Profile and Multiple custom period Volume Profiles. We have created a rating system based on current price positioning in relation to the Volume Profile. Volume profile consists of different volume nodes, high volume nodes where we consider market interest to be high (a lot of transactions - High Volume) and low volume nodes where we consider market interest to be low (not a lot of transactions - Low Volume). We call this the current "Market Interest" factor.
We combine this information with our own approach to measure price velocity in correlation to the higher-timeframe price ranges. Calculation is done by measuring current ranges of market movement in correlation to average daily/weekly/monthly ranges. We call this "Price Velocity" factor.
This approach was applied to develop key components of our Tradingview Indicators, we've simplified some of the calculations and made them easy to use by programming them to display buying/selling volume pressure with colors.
In addition to our own proprietary formulas and criterias to measure volume impact on price, we've also used an array of indicators that measure the percentage change in volume over custom specified periods of time, including custom period ranged Volume Profile, Developing VA, Accumulation/Distribution (A/D Line), Volume Rate of Change (VROC), Volume Price Trend (VPT) - all of them with of course fine-tuned settings to fit the purpose in the overall calculation.
Reasons for multiple indicator use:
Custom period ranged Volume Profiles: To determine current interest of market participants. Used for "Market Interest"
Developing VA: To determine current fair price of the market (value area). Used for "Market Interest".
Accumulation/Distribution (A/D Line): Helping to gauge the strength of buying and selling pressure. Used for "Volume Impact"
Volume Rate of Change (VROC): To give us information about percentage change in volume. Used for "Volume Impact"
Volume Price Trend (VPT): To help identify potential trends. Used for "Volume Impact".
Average True Range (ATR): Used for measuring volatility. Used for "Volume Impact" and "Price Velocity".
Average Daily Range (ADR): Used for measuring average market price movement. Used for "Price Velocity".
How it all works together:
"Volume Impact" factor tells us the influence of incoming market volume on price movement. This information alongside the overall market positioning information derived from "Market Interest" factor combined with information about speed and direction relative to higher-timeframe price ranges frin "Price Velocity.
This is the basis of our proprietary developed Volume Dynamics analysis approach
"Volume Impact" x "Market Interest" x "Price Velocity"
Combining this factors together gives a good overall understanding of which side is currently more involved in the market to gauge the direction ("Volume Impact"), where the market is currently positioned to gauge the context ("Market Interest") and what the current market's momentum to improve the timing of our trades ("Price Velocity"). This increases our probabilities for successful trades, executed with good timing.
To simplify - our indicators will always analyze the volume behind every price movement and rate those movements based on the relationship between movement distance and volume behind it through an array of criterias and rate them.
Colors displayed by the indicators will be a result of that, suggesting which side of the market (Buyers or sellers) is currently more involved in the market, aiming to increase the probabilities for profitable trades. With the help of our indicators you have deep volume analysis behind price movements done without looking at anything else then indicator components.
🔷 OVERVIEW
Cygni 77 Algorithm is a TradingView indicator designed to help determine higher timeframe market context and long-term market sentiment and trends. It analyzes the underlying volume behind market movements and colors the candles with the help of formulas that include technical analysis and market price action. It caters to traders looking for swing trading setups or additional perspectives for day trading sentiment.
🔷 KEY FEATURES
▊ Candle Coloring
▊ Dynamic Support & Resistance Lines
▊ Dots | Above and below the candles
▊ Colored Bar | on the bottom of the chart
🔷 HOW DOES IT WORK?
□ Candle colors will indicate the general market trend from the technical analysis perspective. The calculation for this component uses price action concepts and segments from technical analysis, for example, candle/price structural breaks. Volume is not used for calculations of this component.
□ Dynamic Support & Resistance Lines indicate the current market structure from the technical analysis perspective. The calculation uses pure price action and structural analysis of the current market movements.
□ Candle Dots show what are the mid-term volume dynamics in the market by referencing the daily average price weighted by volume with the periods ranging from days to weeks. Candle Dots suggest what is the likely direction of the market's trend from the mid-term perspective. If the market is bullish, you’ll see the green dots printed below the candles, and if the market is bearish, the dots will color red and print above the candles.
□ Colored Bar analyzes long-term volume dynamics and the market's price action for the past three to six weeks, referencing average price weighted by volume. This makes it much less sensitive than the Candle Dots, so the colors won't change that often. If the market is bullish, you’ll see the green bars, and if the market is bearish, the bars will color red.
🔷 HOW TO USE IT?
□ In general, we look for areas where all components are in sync. These are valid trading signals (refer to the usage example below).
□ If all components are not in sync, we should look for at least two of them to be in sync, while one of them must be the Colored Bar.
□ Candle Colors: Looking for longs when the candles are green and looking for shorts when the colors are red
□ Dynamic Support & Resistance Lines: Used for placing entries and stop-loss limits. Using retest of the line for entry and placing the stop-loss beyond it. Or if we're entering based on other components, we can use the line to place the stop-loss beyond it.
□ Candle Dots: Looking to trade in the direction of the color. If the market is bullish, you’ll see the green dots, and if the market is bearish, the dots will color red.
□ Colored Bar: Most important component of this indicator, we favor trading in the direction suggested by this component. Additional confirmation of other components is a bonus. Colors here don't change that often, but once they do - it usually signals a long-term trend shift. Green color suggests a bullish market, trading long. Red color suggests bearish market, trading short.
🔷 COMBINING THE COMPONENTS
Each component of the indicator serves its own purpose and analyzes the market from its own perspective and with its own custom settings and formulas. The calculation of the individual component is done independently from the calculation of the other components. Once all of them align, we can execute trades with an edge as it signals that different aspects of volume and price analysis line up for the trading opportunity.
-Candle Colors performs technical analysis for you by displaying the colors of a favorable market direction based on the market's current technical structure.
- Dynamic Support & Resistance Lines are used for placing your entry/exit limit orders.
-Candle Dots are used to determine the favorable direction of the market based on Daily Volume Dynamics, with custom timeframe settings ranging from a couple of days to a couple of weeks.
-The Colored Bar is used to gauge the overall favorable trading direction based on Daily Volume Dynamics with custom timeframe settings ranging from 3 to 6 weeks.
It's important to combine the components to increase the probability of success - here's how you should look for a trade:
1. Assess the current most favorable market direction by referencing the Colored Bar. Look for longs if it’s green and for shorts if it’s red
2. Look for the Candle Dots to align with the Colored Bar, look for longs if it’s green and for shorts if it’s red
3. Look for the Candle Colors to align with the Colored Bar. Look for longs if it’s green and for shorts if it’s red
4. Place your SL level beyond the currently developing Support/Resistance line to protect your positions and look for exits once the colors change.
A valid example of the trade would be:
- Colored Bar is green, indicating the favorable trading directions is long
- Candle Dots are green, indicating the favorable trading directions is long
- Candle Colors are green, indicating the market structure is favorable to enter your positions
📊 USAGE EXAMPLE

Damage Indicator by Scipio ProScipio Pro's Damage Indicator detects strong momentum on tops and bottoms. It is intended for swing trading.
The script analyzes both recent and less-recent price action and performs candle stick analysis. It also uses SDs and multiple Bollinger Bands to find dynamic levels for entries.
A Bears Damaged signal emerges whenever there is convincing proof of strength at a bottom. Often, when the market reverses quickly, traders are caught offside and are forced to buy higher. The reverse goes for Bulls Damaged signals, which mean there is convincing proof of bearish strength at a (local?) top.
Whether the move gets legs depends in large part on the structure in which the show of momentum takes place. It is sensible to wonder after each signal whether the market structure (and other relevant context such as the majority of cash having been sidelined) dictates that risk-reward is skewed to the upside or to the downside. If, for example, a Bears Damaged signal emerges on the daily and risk-reward on the weekly is skewed to the upside, go 4x larger (again, just an example). If, on the other hand, the same signal emerges on the daily while the risk-reward is skewed to the downside on the weekly, bet much smaller and tighten your stop-loss. For best results, I suggest you always check one timeframe higher for your long-term risk-reward bias. (No financial advice, of course.)
Under Settings you'll find the so-called Noise Protection , which is switched "on" by default. We recommend you keep this switched on. Noise Protection ensures you do not see Damage signals on timeframes lower than the 4 hour. After all, chasing momentum on low timeframes is a losing game. The amount of noise increases exponentially as you move lower down the timeframes. Again, this indicator is for swing trades. Don't use it for scalping.
It should be useful for all assets, but is of course more useful on some than on others. As with all indicators, signals tend to be more meaningful if the asset in question is at least somewhat liquid, for instance.
As always, use at your own risk. Using indicators is no substitute for using one's brain.
