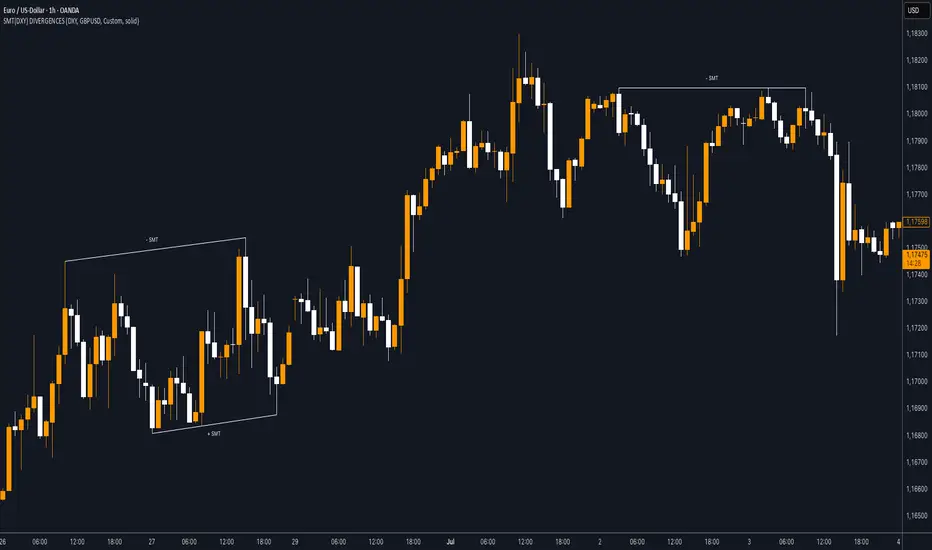
SMT (DXY) DIVERGENCESThis indicator detects Smart Money Technique (SMT) Divergences between the chart symbol and up to two comparison symbols defined in the settings.
It identifies swing highs and swing lows on correlated/uncorrelated instruments, compares their highs and lows, and determines possible divergences.
🔷 What It Detects
-Bullish SMT Divergence: When the lows of the chart symbol slope in the opposite direction of the comparison symbol’s lows.
-Bearish SMT Divergence: When the highs of the chart symbol slope in the opposite direction of the comparison symbol’s highs.
-Multi-Symbol Compatibility: Ability to compare the main symbol with one or two external tickers (default: DXY and GBPUSD).
-Negative Divergence Option: The inversion feature allows comparison with opposite-moving charts.
🔷 Calculation Logic
-Swing Detection: Swing highs and lows are confirmed using pivot-based logic.
-Comparison: Slopes of highs and lows are calculated for both the chart symbol and the comparison symbols.
-Divergence Identification: If slopes point in opposite directions, an SMT divergence (bullish or bearish) is marked.
-Visualization: Lines and labels (“+ SMT” or “– SMT”) are drawn on the chart. Historical lines can be kept or cleared depending on user settings.
🔷 Visual
Bearish SMT: Downward line with “– SMT” label.
Bullish SMT: Upward line with “+ SMT” label.
Style Options: Predefined color schemes (TLAB, standard, monochrome) or fully customizable colors.
Line Style: Solid, dashed, or dotted.
🔷 Customization Options
-Show Historical: Decide whether past divergences remain visible on the chart.
-Comparison Symbols: Define up to two external tickers, with optional inversion.
-Swing Lengths: Preconfigured pivot lengths automatically adapt to the selected timeframe (Daily, 4H, 1H, 5m/15m).
-Lines & Labels: Enable or disable bullish/bearish SMT divergences and their annotations.
🔷 Indicator Usage
Select the comparison symbol with positive or negative correlation.
Wait for the “+ SMT” or “– SMT” marker to appear on the chart.
Divergences can be used as contextual confluence when studying potential market shifts:
A + SMT marker may suggest bullish divergence.
A – SMT marker may suggest bearish divergence.
Pesquisar nos scripts por "swing high"
Machine Learning-Inspired Supply & Demand Zones [AlgoPoint]This indicator is a Smart Supply & Demand Zone tool, developed with principles inspired by Machine Learning (ML). It intelligently filters out market noise, allowing you to focus only on the most significant zones where institutional order flow is likely present.
💡 How It Works: Why Is This Indicator "Smart"?
Unlike traditional indicators that only measure simple price movements, this script uses an algorithm that asks the same critical questions an experienced market analyst would to qualify a zone:
- 1. Price Imbalance: How fast and aggressively did the price leave the zone? Our algorithm measures the body size of the "departure candle" relative to the current market volatility (ATR). A zone is only considered if it was formed by an explosive move that is statistically significant, indicating a major imbalance between buyers and sellers.
- 2. Volume Confirmation: Did the "smart money" participate in this move? The script checks if the volume on the departure candle was significantly higher than the recent average volume. A spike in volume confirms that the move was backed by institutional interest, adding strength and validity to the zone.
- 3. Valid Pivot Structure: Did the zone originate from a meaningful swing high or low? The algorithm first identifies a valid pivot structure, ensuring that zones are not drawn from insignificant or random price fluctuations.
Only when a potential zone passes these three critical tests—our "quality filter"—is it drawn on your chart.
🚀 Features & How to Use
Using the indicator is straightforward. You will see two primary types of boxes on your chart:
* 🟥 Red Box (Supply Zone): An area of potential resistance where selling pressure is likely to be strong. Look for potential shorting opportunities as the price approaches this zone.
* 🟩 Green Box (Demand Zone): An area of potential support where buying pressure is likely to be strong. Look for potential long opportunities as the price pulls back into this zone.
Dynamic Zone Management
This indicator is not static; it lives and breathes with the market:
- Fresh Zone: A newly formed zone appears in its full, vibrant color. These are the highest-probability zones as they have not yet been re-tested.
- Broken / Flipped Zone: You have full control over what happens when a zone is broken! In the settings, you can choose:
- Delete Zone: The zone will be removed completely when the price closes through it.
- Show as Broken (Flip): When broken, the zone will turn gray, stop extending, and remain on your chart. This is extremely useful for identifying Support/Resistance Flips, where a broken demand zone becomes new resistance, or a broken supply zone becomes new support.
⚙️ Settings & Customization
Fine-tune the indicator to match your personal trading style via the settings menu:
- Breakout Behavior: The most powerful feature. Choose between Delete Zone and Show as Broken (Flip) to customize your chart.
- Zone Finding Logic: Control the indicator's sensitivity.
- Selective: Requires both strong imbalance and high volume. Finds fewer, but higher-quality, zones.
- Moderate: Requires either strong imbalance or high volume. Finds more potential zones.
- Sensitivity Settings: Adjust the ATR Multiplier and Volume Multiplier to make the criteria for a "strong" zone stricter or looser.

Adaptive Rolling Quantile Bands [CHE] Adaptive Rolling Quantile Bands
Part 1 — Mathematics and Algorithmic Design
Purpose. The indicator estimates distribution‐aware price levels from a rolling window and turns them into dynamic “buy” and “sell” bands. It can work on raw price or on *residuals* around a baseline to better isolate deviations from trend. Optionally, the percentile parameter $q$ adapts to volatility via ATR so the bands widen in turbulent regimes and tighten in calm ones. A compact, latched state machine converts these statistical levels into high-quality discretionary signals.
Data pipeline.
1. Choose a source (default `close`; MTF optional via `request.security`).
2. Optionally compute a baseline (`SMA` or `EMA`) of length $L$.
3. Build the *working series*: raw price if residual mode is off; otherwise price minus baseline (if a baseline exists).
4. Maintain a FIFO buffer of the last $N$ values (window length). All quantiles are computed on this buffer.
5. Map the resulting levels back to price space if residual mode is on (i.e., add back the baseline).
6. Smooth levels with a short EMA for readability.
Rolling quantiles.
Given the buffer $X_{t-N+1..t}$ and a percentile $q\in $, the indicator sorts a copy of the buffer ascending and linearly interpolates between adjacent ranks to estimate:
* Buy band $\approx Q(q)$
* Sell band $\approx Q(1-q)$
* Median $Q(0.5)$, plus optional deciles $Q(0.10)$ and $Q(0.90)$
Quantiles are robust to outliers relative to means. The estimator uses only data up to the current bar’s value in the buffer; there is no look-ahead.
Residual transform (optional).
In residual mode, quantiles are computed on $X^{res}_t = \text{price}_t - \text{baseline}_t$. This centers the distribution and often yields more stationary tails. After computing $Q(\cdot)$ on residuals, levels are transformed back to price space by adding the baseline. If `Baseline = None`, residual mode simply falls back to raw price.
Volatility-adaptive percentile.
Let $\text{ATR}_{14}(t)$ be current ATR and $\overline{\text{ATR}}_{100}(t)$ its long SMA. Define a volatility ratio $r = \text{ATR}_{14}/\overline{\text{ATR}}_{100}$. The effective quantile is:
Smoothing.
Each level is optionally smoothed by an EMA of length $k$ for cleaner visuals. This smoothing does not change the underlying quantile logic; it only stabilizes plots and signals.
Latched state machines.
Two three-step processes convert levels into “latched” signals that only fire after confirmation and then reset:
* BUY latch:
(1) HLC3 crosses above the median →
(2) the median is rising →
(3) HLC3 prints above the upper (orange) band → BUY latched.
* SELL latch:
(1) HLC3 crosses below the median →
(2) the median is falling →
(3) HLC3 prints below the lower (teal) band → SELL latched.
Labels are drawn on the latch bar, with a FIFO cap to limit clutter. Alerts are available for both the simple band interactions and the latched events. Use “Once per bar close” to avoid intrabar churn.
MTF behavior and repainting.
MTF sourcing uses `lookahead_off`. Quantiles and baselines are computed from completed data only; however, any *intrabar* cross conditions naturally stabilize at close. As with all real-time indicators, values can update during a live bar; prefer bar-close alerts for reliability.
Complexity and parameters.
Each bar sorts a copy of the $N$-length window (practical $N$ values keep this inexpensive). Typical choices: $N=50$–$100$, $q_0=0.15$–$0.25$, $k=2$–$5$, baseline length $L=20$ (if used), adaptation strength $s=0.2$–$0.7$.
Part 2 — Practical Use for Discretionary/Active Traders
What the bands mean in practice.
The teal “buy” band marks the lower tail of the recent distribution; the orange “sell” band marks the upper tail. The median is your dynamic equilibrium. In residual mode, these tails are deviations around trend; in raw mode they are absolute price percentiles. When ATR adaptation is on, tails breathe with regime shifts.
Two core playbooks.
1. Mean-reversion around a stable median.
* Context: The median is flat or gently sloped; band width is relatively tight; instrument is ranging.
* Entry (long): Look for price to probe or close below the buy band and then reclaim it, especially after HLC3 recrosses the median and the median turns up.
* Stops: Place beyond the most recent swing low or $1.0–1.5\times$ ATR(14) below entry.
* Targets: First scale at the median; optional second scale near the opposite band. Trail with the median or an ATR stop.
* Symmetry: Mirror the rules for shorts near the sell band when the median is flat to down.
2. Continuation with latched confirmations.
* Context: A developing trend where you want fewer but cleaner signals.
* Entry (long): Take the latched BUY (3-step confirmation) on close, or on the next bar if you require bar-close validation.
* Invalidation: A close back below the median (or below the lower band in strong trends) negates momentum.
* Exits: Trail under the median for conservative exits or under the teal band for trend-following exits. Consider scaling at structure (prior swing highs) or at a fixed $R$ multiple.
Parameter guidance by timeframe.
* Scalping / LTF (1–5m): $N=30$–$60$, $q_0=0.20$, $k=2$–3, residual mode on, baseline EMA $L=20$, adaptation $s=0.5$–0.7 to handle micro-vol spikes. Expect more signals; rely on latched logic to filter noise.
* Intraday swing (15–60m): $N=60$–$100$, $q_0=0.15$–0.20, $k=3$–4. Residual mode helps but is optional if the instrument trends cleanly. $s=0.3$–0.6.
* Swing / HTF (4H–D): $N=80$–$150$, $q_0=0.10$–0.18, $k=3$–5. Consider `SMA` baseline for smoother residuals and moderate adaptation $s=0.2$–0.4.
Baseline choice.
Use EMA for responsiveness (fast trend shifts) and SMA for stability (smoother residuals). Turning residual mode on is advantageous when price exhibits persistent drift; turning it off is useful when you explicitly want absolute bands.
How to time entries.
Prefer bar-close validation for both band recaptures and latched signals. If you must act intrabar, accept that crosses can “un-cross” before close; compensate with tighter stops or reduced size.
Risk management.
Position size to a fixed fractional risk per trade (e.g., 0.5–1.0% of equity). Define invalidation using structure (swing points) plus ATR. Avoid chasing when distance to the opposite band is small; reward-to-risk degrades rapidly once you are deep inside the distribution.
Combos and filters.
* Pair with a higher-timeframe median slope as a regime filter (trade only in the direction of the HTF median).
* Use band width relative to ATR as a range/trend gauge: unusually narrow bands suggest compression (mean-reversion bias); expanding bands suggest breakout potential (favor latched continuation).
* Volume or session filters (e.g., avoid illiquid hours) can materially improve execution.
Alerts for discretion.
Enable “Cross above Buy Level” / “Cross below Sell Level” for early notices and “Latched BUY/SELL” for conviction entries. Set alerts to “Once per bar close” to avoid noise.
Common pitfalls.
Do not interpret band touches as automatic signals; context matters. A strong trend will often ride the far band (“band walking”) and punish counter-trend fades—use the median slope and latched logic to separate trend from range. Do not oversmooth levels; you will lag breaks. Do not set $q$ too small or too large; extremes reduce statistical meaning and practical distance for stops.
A concise checklist.
1. Is the median flat (range) or sloped (trend)?
2. Is band width expanding or contracting vs ATR?
3. Are we near the tail level aligned with the intended trade?
4. For continuation: did the 3 steps for a latched signal complete?
5. Do stops and targets produce acceptable $R$ (≥1.5–2.0)?
6. Are you trading during liquid hours for the instrument?
Summary. ARQB provides statistically grounded, regime-aware bands and a disciplined, latched confirmation engine. Use the bands as objective context, the median as your equilibrium line, ATR adaptation to stay calibrated across regimes, and the latched logic to time higher-quality discretionary entries.
Disclaimer
No indicator guarantees profits. Adaptive Rolling Quantile Bands is a decision aid; always combine with solid risk management and your own judgment. Backtest, forward test, and size responsibly.
The content provided, including all code and materials, is strictly for educational and informational purposes only. It is not intended as, and should not be interpreted as, financial advice, a recommendation to buy or sell any financial instrument, or an offer of any financial product or service. All strategies, tools, and examples discussed are provided for illustrative purposes to demonstrate coding techniques and the functionality of Pine Script within a trading context.
Any results from strategies or tools provided are hypothetical, and past performance is not indicative of future results. Trading and investing involve high risk, including the potential loss of principal, and may not be suitable for all individuals. Before making any trading decisions, please consult with a qualified financial professional to understand the risks involved.
By using this script, you acknowledge and agree that any trading decisions are made solely at your discretion and risk.
Enhance your trading precision and confidence 🚀
Best regards
Chervolino

Sunmool's Silver Bullet Model FinderICT Silver Bullet Model Indicator - Complete Guide
📈 Overview
The ICT Silver Bullet Model indicator is a supplementary tool for utilizing ICT's (Inner Circle Trader) market structure analysis techniques. This indicator detects institutional liquidity hunting patterns and automatically identifies structural levels, helping traders analyze market structure more effectively.
🎯 Core Features
1. Structural Level Identification
STL (Short Term Low): Recent support levels formed in the short term
STH (Short Term High): Recent resistance levels formed in the short term
ITL (Intermediate Term Low): Stronger support levels with more significance
ITH (Intermediate Term High): Stronger resistance levels with more significance
2. Kill Zone Time Display
London Kill Zone: 02:00-05:00 (default)
New York Kill Zone: 08:30-11:00 (default)
These are the most active trading hours for institutional players where significant price movements occur
3. Smart Sweep Detection
Bear Sweep (🔻): Pattern where price sweeps below lows then recovers - Simply indicates sweep occurrence
Bull Sweep (🔺): Pattern where price sweeps above highs then declines - Simply indicates sweep occurrence
Important: Sweep labels only mark liquidity hunting locations, not directional bias.
🔧 Configuration Parameters
Basic Settings
Sweep Detection Lookback: Number of candles for sweep detection (default: 20)
Structure Point Lookback: Number of candles for structural point detection (default: 10)
Sweep Threshold: Percentage threshold for sweep validation (default: 0.1%)
Time Settings
London Kill Zone: Active hours for London session
New York Kill Zone: Active hours for New York session
Visualization Settings
Customizable colors for each level type
Enable/disable alert notifications
📊 How to Use
1. Chart Setup
Most effective on 1-minute to 1-hour timeframes
Recommended for major currency pairs (EUR/USD, GBP/USD, etc.)
Also applicable to cryptocurrencies and indices
2. Signal Interpretation
🔻 Bear Sweep / 🔺 Bull Sweep Labels
Simply indicate liquidity hunting occurrence points
Not directional bias indicators
Reference for understanding overall context on HTF
🟢 Silver Bullet Long (Huge Green Triangle)
After Bear Sweep occurrence
Within Kill Zone timeframe
Current price positioned above swept level
→ Actual BUY entry signal
🔴 Silver Bullet Short (Huge Red Triangle)
After Bull Sweep occurrence
Within Kill Zone timeframe
Current price positioned below swept level
→ Actual SELL entry signal
3. Risk Management
Use swept levels as stop-loss reference points
Approach signals outside Kill Zone hours with caution
Recommended to use alongside other technical analysis tools
💡 Trading Strategies
Silver Bullet Strategy
Preparation Phase: Monitor charts 30 minutes before Kill Zone
Sweep Observation: Identify liquidity hunting points with 🔻🔺 labels (reference only)
Entry: Enter ONLY when huge triangle Silver Bullet signal appears within Kill Zone
Take Profit: Target opposite structural level or 1:2 reward ratio
Stop Loss: Beyond the swept level
Important: Small sweep labels are NOT trading signals!
Multi-Timeframe Approach
Step 1: HTF (Higher Time Frame) Sweep Reference
Observe 🔻🔺 sweep labels on 4-hour and daily charts
Reference only sweeps occurring at major structural levels
HTF sweeps are used to identify liquidity hunting points
Reference only, not for directional bias
Step 2: Transition to LTF (Lower Time Frame)
Move to 15-minute, 5-minute, and 1-minute charts
Analyze LTF with reference to HTF sweep information
Use STL, STH, ITL, ITH for precise entry point identification
Structural levels on LTF are the core of actual trading decisions
Only huge triangle (Silver Bullet) signals are actual entry signals
Recommended Usage
Identify overall sweep occurrence points on HTF (🔻🔺 labels)
Use this indicator on LTF to identify structural levels
Reference only huge triangle signals for actual trading during Kill Zone
Small sweep labels (🔻🔺) are for reference only, not entry signals
📋 Information Table Interpretation
Real-time information in the top-right table:
Kill Zone Status: Current active session status
Level Counts: Number of each structural level type
⚠️ Important Disclaimers
Backtesting results do not guarantee future performance
Exercise caution during high market volatility periods
Always apply proper risk management
Recommend comprehensive analysis with other analytical tools
🎓 Learning Resources
Study original ICT concepts through free YouTube educational content
Research Market Structure analysis techniques
Optimize through backtesting for personal use
🔬 Technical Implementation
Algorithm Logic
Pivot Point Detection: Uses TradingView's built-in pivot functions to identify swing highs and lows
Classification System: Automatically categorizes levels based on recent price action frequency
Sweep Validation: Confirms legitimate sweeps through price action analysis
Time-Based Filtering: Prioritizes signals during institutional active hours
Performance Optimization
Efficient array management prevents memory overflow
Dynamic level cleanup maintains chart clarity
Real-time calculation ensures minimal lag
🛠️ Customization Tips
Adjust lookback periods based on market volatility
Modify kill zone times for different market sessions
Experiment with sweep threshold for different instruments
Color-code levels according to personal preference
📈 Expected Outcomes
When properly implemented, this indicator can help traders:
Identify high-probability reversal points
Time entries with institutional flow
Reduce false signals through kill zone filtering
Improve risk-to-reward ratios
This indicator automates ICT's concepts into a user-friendly tool that can be enhanced through continuous learning and practical application. Success depends on understanding the underlying market structure principles and combining them with proper risk management techniques.

zuperviewResourcesLibrary "zuperview"
ComputeMAValue(maType, series, period)
ComputeMAValue
@description Computes the moving average (MA) value based on the specified MA type.
Parameters:
maType (string) : (string) The type of moving average: "EMA", "SMA", "RMA", "WMA", "HMA", "VWMA", "LinReg".
series (float) : (float) The input price series (typically close).
period (simple int) : (int) The number of periods used for MA calculation.
Returns: (float) The computed MA value or `na` if maType is invalid.
ComputeATRValue(period)
ComputeATRValue
@description Computes the moving average (ATR) value based on the specified ATR type.
Parameters:
period (int) : (int) The number of periods used for MA calculation.
Returns: (float) The computed ATR value or `na` if maType is invalid.
Max(src, period)
Parameters:
src (float)
period (int)
Min(src, period)
Parameters:
src (float)
period (int)
ComputeRSIValue(src, period, smooth)
ComputeRSIValue
@description Computes the moving average (RSI) value based on the specified RSI type.
Parameters:
src (float) : (series) Input series (series float), which can be close (`close`), open (`open`), high (`high`), low (`low`), or any other price-based series.
period (int) : (int) The number of periods used for MA calculation.
smooth (int)
Returns: (float) The computed RSI value or `na` if maType is invalid.
ComputeSMMAValue(src, period)
ComputeSMMAValue
@description Computes the moving average (SMMA) value based on the specified SMMA type.
Parameters:
src (float) : (series) Input series (series float), which can be close (`close`), open (`open`), high (`high`), low (`low`), or any other price-based series.
period (int) : (int) The number of periods used for MA calculation.
Returns: (float) The computed SMMA value or `na` if maType is invalid.
ComputeStochasticValue(src, periodD, periodK, smoothingMethod, smoothingPeriod)
ComputeStochasticValue
@description Computes the moving average (SMMA) value based on the specified SMMA type.
Parameters:
src (float) : (series) Input series (series float), which can be close (`close`), open (`open`), high (`high`), low (`low`), or any other price-based series.
periodD (simple int) : (int) The number of periods used for MA calculation.
periodK (int) : (int) The number of periods used for MA calculation.
smoothingMethod (string) : (string) The type of moving average: "EMA", "SMA", "RMA", "WMA", "HMA", "VWMA", "LinReg".
smoothingPeriod (simple int) : (int) The number of periods used for MA calculation.
Returns: (float) The computed Stochastic(K, D) value or `na` if maType is invalid.
FindSwingsByNeighborhood(arraySwingTop, arraySwingBottom, neighborhood)
Find Swings By Neighborhood
@description Computes the moving average (SMMA) value based on the specified SMMA type.
Parameters:
arraySwingTop (array) : (array): An array to store detected swing highs.
arraySwingBottom (array) : (array): An array to store detected swing lows.
neighborhood (int) : (int): The number of bars to consider when identifying a swing point.
Returns: none
FindSwingsByOffset(arraySwingTop, arraySwingBottom, minSwingLength)
Find Swings By Offset
@description Identifies swing points based on a minimum swing length criteria.
Parameters:
arraySwingTop (array) : (array): An array to store detected swing highs.
arraySwingBottom (array) : (array): An array to store detected swing lows.
minSwingLength (float) : (float): The minimum price movement required to qualify as a swing point.
Returns: none
SwingPoint
Fields:
Key (series int)
IsTop (series bool)
Price (series float)
BarStart (series int)
BarEnd (series int)
TimeStart (series int)
TimeEnd (series int)
Sign (series int)
Label (series label)

Sweep2Trade Pro [CHE]Sweep2Trade Pro \ — Liquidity Sweep → Trend → Confirmation
Sweep2Trade Pro \ helps you catch high-probability reversals or continuations that start with a liquidity sweep, align with the T3 trend, and finalize with a structure confirmation (BOS). It’s designed to reduce noise, time your entries, and keep you out of weak, chop-driven signals.
What’s a “sweep”?
A liquidity sweep happens when price briefly breaks a prior swing high/low (where many stops sit), triggers those stops, and then snaps back. This “stop-hunt” creates liquidity for bigger players and often precedes a sharp move in the opposite direction if the break fails, or fuels continuation if structure actually shifts.
What’s a BOS (Break of Structure)?
A BOS is a price action event where the market takes out a recent swing level in the trend’s direction, signaling continuation and confirming that structure has shifted (bullish BOS through a recent swing high, bearish BOS through a recent swing low).
How the indicator works (at a glance)
1. Regime Filter (T3 + R²)
T3 Moving Average: A smoother, faster-responding moving average that aims to reduce lag while filtering noise, so trend direction changes are clearer.
R² (Coefficient of Determination): Measures how “linear” the recent price path is (0→1). Higher values = stronger, cleaner trend; lower values = more chop. Used here to allow trades only when trend quality exceeds a user-set threshold.
2. Sweep Detection
Bullish sweep: price pokes below a prior swing low and closes back above it.
Bearish sweep: price pokes above a prior swing high and closes back below it.
Lookback length is configurable.
3. Sequence Lock (built-in FSM)
The script manages state in phases so you don’t jump the gun:
Phase 1: Sweep detected → wait for T3 to turn in the corresponding direction.
Phase 2: T3 direction confirmed → show “SWEEP OK” and wait for final confirmation.
Trade Signal: Only fires if confirmation arrives before a timeout.
4. Confirmation Layer
BOS via wick or close (you choose),
Strong close toward the signal (top/bottom quartile of the candle),
Optional “close above/below T3” condition.
These checks help avoid weak sweeps that immediately fade.
5. Alerts & Visuals
“SWEEP OK” markers show when the sweep + T3 direction align.
Final BUY/SELL arrows appear only when the confirmation layer passes.
Ready-made alert conditions for automation.
What you can do with it
Time reversals after sweeps: Enter when a stop-hunt fades and structure confirms.
Ride continuations: Use BOS with the T3 trend to pyramid or re-enter with structure on your side.
Filter chop: Let R² gate entries to periods with cleaner directional drift.
Automate: Use the included alerts with your platform or webhook setup.
Inputs (key settings)
Regime Filter
T3 Length / Volume Factor: Controls smoothness and responsiveness. Smaller length → faster, more sensitive; higher volume factor → smoother curve.
R² Lookback & Threshold: Length of the linear fit window and the minimum “trend quality” required. Higher thresholds mean fewer, cleaner signals.
Sweep / Sequence
Swing Lookback: How far back to define the “reference” high/low for sweeps.
Timeout: Maximum bars allowed between phases to keep signals fresh.
Restart timeout on Phase 2: Optional safety so entries don’t go stale.
Confirmation
BOS Lookback: Micro-pivot window for structure breaks.
Wick vs Close BOS: Conservative traders may prefer close.
Require close above/below T3: Tightens confirmation with trend alignment.
Practical guide (quick start)
1. Timeframe & markets: Works across majors, indices, and crypto. Start with 5m–1h intraday or 1h–4h swing; adjust R² threshold upward on noisier pairs.
2. Entry recipe (Long):
Bullish sweep of a prior low → T3 turns up → BOS/strong close.
Optional: enable “close above T3” for extra confirmation.
3. Entry recipe (Short): Mirror the above.
4. Stops: Common choices are just beyond the sweep wick (tighter) or past the BOS invalidation (safer).
5. Targets: Previous structural levels, measured move, or a T3 trail (exit when price closes back through T3).
6. Avoid low-quality contexts: If R² is very low, market is likely ranging erratically—skip or widen filters.
Tips & best practices
Context first: The same sweep means different things in a strong trend vs. flat regime; that’s why the T3+R² filter exists.
BOS choice: Wick-based BOS is earlier but noisier; close-based BOS is slower but cleaner. Tune per market.
Backtest -> Forward test: Validate settings per symbol/timeframe; then paper trade before going live.
Risk: Fixed fractional risk with asymmetric R\:R (e.g., 1:1.5–1:3) generally performs better than “all-in” discretionary sizing.
Behind the scenes (for the curious)
T3 is a multi-stage EMA construction that produces a smooth curve with reduced lag versus simple/standard EMAs.
R² is the square of correlation (0–1). Here it’s used as a moving gauge of how well price aligns to a linear path—our “trend quality” dial.
Stop-hunts / sweeps are a recognized microstructure phenomenon where clustered stops provide the liquidity that fuels the next move.
Disclaimer
No indicator guarantees profits. Sweep2Trade Pro \ is a decision aid; always combine with solid risk management and your own judgment. Backtest, forward test, and size responsibly.
The content provided, including all code and materials, is strictly for educational and informational purposes only. It is not intended as, and should not be interpreted as, financial advice, a recommendation to buy or sell any financial instrument, or an offer of any financial product or service. All strategies, tools, and examples discussed are provided for illustrative purposes to demonstrate coding techniques and the functionality of Pine Script within a trading context.
Any results from strategies or tools provided are hypothetical, and past performance is not indicative of future results. Trading and investing involve high risk, including the potential loss of principal, and may not be suitable for all individuals. Before making any trading decisions, please consult with a qualified financial professional to understand the risks involved.
By using this script, you acknowledge and agree that any trading decisions are made solely at your discretion and risk.
Enhance your trading precision and confidence 🚀
Happy trading
Chervolino

Custom Support & Resistance LevelsThe Smart Auto Trendline Indicator is designed to help traders quickly identify key market trends without the need for manual drawing. It automatically detects swing highs and lows, plots dynamic trendlines, and updates them in real-time as price evolves.
This tool is especially useful for traders who rely on trendline breakouts, pullback entries, or reversal confirmations. By simplifying chart analysis, it saves time and ensures more consistent results.
Key Features:
🔹 Automatic detection of valid swing highs and lows
🔹 Dynamic trendline plotting (auto-adjusts as price moves)
🔹 Highlights potential breakout and breakdown zones
🔹 Works on all timeframes and instruments (Forex, Stocks, Indices, Crypto)
🔹 Clean, non-intrusive design to keep charts clear
🔹 Customizable settings (line color, style, sensitivity)
How to Use:
Apply the indicator to your chart.
Observe automatically drawn trendlines.
Watch for breakouts above/below trendlines for trade entries.
Use in combination with other tools like RSI, MACD, or support/resistance for stronger confirmation.
Best For:
Breakout traders
Swing traders
Trend followers
Forex, Stocks, Crypto, Indices
Fractal Suite: MTF Fractals + BOS/CHOCH + OB + FVG + Targets Kese Way
Fractals (Multi-Timeframe): Automatically detects both current-timeframe and higher-timeframe Bill Williams fractals, with customizable left/right bar settings.
Break of Structure (BOS) & CHoCH: Marks structural breaks and changes of character in real time.
Liquidity Sweeps: Identifies sweep patterns where price takes out a previous swing high/low but closes back within range.
Order Blocks (OB): Highlights the last opposite candle before a BOS, with customizable extension bars.
Fair Value Gaps (FVG): Finds 3-bar inefficiencies with a minimum size filter.
Confluence Zones: Optionally require OB–FVG overlap for high-probability setups.
Entry, Stop, and Targets: Automatically calculates entry price, stop loss, and up to three take-profit targets based on risk-reward ratios.
Visual Dashboard: Mini on-chart table summarizing structure, last swing points, and settings.
Alerts: Set alerts for new fractals, BOS events, and confluence-based trade setups.

Swing Anchored Vwap [BigBeluga]🔵 OVERVIEW
Swing Anchored Vwap tracks the market’s directional behavior by anchoring VWAPs (Volume Weighted Average Price) to dynamically detected swing highs and lows. It visually distinguishes the active swing VWAP from historical ones—offering traders a clean view of trend-aligned value zones with clearly marked inflection points.
🔵 CONCEPTS
Swing Anchored VWAPs: VWAPs are initiated from recent swing highs during downtrends and swing lows during uptrends.
Trend Detection: The indicator identifies trend shifts based on the breaking of recent highest or lowest price value.
Trend-Based Coloring:
• Green VWAPs: are drawn from swing lows in uptrends.
• Blue VWAPs: are drawn from swing highs in downtrends.
Sensitivity Control: The Length input defines how far back the script looks to determine swing points—shorter lengths make it more reactive.
🔵 FEATURES
Real-time VWAP projection from the current swing point, updated live.
Historical VWAP traces with slightly faded color to emphasize the current active one.
Swing markers automatically placed on highs/lows where VWAPs are anchored.
Label with price value at the end of each active VWAP line for clarity.
Adaptive color scheme that visually separates uptrend/downtrend zones.
🔵 HOW TO USE
Use active VWAP as a dynamic support/resistance guide during ongoing trends.
Observe breaks or rejections around these VWAPs for trend continuation or reversal clues .
Compare current price position relative to swing VWAPs to assess trend maturity and extension .
Combine with volume analysis or structure to increase conviction at swing points.
🔵 CONCLUSION
Swing Anchored Vwap merges the logic of anchored VWAPs and swing structure into a responsive visual tool. It helps traders stay aligned with the current trend while offering historical context via previous value anchors—ideal for intraday to swing-level analysis.

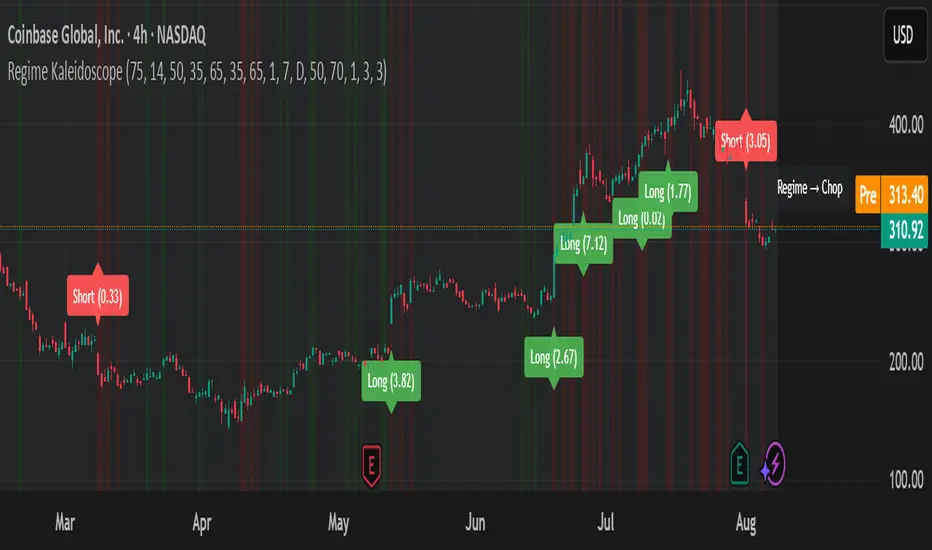
Regime KaleidoscopeWhat is Regime Kaleidoscope?
Regime Kaleidoscope is an advanced market regime visualizer and adaptive signal generator.
It helps traders instantly understand whether current market conditions are best for mean-reversion (fading price back to the mean) or breakout/trend-following (riding strong moves), using a data-driven, non-repainting approach.
How It Works
1. Regime Detection & Background Colors
The indicator analyzes both volatility (ATR) and the shape of each candle (body size vs. range) over a rolling window.
Each bar is classified into one of three regimes, and the chart’s background color changes accordingly:
Regime Background Color What It Means How to Use
Low Vol Balanced Green background Market is calm, compressed. More likely to revert back to mean. Look for mean-reversion signals only (fade moves).
High Vol Directional Red background Market is in a high-volatility, trending, or “breakout” state.
Red does NOT mean bearish. It simply means conditions are ripe for strong directional moves—either up or down. Look for breakout signals only (ride strong moves after structure break).
Chop Gray background Market is indecisive or transitioning between states. Signals are minimized or blocked. Best to wait or trade with extra caution.
→ Red background means high volatility/trending regime, not a signal direction!
Green means “mean-revert environment,” not always bullish!
Gray means “chop/transition”—usually best avoided.
2. Signals — How to Read and Trade Them
Mean-Reversion Signals (Green Regime Only):
Appear when price is stretched away from a rolling mean (SMA) by a configurable ATR-based threshold.
Optional: Only allowed in the direction of the higher-timeframe trend, if enabled.
Long signals: Fade extreme dips (look for triangle-up shapes & green labels).
Short signals: Fade extreme spikes (triangle-down shapes & red labels).
Labels show signal strength (distance from mean in ATR units).
Breakout Signals (Red Regime Only):
Only triggered when price breaks above or below a confirmed swing high or low (pivot), with a strong candle and optional trend confirmation.
Long signals: Breakout above last swing high (regardless of background color).
Short signals: Breakout below last swing low.
Labels show signal strength (distance from pivot in ATR units).
Red background does NOT mean sell— it means “trend environment”—so both long and short signals are possible, depending on which direction price is breaking out.
Signal Controls & Filtering:
Signals only fire at bar close (non-repainting), never intrabar or on future data.
ATR “floor” blocks signals when volatility is too low for meaningful moves.
Cooldown: Signals are limited to one per regime per direction for a minimum number of bars (user input).
Optional confirmation candles: Only strong reversals or breakouts count, reducing noise and whipsaws.
All signals are visible as triangle shapes below/above bars, and labeled with strength.
3. Visual Guide
Background color: Maps the regime, not buy/sell direction.
Transition label: Appears only when the regime changes, so you can see state shifts at a glance.
Triangle shapes & labels: Mark entry points; label gives strength.
Info table (optional): Shows regime and ATR at transitions.
Why is Regime Kaleidoscope Unique?
Uses rolling statistical percentiles of ATR and candle body shape for dynamic market state detection—not just a moving average or volatility band.
Separates regime from signal direction, so you always know “what mode the market is in” and when signals actually have a higher probability.
No repainting. All logic is strictly bar-close, confirmed pivots, and non-future-leaking.
Highly customizable—all thresholds, filters, trend confirmation, and cooldown are user inputs.
How To Use
Add to any chart.
Use the background color to identify if you’re in a mean-revert, breakout, or chop regime.
Take only the signals that match the regime:
Green = fade extremes, Red = ride breakouts, Gray = wait.
Tune settings for your asset and timeframe.
All signals are educational—always test before live use!
Past performance is not necessarily indicative of future results.
Test the indicator on your assets and timeframes. All signals are for educational use only.
BTC Fractal Momentum ExtremesDescription – BTC Fractal Momentum Extremes (BTCFME)
BTC Fractal Momentum Extremes (BTCFME) is a multi-factor, multi-method technical indicator designed to detect potential top and bottom reversal points in Bitcoin price action by integrating a confluence of unconventional signals. It combines fractals, adaptive momentum, volume dynamics, price velocity convergence, and market structure shifts — all filtered through real-time volatility and contextualized by temporal market conditions.
This tool is best used by traders looking to spot high-confidence turning points on intraday or swing timeframes, and works particularly well in volatile, momentum-driven environments.
Key Components & Methodology
BTCFME utilizes five independent signal-generation methods:
1. Fractal Volume Divergence
Detects reversal fractals in price (5-bar patterns) and validates them with volume anomalies:
Volume spikes (e.g., climax moves) or
Volume exhaustion (e.g., waning participation)
2. Adaptive Momentum Oscillator
Calculates momentum normalized by ATR-adjusted volatility, filtering out noise in choppy markets. It spots directional shifts when momentum inflects from extreme levels.
3. Market Structure Breaks
Identifies dynamic support and resistance using a configurable lookback, and flags potential breakouts or breakdowns from those levels.
4. Price Velocity Convergence
Analyzes the rate of change (velocity) and its acceleration. When both compress within a narrow volatility range, it signals a potential inflection zone.
5. Temporal Confluence Filter
Signals are only considered valid during active market hours (9 AM – 4 PM, excluding weekends) to reduce false positives during illiquid or inefficient trading periods.
Signal Logic & Sensitivity
Signals are generated when at least 3 out of 4 core methods agree, controlled by the Signal Sensitivity setting:
1 (High Sensitivity) = Trigger signals with fewer confirmations
5 (Low Sensitivity) = Require stronger multi-factor confluence
🔹 Buy (Bottom) Signals trigger when:
Bullish fractals appear
Momentum is deeply negative but improving
Price tests structure support
Velocity compresses below average
🔺 Sell (Top) Signals trigger when:
Bearish fractals with volume spikes appear
Momentum peaks and starts to decline
Price tests resistance
Velocity compresses near highs
Visual Features
Arrows: Buy signals = green arrow below candle. Sell signals = red arrow above candle.
Background Color: Indicates overall momentum regime (green = bullish bias, red = bearish, gray = neutral).
Dynamic Support & Resistance Lines: Based on recent swing highs/lows.
Signal Table (top-right): Shows real-time stats on:
Momentum value
Volatility factor
Volume strength (vs. 20-SMA)
Market structure status
Alerts
You can set alerts using the built-in conditions:
BTC Bottom Alert → Fires on potential market bottoms.
BTC Top Alert → Fires on potential market tops.
These alerts are filtered to avoid whipsaw conditions, by checking that opposite signals did not trigger in the last 2 candles.
How to Use
Timeframes: Best suited for 1H–4H and Daily BTC charts, but adaptable to others with parameter tuning.
Confirm with Price Action: Use BTCFME signals in conjunction with candlestick patterns or S/R zones for best results.
Adjust Sensitivity: Lower values catch more signals (good for scalping), higher values filter for stronger reversals (ideal for swing trades).
Use in Trending or Reversing Markets: BTCFME performs best during trending environments or volatile reversals — avoid during prolonged flat/ranging zones.
Notes & Recommendations
BTCFME is not a standalone buy/sell signal; combine it with risk management and trend confirmation tools.
Avoid using it during extremely low-volume sessions (e.g., late weekends).
Adjust parameters based on BTC's evolving volatility and your trading style.

ZigZag Based RSIDescription
ZigZag Trend RSI (ZZ-RSI) is an advanced momentum indicator that combines ZigZag-based trend detection with a trend-adjusted RSI to deliver smarter overbought and oversold signals. Unlike traditional RSI that reacts purely to price movement, this indicator adapts its sensitivity based on the prevailing trend structure identified via the ZigZag pattern.
By dynamically adjusting RSI thresholds according to market direction, ZZ-RSI helps filter out false signals and aligns RSI readings with broader trend context—crucial for trend-following strategies, counter-trend entries, and volatility-based timing.
Core Components
ZigZag Pattern Recognition:
Identifies significant swing highs and lows based on price deviation (%) and pivot sensitivity (length). The most recent pivot determines the prevailing trend direction:
🟢 Bullish: last swing is a higher high
🔴 Bearish: last swing is a lower low
⚪ Neutral: no recent significant movement
Trend-Weighted RSI:
Modifies traditional RSI input by emphasizing price changes in the direction of the trend:
In bull trends, upside moves are magnified.
In bear trends, downside moves are emphasized.
Dynamic RSI Zones:
Overbought and Oversold thresholds adapt to the trend:
In uptrends: higher OB and slightly raised OS → tolerate stronger rallies
In downtrends: lower OS and slightly reduced OB → accommodate stronger sell-offs
In neutral: default OB/OS values apply
How to Use
✅ Entries (Reversal or Mean Reversion Traders):
Look for oversold signals (green triangle) in downtrends or neutrals to catch potential reversals.
Look for overbought signals (red triangle) in uptrends or neutrals to fade momentum.
Confirm with price action or volume for higher conviction.
📈 Trend Continuation (Momentum or Trend-Followers):
Use the trend direction label (Bullish / Bearish / Neutral) to align your trades with the broader move.
Combine with moving averages or price structure for entry timing.
Avoid counter-trend signals unless confirmed by divergence or exhaustion.
🧠 Signal Interpretation Table (top right of chart):
Trend: Indicates the current market direction.
RSI: Real-time trend-adjusted RSI value.
Signal: OB/OS/Neutral classification.
Customization Options
ZigZag Length / Deviation %:
Adjust pivot sensitivity and filter out minor noise.
RSI Length:
Controls how fast RSI responds to trend-adjusted price.
Color Settings:
Personalize visual cues for trend direction and OB/OS backgrounds.
Alerts Included
📢 Overbought/oversold conditions
🔄 Trend reversals (bullish or bearish shift)
These alerts are ideal for automated strategies, mobile notifications, or algorithmic workflows.
Ideal For
Traders seeking smarter RSI signals filtered by market structure
Trend-followers and swing traders looking for reliable reversals
Those frustrated with false OB/OS signals in volatile or trending markets
Best Practices
Use in confluence with price structure, trendlines, or S/R levels.
For intraday: consider lowering ZigZag Length and RSI Length.
For higher timeframes: use higher deviation % and smoother RSI to reduce noise.

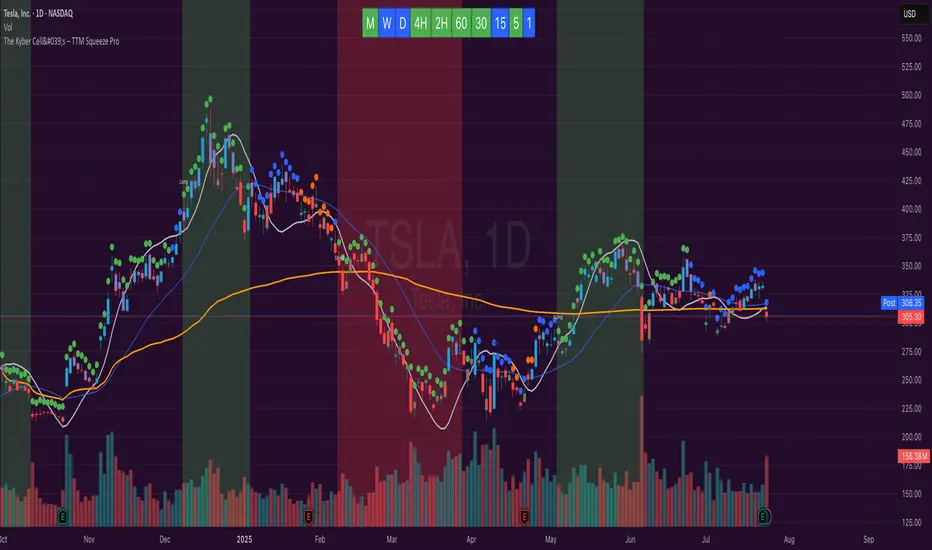
The Kyber Cell's – TTM Squeeze ProThe Kyber Cell’s TTM Squeeze Pro
TTM Squeeze + ALMA + VWAP for Precision Trade Timing
⸻
1. Introduction
Kyber Cell’s Squeeze Pro is a comprehensive, all-in-one overlay indicator built on top of John Carter’s famous TTM Squeeze concept. It integrates advanced momentum and trend analysis using Arnaud Legoux Moving Averages (ALMA), a scroll-aware VWAP with optional deviation bands, and a clean, user-friendly visual system. The goal is simple: give traders a clear and configurable chart that identifies price compression, detects release moments, confirms direction, and helps manage risk and reward visually and effectively.
This tool is intended for traders of all styles — scalpers, swing traders, or intraday strategists — looking for cleaner signals, better visual cues, and more confidence in entry/exit timing.
⸻
2. Core Concepts
At its heart, the Squeeze Pro builds an in-chart visualization of the TTM Squeeze, a strategy that identifies when price volatility compresses inside a Bollinger Band that is narrower than a Keltner Channel. These moments often precede explosive breakouts. This version categorizes squeezes into three levels of compression:
• Blue Dot – Low Compression
• Orange Dot – Medium Compression
• Red Dot – High Compression
When the squeeze “fires” (i.e., the Bollinger Bands expand beyond all Keltner thresholds), the indicator flips to a Green Dot, signaling potential entry if confirmed by trend direction.
The indicator also includes a momentum model using linear regression on smoothed price deviation to determine directional bias. Momentum is further reinforced by a customizable trend engine, allowing you to switch between EMA-21 or HMA 34/144 logic.
An ALMA ribbon is plotted across the chart to represent smoothed trend strength with minimal lag, and a scroll-aware VWAP (Volume-Weighted Average Price) line, optionally with ±σ bands, helps confirm mean-reversion or momentum continuation setups.
⸻
3. Visual Components
Squeeze Pro replaces the traditional histogram with bar coloring logic based on your selected overlay mode:
• Momentum Mode colors bars based on whether momentum is rising or falling and in which direction (aqua/blue for bullish, red/yellow for bearish).
• Trend Mode colors bars using EMA or HMA logic to identify whether price is in a bullish, bearish, or neutral trend state.
A colored backdrop is triggered when a squeeze fires and momentum direction is confirmed. It remains green for bullish runs and red for bearish runs. The background disappears when the trend exhausts or reverses.
Each squeeze level (low, medium, high) is plotted as tiny dots above or below candles, with configurable colors. On the exact bar where the squeeze fires, the indicator optionally plots entry markers — either arrows or triangles — which can be placed with adjustable padding using ATR. These provide an at-a-glance signal of possible long or short entries.
EXPERIMENTAL : For risk and reward management, protective stop lines and limit targets can be toggled on. Stops are calculated using either recent swing highs/lows or a fixed ATR multiple, depending on user preference. Limit targets are calculated from entry price using ATR-based projections.
All colors are customizable.
⸻
4. Multi-Timeframe Squeeze Panel
An optional MTF Squeeze Panel appears in the top-right corner of the chart, displaying the squeeze status across multiple timeframes — from 1-minute to Monthly. Each timeframe is color-coded:
• Red for High Compression
• Orange for Medium Compression
• Blue for Low Compression
• Yellow for Open/No Compression
This provides rapid context for whether multiple timeframes are simultaneously compressing (a common precursor to explosive moves), helping traders align higher- and lower-timeframe signals. Colors are customizable.
The MTF panel dynamically adjusts to chart space and only renders the selected intervals for clarity and performance.
⸻
5. Inputs and Configuration Options
Squeeze Pro offers a rich configuration suite:
• Squeeze Settings: Control the Bollinger Band standard deviation, and three separate Keltner Channel multipliers (for low, medium, and high compression zones).
• ALMA Controls: Adjust the smoothing length, offset, and σ factor to control ribbon sensitivity.
• VWAP Options: Toggle VWAP on/off and optionally show ±σ bands for mean reversion signals.
• Entry Markers: Customize marker shape (arrow or triangle), size (tiny to huge), color, and padding using ATR multipliers.
• Stops and Targets:
• Choose between Swing High/Low or ATR-based stop logic.
• Define separate ATR lengths and multipliers for stops and targets.
• Independently toggle their visibility and color.
• Bar Coloring Mode: Select either Momentum or Trend logic for bar overlays.
• Trend Engine: Choose between EMA-21 or HMA 34/144 for identifying trend direction.
• Squeeze Dot Colors: Customize the colors for each compression level and release state.
• MTF Panel: Toggle visibility per timeframe — from 1m to Monthly.
This high degree of customization ensures that the indicator can adapt to nearly any trading style or preference.
⸻
6. Trade Workflow Suggestions
To get the most out of this tool, traders can follow a consistent workflow:
1. Watch Dot Progression: Blue → Orange → Red indicates increasing compression and likelihood of breakout.
2. Enter on Green Dot: When the squeeze fires (green dot), confirm entry direction with bar color and backdrop.
3. Use Confirmation Tools:
• ALMA should slope in the trade direction.
• VWAP should support the price move or confirm expansion away from mean.
4. Manage Risk and Reward (experimental):
• Respect stop-loss placements (Swing/ATR).
• Use ATR-based limit targets if enabled.
5. Exit:
• Consider exiting when momentum crosses zero.
• Or exit when the background color disappears, signaling potential trend exhaustion.
⸻
7. Alerts
Includes built-in alert conditions to notify you when a squeeze fires in either direction:
• “Squeeze Long”: Triggers when a green dot appears and momentum is bullish.
• “Squeeze Short”: Triggers when a green dot appears and momentum is bearish.
You can use these alerts for automation or to stay notified of new setups even when away from the screen.
⸻
8. Disclaimer
This indicator is designed for educational purposes only and should not be interpreted as financial advice. Trading is inherently risky, and any decisions based on this tool should be made with full awareness of personal risk tolerance and capital exposure.
Order-Flow Market StructureOrder-Flow Market Structure by The_Forex_Steward
A precision tool for visualizing internal shifts, swing structure, BOS events, Fibonacci levels, and multi-timeframe alerts.
What It Does
The Order-Flow Market Structure indicator intelligently tracks and visualizes price structure using higher timeframe candles. It automatically detects:
• Internal bullish and bearish structure shifts
• Swing highs and lows (HH, HL, LH, LL)
• Break of Structure (BoS) confirmations
• Fibonacci retracement levels from recent swing moves
• Real-time alerts across LTF, MTF, and HTF modes
It’s a complete tool for traders who follow Smart Money Concepts, ICT, or institutional price action strategies.
How It Works
• You select a Higher Timeframe (HTF) to set the structural context
• Internal shifts are identified using HTF candle closes
• The indicator scans for swing highs/lows after each internal shift
• Breaks of previous swing points confirm BoS and plot horizontal lines
• Zigzag lines visually connect structural points (swings and BoS)
• Fibonacci levels are drawn between the latest swings
• Alerts can be configured for structure shifts, BoS events, and fib level breaks
How to Use It
Set your preferred HTF (e.g., 1H while trading on 5-minute)
Enable Fibonacci levels to visualize retracement zones
Watch for:
• Bullish internal shifts → HL to HH
• Bearish internal shifts → LH to LL
• BOS → Breakout confirmation
Enable alerts to catch structural events in real-time
Adjust the "Safe History Offset" if working with long lookbacks or volatile assets
Who It's For
• Traders using Smart Money, ICT, or market structure-based systems
• Scalpers, day traders, and swing traders
• Anyone needing precise structural insight across multiple timeframes
Features
• BoS detection with custom line styles and width
• HH, HL, LH, LL label plotting
• Optional Fibonacci retracement zones
• Custom alerts for swing shifts and fib level breaks
• LTF, MTF, and HTF alert modes
Stay aligned with structure, trade with precision, and get alerted to key shifts in real time.

Fair Value MSThis indicator introduces rigid rules to familiar concepts to better capture and visualize Market Structure and Areas of Support and Resistance in a way that is both rule-based and reactive to market movements.
Typical "Market Structure" or "Zig-Zag" methods determine swing points based on fixed thresholds (length or percentage). While this does provide rigid structure, the results may be lagging or confusing due to the timing, since it is fixed to static parameters.
I believe the concept of Fair Value Gaps can solve this problem.
As you will notice, there are no length settings in this indicator.
> FVG Market Structure
Fair Value Gaps are a well known concept used to indicate directional intent, forming when price moves aggressively in one direction, leaving behind an imbalance between buyers and sellers. While the term FVG was popularized by ICT, the underlying concept predates them, known historically as imbalances, inefficiencies, or liquidity voids in institutional trading.
Note: For simplicity, in this indicator they'll be called FVGs.
By reading into this, we are able to clearly and rigidly define market structure simply by "looking" at the chart, using objective price events rather than subjective interpretation, or lengths.
By using FVGs to determine structure direction, the length, and speed of identification lies entirely on the market. If an FVG Down occurs immediately after a New Higher High forms, it is reasonable to assume there was a seller at that point, so the script would indicate a New Swing High.
The script is NOT stuck, waiting for a % retrace, or # bars to pass to identify it as such.
Sometimes the market is in a steady trend in a single direction and no FVGs form; therefore, no structure forms. -> Why would we try to impose structure on a clear trend?
Ultimately, the FVG Structure Method uses real reactions from the market to determine Market structure, and is not fixed to specific parameters.
As with other market structure indicators, "Market Structure Breaks" are still identifiable when price moves outside the most recent swing points.
These are helpful to indicate larger direction. In the following section you will see how these help us determine when we should start the search for an "Area of Interest (AOI)".
> Areas of Interest (AOIs)
"Area of Interest (AOI)" is a generalized term, and could refer to many types of zones you might recognize under different names. While the AOIs in this indicator are specialized in their own way, I have chosen to simply use the term "Area of Interest" because it’s more important to understand how they behave and why they exist than to focus on what they’re called.
The goal of an AOI is to point out reasonable areas where buyers or sellers may be staging, as is typical with support and resistance.
In order to reasonably identify these areas, we look for cause and effect relationships. When considering these relationships, it's easier to understand the placement of the points to define each zone.
(Buyer Examples)
Cause: Strong Buyers step in at Swing Low
Effect: Fair Value Gap Forms
Cause: Sustained Buying Pressure
Effect: Market Structure Breaks
In this example, The zone is drawn from the Swing Low, to the Bottom of the FVG closest to the swing point.
In theory, the participation at the swing point was strong and aggressive enough to create the FVG imbalance. Which then found acceptance and continued into a Market Structure Break. So with these AOIs, we are trying to locate the aggressive Buyers or Sellers which were positioned BEFORE the FVG.
These Zones are intended to act as areas to look for reactions from market participants, to judge where price may be going. When revisiting these zones, we look for a reaction or a break, to further provide us information to if the buyers or sellers are still there.
As seen in the screenshot above, The information we gain is not from the creation of these zones, but from the behavior we witness when these zones are revisited.
Technical Note: In this indicator, Market Structure Breaks are only considered when price closes outside the recent swing points. Wicks are not considered as confirmation, therefore are not used to detect structural breaks.
Inside each AOI you can optionally display a readout of the volume which accumulated during the time starting at the swing point and going until the closing bar of the FVG.
Note: We are counting volume until the closing bar of the FVG since the FVG is a 3 bar formation, and aggressive volume is required throughout to create the imbalance.
There are multiple FVGs that typically occur in a single direction, but we do not look to every single one to be indicative of structure, only the first FVG in the opposite direction of the previous direction (which is determined by previous FVGs)
You will probably notice, the AOIs do not form from the closest swing or FVG to the break, this is because we are targeting larger directional changes to draw these AOIs from.
Since they do not always happen perfectly every time, the AOI formation waits for an FVG to occur AND a Market structure break to happen. One without the other will result in no Zone displaying.
> Reflection Lines
While they may seem slightly redundant, Reflection Lines serve as reminders of previous support and resistance pivots. They are drawn at the same Pivots where and AOI is formed, and extend beyond the mitigation of the AOI.
These lines are often points of price to look for "Support Flips", a re-test pattern where price trades through previous support (or resistance) then returns to it and rejects, continuing into a larger move or trend.
Their namesake is based on the behavior of price, "reflecting" at these levels.
The Reflection lines are simple and change color based on price's location.
If price is above, we would typically look to a reflection line in with support in mind.
As a basic filter, these lines use an average price to determine their color, this way they will not change their color as frequently in choppy situations.
> Session Start/End Lines
For analysis purposes and trade review, it is helpful to analyze with context.
For that reason, I have implemented start and end session lines into the indicator, these are helpful when reviewing historical charts to not provide additional context.
By default, they are set to the NYSE Session, but can be changed to fit any needs.
These lines are not advanced, and simply draw a line as the chart passes the start and end of the sessions. It's very likely that you may need to adjust the session for your specific needs.
Note: The Timezone can be adjusted within the code if needed. By Default, the indicator uses "America/New_York" Timezone.
> Conclusion
If you’ve ever felt like your structure tools were confusing or lagging, drawing zones too late, or zones that simply don't make sense, this should feel like a breath of fresh air.
By removing arbitrary length settings and instead using FVGs to define structure and as a basis for AOIs, you're getting a more accurate look at what price is doing and where it's reacting from.
This indicator is rule-based, reactive, and aims to keep things logical without fluff or false confidence.
Enjoy!

Fractal Pullback Market StructureFractal Pullback Market Structure
Author: The_Forex_Steward
License: Mozilla Public License 2.0
The Fractal Pullback Market Structure indicator is a sophisticated price action tool designed to visualize internal structure shifts and break-of-structure (BoS) events with high accuracy. It leverages fractal pullback logic to identify market swing points and confirm whether a directional change has occurred.
This indicator detects swing highs and lows based on fractal behavior, drawing zigzag lines to connect these key pivot points. It classifies and labels each structural point as either a Higher High (HH), Higher Low (HL), Lower High (LH), or Lower Low (LL). Internal shifts are marked using triangle symbols on the chart, distinguishing bullish from bearish developments.
Break of Structure events are confirmed when price closes beyond the most recent swing high or low, and a horizontal line is drawn at the breakout level. This helps traders validate when a structural trend change is underway.
Users can configure the lookback period that defines the sensitivity of the pullback detection, as well as a timeframe multiplier to align the logic with higher timeframes such as 4H or Daily. There are visual customization settings for the zigzag lines and BoS markers, including color, width, and style (solid, dotted, or dashed).
Alerts are available for each key structural label—HH, HL, LH, LL—as well as for BoS events. These alerts are filtered through a selectable alert mode that separates signals by timeframe category: Low Timeframe (LTF), Medium Timeframe (MTF), and High Timeframe (HTF). Each mode allows the user to receive alerts only when relevant to their strategy.
This indicator excels in trend confirmation and reversal detection. Traders can use it to identify developing structure, validate internal shifts, and anticipate breakout continuation or rejection. It is particularly useful for Smart Money Concept (SMC) traders, swing traders, and those looking to refine entries and exits based on price structure rather than lagging indicators.
Visual clarity, adaptable timeframe logic, and precise structural event detection make this tool a valuable addition to any price action trader’s toolkit.

Price Ranged FVG📌 Price Ranged FVG
Is a clean and efficient tool designed to detect Fair Value Gaps (FVGs) with adjustable filters and structural context. It’s especially useful for traders looking to filter out insignificant gaps and focus on high-probability areas, particularly around swing breaks or structural shifts.
🧠 What is a Fair Value Gap (FVG)?
A Fair Value Gap appears when there’s a price imbalance between candles — typically after a strong move — where the market skips over certain price levels without trading there. These zones can act as potential areas for price to return to (mean reversion), or serve as support/resistance depending on market structure.
🔍 FVG Detection Types
You can choose between three different detection modes under the "FVG Detection" input:
Same Type: Only detects FVGs where the last 3 candles are in the same direction (all bullish or all bearish).
All: Detects any FVG, regardless of candle direction.
Twin Close: Detects FVGs only when the last two candles are in the same direction and close accordingly — offering a stricter confirmation.
🎯 FVG % Filters
To filter out noise or insignificant gaps, this indicator includes:
Minimum FVG % Filter: Ignores FVGs smaller than your specified percentage of the current close.
Maximum FVG % Filter: Ignores overly large gaps that may be unreliable or caused by anomalies.
These filters help focus on relevant FVGs that are more likely to act as reaction zones.
🏛 Structural Context (Swing Highs and Lows)
The indicator plots swing highs and swing lows with dots to provide structure-based context:
Set Swing Strength to 3 for detecting internal structure (shorter-term moves).
Use a higher setting like 5 to focus on external structure (more significant highs/lows).
These levels can help you determine whether an FVG is forming within a consolidation, breakout, or key structural transition.
✅ Use Case (My Personal Workflow)
I personally use this indicator to:
Filter out weak or irrelevant FVGs using the % filters.
Watch for price interaction at swing breaks — especially when an FVG aligns with a break in internal or external structure.
Refine entry and exit planning in confluence with other tools or strategies.
⚠️ Disclaimer
This indicator is not financial advice. It is a technical analysis tool intended to support your own decision-making process. Always do your own research and risk management.

Multi-Timeframe PivotDescription:
This script provides an advanced tool for multi-timeframe pivot point
analysis. It identifies swing points based on a candle's relationship to
its neighbors. The default strength settings of 1 align with the Inner
Circle Trader (ICT) concept of market structure.
The ICT concept defines a swing point based on a simple 3-candle pattern:
- A swing high is a candle where the candles to the immediate left and right
both have lower highs.
- A swing low is a candle where the candles to the immediate left and right
both have higher lows.
A key feature is its ability to accurately calculate and translate pivot
points from up to five higher timeframes (HTFs) and display them
precisely on a lower timeframe (LTF) chart.
NOTE: This indicator is designed to show HTF data on an LTF chart.
If you select a timeframe in the settings that is lower than your
current chart's timeframe, it will show pivots for the chart's
timeframe instead.
Core Features:
- Up to five independent higher timeframes.
- Per-timeframe customization for pivot strength (left/right bars) and color.
- Optional "Watchlines" that project the price of each pivot forward,
complete with a text label identifying the timeframe.
- An optional "Alignment Model" that colors the background when price is
aligned across all active timeframes (requires at least 2 TFs to be enabled).
Default State:
For a clean initial application, the Watchlines and Alignment Model features
are disabled by default but can be enabled in the settings.

Structure Break + Confirmation (First Signal Only)Swing Detection:
A Swing High is detected when the high of the central candle (based on a lookback period) is greater than the highs of the candles before and after.
A Swing Low is detected when the low of the central candle is lower than the lows of the candles before and after.
Break of Structure (BOS):
A BOS Up is confirmed when a candle closes above the most recent swing high (with a body close).
A BOS Down is confirmed when a candle closes below the most recent swing low.
Confirmation (CONF):
A CONF Up is triggered when price makes a new high after a BOS Up.
A CONF Down is triggered when price makes a new low after a BOS Down.
Only the first confirmation after a BOS is plotted.
Visuals:
Cross marks (×) are plotted at swing points.
BOS signals are shown with green (up) and red (down) labels.
CONF signals are shown with lime (up) and orange (down) triangle markers.
Dotted lines are drawn at the levels of broken swing highs/lows.
BOS mark-out (by Lumiere)Advanced BOS Detection with Strict Swing Confirmation
This indicator implements BOS detection with several unique features:
🔹 Dual-Candle Swing Validation - Unlike most BOS indicators that use single candle swings, this uses a two-candle confirmation for swing highs/lows, analyzing both the candle wicks and body transitions.
🔹 Directional Lock System - Implements a state machine that prevents duplicate signals until an opposite-direction BOS occurs, reducing noise.
🔹 Precision Wick Analysis - Compares wicks between the reversal candle and confirmation candle to identify the true swing point.
🔹 Real-Time Update & Live Market Adaptation – The indicator continuously monitors price action and instantly updates BOS signals as new candles form, ensuring you never miss a BOS.
How It Differs From Other BOS Indicators:
Most public BOS indicators use simple HH/HL or LH/LL detection.
Many don't implement the directional locking mechanism.
Few use the two-candle wick comparison approach.
Wick-Based Precision uses the extreme wicks of two candles (not just the body).
Strict Confirmation requires a close beyond the swing point (no "wick breaks" counted).
Usage Examples:
🟦 Bullish BOS:
A green candle closes, followed by a red candle. This will be the new high, and if the next candle closes above the highest wick of those two, it will be a BOS (only if we had a bearish BOS before)
🟥 Bearish BOS:
A red candle closes, followed by a green candle. This will be the new low, and if the next candle closes below the lowest wick of those two, it will be a BOS (only if we had a Bullish BOS before)

(Mustang Algo) Stochastic RSI + Triple EMAStochastic RSI + Triple EMA (StochTEMA)
Overview
The Stochastic RSI + Triple EMA indicator combines the Stochastic RSI oscillator with a Triple Exponential Moving Average (TEMA) overlay to generate clear buy and sell signals on the price chart. By measuring RSI overbought/oversold conditions and confirming trend direction with TEMA, this tool helps traders identify high-probability entries and exits while filtering out noise in choppy markets.
Key Features
Stochastic RSI Calculation
Computes a standard RSI over a user-defined period (default 50).
Applies a Stochastic oscillator to the RSI values over a second user-defined period (default 50).
Smooths the %K line by taking an SMA over a third input (default 3), and %D is an SMA of %K over another input (default 3).
Defines oversold when both %K and %D are below 20, and overbought when both are above 80.
Triple EMA (TEMA)
Calculates three successive EMAs on the closing price with the same length (default 9).
Combines them using TEMA = 3×(EMA1 – EMA2) + EMA3, producing a fast-reacting trend line.
Bullish trend is identified when price > TEMA and TEMA is rising; bearish trend when price < TEMA and TEMA is falling; neutral/flat when TEMA change is minimal.
Signal Logic
Strong Buy: Previous bar’s Stoch RSI was oversold (both %K and %D < 20), %K crosses above %D, and TEMA is in a bullish trend.
Medium Buy: %K crosses above %D (without requiring oversold), TEMA is bullish, and previous %K < 50.
Weak Buy: Previous bar’s %K and %D were oversold, %K crosses above %D, TEMA is flat or bullish (not bearish).
Strong Sell: Previous bar’s Stoch RSI was overbought (both %K and %D > 80), %K crosses below %D, and TEMA is bearish.
Medium Sell: %K crosses below %D (without requiring overbought), TEMA is bearish, and previous %K > 50.
Weak Sell: Previous bar’s %K and %D were overbought, %K crosses below %D, TEMA is flat or bearish (not bullish).
Visual Elements on Chart
TEMA Line: Plotted in cyan (#00BCD4) with a medium-thick line for clear trend visualization.
Buy/Sell Markers:
BUY STRONG: Lime label below the candle
BUY MEDIUM: Green triangle below the candle
BUY WEAK: Semi-transparent green circle below the candle
SELL STRONG: Red label above the candle
SELL MEDIUM: Orange triangle above the candle
SELL WEAK: Semi-transparent orange circle above the candle
Candle & Background Coloring: When a strong buy or sell signal occurs, the candle body is tinted (semi-transparent lime/red) and the chart background briefly flashes light green (buy) or light red (sell).
Dynamic Support/Resistance:
On a strong buy signal, a green dot is plotted under that bar’s low as a temporary support marker.
On a strong sell signal, a red dot is plotted above that bar’s high as a temporary resistance marker.
Alerts
Strong Buy Alert: Triggered when Stoch RSI is oversold, %K crosses above %D, and TEMA is bullish.
Strong Sell Alert: Triggered when Stoch RSI is overbought, %K crosses below %D, and TEMA is bearish.
General Buy Alert: Triggered on any bullish crossover (%K > %D) when TEMA is not bearish.
General Sell Alert: Triggered on any bearish crossover (%K < %D) when TEMA is not bullish.
Inputs
Stochastic RSI Settings (group “Stochastic RSI”):
K (smoothK): Period length for smoothing the %K line (default 3, minimum 1)
D (smoothD): Period length for smoothing the %D line (default 3, minimum 1)
RSI Length (lengthRSI): Number of bars used for the RSI calculation (default 50, minimum 1)
Stochastic Length (lengthStoch): Number of bars for the Stochastic oscillator applied to RSI (default 50, minimum 1)
RSI Source (src): Price source for the RSI (default = close)
TEMA Settings (group “Triple EMA”):
TEMA Length (lengthTEMA): Number of bars used for each of the three EMAs (default 9, minimum 1)
How to Use
Add the Script
Copy and paste the indicator code into TradingView’s Pine Editor (version 6).
Save the script and add it to your chart as “Stochastic RSI + Triple EMA (StochTEMA).”
Adjust Inputs
Choose shorter lengths for lower timeframes (e.g., intraday scalping) and longer lengths for higher timeframes (e.g., swing trading).
Fine-tune the Stochastic RSI parameters (K, D, RSI Length, Stochastic Length) to suit the volatility of the instrument.
Modify TEMA Length if you prefer a faster or slower moving average response.
Interpret Signals
Primary Entries/Exits: Focus on “BUY STRONG” and “SELL STRONG” signals, as they require both oversold/overbought conditions and a confirming TEMA trend.
Confirmation Signals: Use “BUY MEDIUM”/“BUY WEAK” to confirm or add to an existing position when the market is trending. Similarly, “SELL MEDIUM”/“SELL WEAK” can be used to scale out or confirm bearish momentum.
Support/Resistance Dots: These help identify recent swing lows (green dots) and swing highs (red dots) that were tagged by strong signals—useful to place stop-loss or profit-target orders.
Set Alerts
Open the Alerts menu (bell icon) in TradingView, choose this script, and select the desired alert condition (e.g., “BUY Signal Strong”).
Configure notifications (popup, email, webhook) according to your trading workflow.
Notes & Best Practices
Filtering False Signals: By combining Stoch RSI crossovers with TEMA trend confirmation, most false breakouts during choppy price action are filtered out.
Timeframe Selection: This indicator works on all timeframes, but shorter timeframes may generate frequent signals—consider higher-timeframe confirmation when trading lower timeframes.
Risk Management: Always use proper position sizing and stop-loss placement. An “oversold” or “overbought” reading can remain extended for some time in strong trends.
Backtesting/Optimization: Before live trading, backtest different parameter combinations on historical data to find the optimal balance between sensitivity and reliability for your chosen instrument.
No Guarantee of Profits: As with any technical indicator, past performance does not guarantee future results. Use in conjunction with other forms of analysis (volume, price patterns, fundamentals).
Author: Your Name or Username
Version: 1.0 (Pine Script v6)
Published: June 2025
Feel free to customize input values and visual preferences. If you find bugs or have suggestions for improvements, open an issue or leave a comment below. Trade responsibly!

ZigZag ProZigZag Pro is a precise market structure indicator that automatically detects two independent ZigZag patterns and highlights breakouts whenever significant highs or lows are breached.
The indicator calculates two separate ZigZag structures in real time. ZigZag1 captures the broader market swings and is ideal for trend or swing trading. ZigZag2 is optional and reacts more quickly – perfect for intraday or scalping setups. Both layers are fully customizable in terms of depth, color, and line width.
What makes this tool especially useful: whenever a previous swing high (for long trades) or swing low (for short trades) is broken, the indicator draws a horizontal breakout line on the chart. This makes it easy to spot structural breakouts and take advantage of potential momentum moves.
ZigZag Pro is designed for traders who rely on clean, rule-based market structure — whether you're trading classic breakouts, smart money concepts, or simply want a clearer view of trend shifts. The visuals are minimal, responsive, and suitable for any timeframe.

Enhanced BTC Order Block IndicatorThe script you provided is an "Enhanced BTC Order Block Indicator" written in Pine Script v5 for TradingView. It is designed to identify and visually mark Order Blocks (OBs) on a Bitcoin (BTC) price chart, specifically tailored for a high-frequency scalping strategy on the 5-minute (M5) timeframe. Order Blocks are key price zones where institutional traders are likely to have placed significant buy or sell orders, making them high-probability areas for reversals or continuations. The script incorporates customizable filters, visual indicators, and alert functionality to assist traders in executing the strategy outlined earlier.
Key Features and Functionality
Purpose:
The indicator detects bullish Order Blocks (buy zones) and bearish Order Blocks (sell zones) based on a predefined percentage price movement (default 0.5–1%) and volume confirmation.
It marks these zones on the chart with colored boxes and provides alerts when an OB is detected.
User-Configurable Inputs:
Price Move Range: minMovePercent (default 0.5%) and maxMovePercent (default 1.0%) define the acceptable price movement range for identifying OBs.
Volume Threshold: volumeThreshold (default 1.5x average volume) ensures OB detection is backed by significant trading activity.
Lookback Period: lookback (default 10 candles) determines how many previous candles are analyzed to find the last candle before a strong move.
Wick/Body Option: useWick (default false) allows users to choose whether the OB zone is based on the candle’s wick or body.
Colors: bullishOBColor (default green) and bearishOBColor (default red) set the visual appearance of OB boxes.
Box Extension: boxExtension (default 100 bars) controls how far the OB box extends to the right on the chart.
RSI Filter: useRSI (default true) enables an RSI filter, with rsiLength (default 14), rsiBullishThreshold (default 50), and rsiBearishThreshold (default 50) for trend confirmation.
M15 Support/Resistance: useSR (default true) and srLookback (default 20) integrate M15 timeframe swing highs and lows for additional OB validation.
Core Logic:
Bullish OB Detection: Identifies a strong upward move (0.5–1%) with volume above the threshold. It then looks back to the last bearish candle before the move to define the OB zone. RSI > 50 and proximity to M15 support/resistance (optional) enhance confirmation.
Bearish OB Detection: Identifies a strong downward move (0.5–1%) with volume confirmation, tracing back to the last bullish candle. RSI < 50 and M15 resistance proximity (optional) add validation.
The OB zone is drawn as a rectangle from the high to low of the identified candle, extended rightward.
Visual Output:
Boxes: Uses box.new to draw OB zones, with left set to the previous bar (bar_index ), right extended by boxExtension, top and bottom defined by the OB’s high and low prices. Each box includes a text label ("Bullish OB" or "Bearish OB") and is semi-transparent.
Colors distinguish between bullish (green) and bearish (red) OBs.
Alerts:
Global alertcondition definitions trigger notifications for "Bullish OB Detected" and "Bearish OB Detected" when the respective conditions are met, displaying the current close price in the message.
Helper Functions:
f_priceChangePercent: Calculates the percentage price change between open and close prices.
isNearSR: Checks if the price is within 0.2% of M15 swing highs or lows for support/resistance confluence.
How It Works
The script runs on each candle, evaluating the current price action against the user-defined criteria.
When a bullish or bearish move is detected (meeting the percentage, volume, RSI, and S/R conditions), it identifies the preceding candle to define the OB zone.
The OB is then visualized on the chart, and an alert is triggered if configured in TradingView.
Use Case
This indicator is tailored for your BTC scalping strategy, where trades last 1–15 minutes targeting 0.3–0.5% gains. It helps traders spot institutional order zones on the M5 chart, confirmed by secondary M1 analysis, and integrates with your use of EMAs, RSI, and volume. The customizable settings allow adaptation to varying market conditions or personal preferences.
Limitations
The M15 S/R detection is simplified (using swing highs/lows), which may not always align perfectly with manual support/resistance levels.
Alerts depend on TradingView’s alert system and require manual setup.
Performance may vary with high volatility or low-volume periods, necessitating parameter adjustments.
