Nemesis Swing High Low Support/Resistance Pivot Points by ZekisNemesis Swing High Low Support and Resistance Pivot Points Channel
An indicator that project support and resistance, highs and lows and pivot points
There are a lot of strategies where it can be used, a little google or youtube search for more infos
I colored with black the channel and green when the price breaks the resistance and red when breaks the support for a better view
Values for support and resistance can be adjusted
*Soon i will add alerts for breakeouts
Enjoy!
@ Zekis
Pesquisar nos scripts por "swing high low"

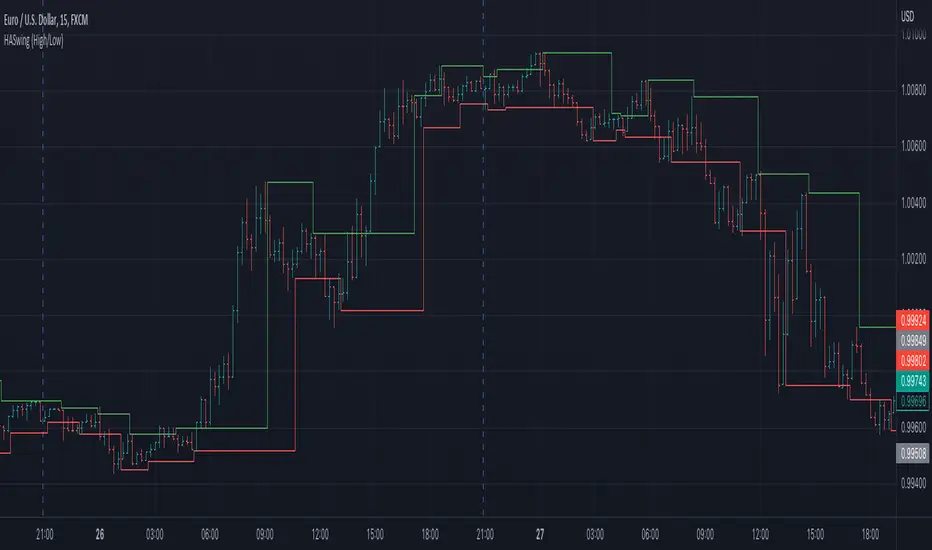
Heiken Ashi Swing High/LowIt uses Heiken Ashi candles to detect recent swing high and low.
It can be used as a stop-loss or support/resistance indicator.
Poseidon - [Swing High Low][Support and Resistance][Reversal]...A great indicator with tons of usages for technical analysis
Act as:
* Support and Resistance (It can be used as breakouts only if you drag the line manualy, it will never break it by itself)
* Swing points
* Reversal point (The candle will reverse in 90% in cases)
* Tops and Bottoms (It finds highest and lowest points)
... and many more TA for strategies
Combined with RSI will give even better overview of the chart
Play with values till you find what your needs are
The bigger value is, the more accurate points will be
(There is no such as magic indicators, you need to do your job, you need to know what are you doing before enter in real life!)
Cheers!
@Zekis

Spartan trading swing high low with htf openspartan trading swing high low with htf open and htf market structure

Swing High/Low with Liquidity Sweeps🧠 Overview
This indicator identifies swing highs and swing lows based on user-defined candle lengths and checks for liquidity sweeps—situations where the price breaks a previous swing level but then closes back inside, indicating a potential false breakout or stop hunt. It also supports visual labeling and alerts for these events.
⚙️ Inputs
Swing Length (must be odd number ≥ 3):
Determines how many candles are used to identify swing highs/lows. The central candle must be higher or lower than all neighbors within the range.
Example: If swingLength = 5, the central candle must be higher/lower than the 2 candles on both sides.
Sweep Lookback (bars):
Defines how many bars to look back for possible liquidity sweeps.
Show Swing Labels (checkbox):
Optionally display labels on the chart when a swing high or low is detected.
Show Sweep Labels (checkbox):
Optionally display labels on the chart when a liquidity sweep occurs.
🕯️ Swing Detection Logic
A Swing High is detected when the high of the central candle is greater than the highs of all candles around it (as per the defined length).
A Swing Low is detected when the low of the central candle is lower than the lows of surrounding candles.
Swing labels are placed slightly above (for highs) or below (for lows) the candle.
💧 Liquidity Sweep Logic
A Sweep High is triggered if:
The current high breaks above a previously detected swing high,
And then the candle closes below that swing high,
Within the configured lookback window.
A Sweep Low is triggered if:
The current low breaks below a previous swing low,
And then closes above it,
Within the lookback window.
These are often seen as stop hunts or fake breakouts.
🔔 Alerts
Sweep High Alert: Triggered when a sweep above a swing high occurs.
Sweep Low Alert: Triggered when a sweep below a swing low occurs.
You can use these to set up TradingView alerts to notify you of potential liquidity grabs.
📊 Use Cases
Identifying market structure shifts.
Spotting fake breakouts and potential reversals.
Assisting in smart money concepts and liquidity-based trading.
Supporting entry timing in trend continuation or reversal strategies.

Swing High/Low LQ TrackerAn interactive tool to track liquidity events. Select start and end points on your chart—this indicator will automatically detect and plot the highest high and lowest low from that window, then extend those levels forward. If price sweeps either level, it marks the event with a clean "LQ" tag.
Perfect for traders who want to identify session-based liquidity, like killzone highs/lows, without manually drawing and deleting lines every day.
How It Works
-Select start and end time directly from settings
-Indicator calculates the swing high and low during that range
-Lines extend beyond the session until broken
-“LQ” markers appear when price sweeps the swing levels
It’s a must-have for ICT traders, smart money traders, or anyone who wants to track key liquidity levels without clutter.
Simple and effective tool for marking important ranges and tracking when liquidity is taken. No complex settings - just select your range and monitor the levels.

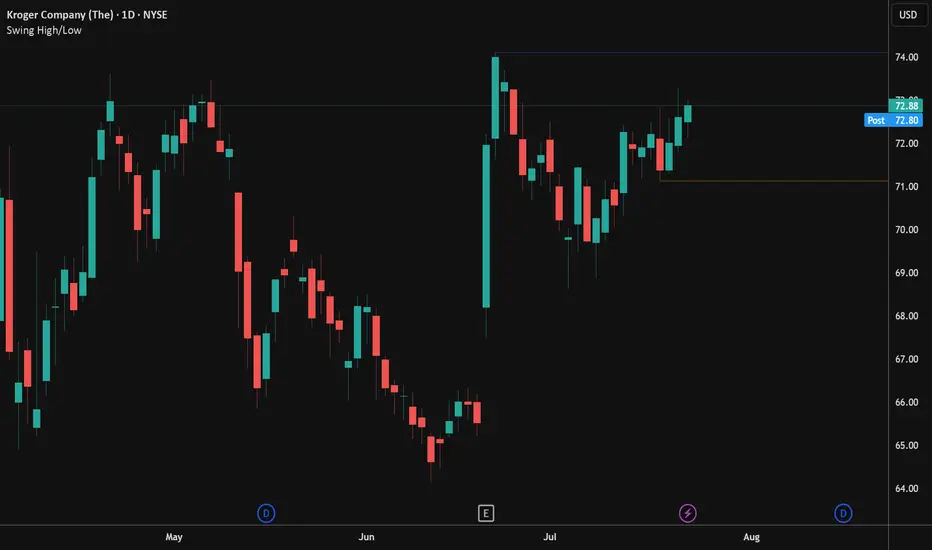
Swing High/LowPlots the swing high and low points based on user configurable look back settings. Also allows you to plot the most recent swing low as a horizontal line for obvious stop point on long setups.
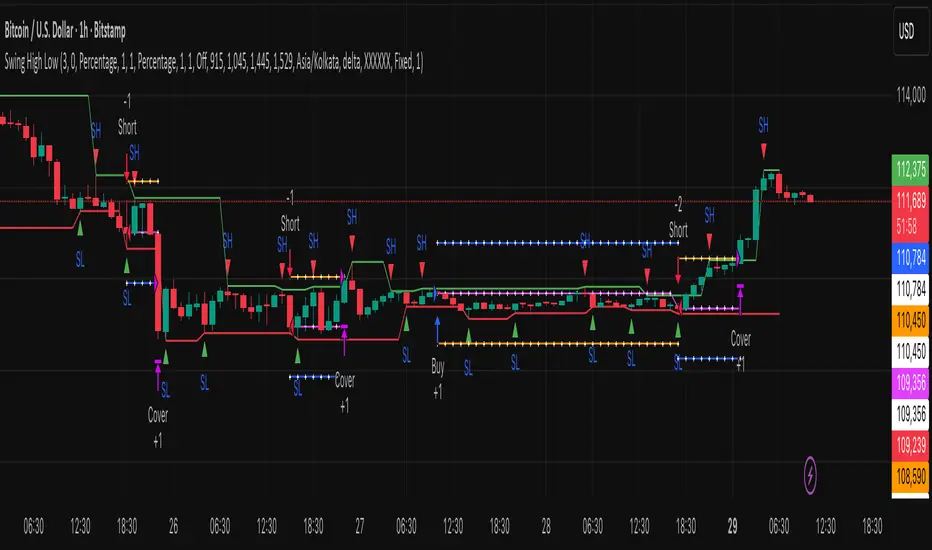
Swing High Low by MIRRORPIPThis strategy finds swing high and lows and marks them as SH and SL respectively.
if the pattern tries to form higher high it will trigger a buy signal
if the pattern tries to form lower low, it will trigger a short signal
This setup is very popular among price action lovers
Swing High/Low Levels (Auto Remove)Plots untapped swing high and low levels from higher timeframes. Used for liquidity sweep strategy. Cluster of swing levels are a magnet for price to return to and reverse. Indicator gives option for candle body or wick for sweep to remove lines.

Swing High/Low Levels (Auto Remove)Plots untapped swing high and low levels from higher timeframes. Used for liquidity sweep strategy. Cluster of swing levels are a magnet for price to return to and reverse. Indicator gives option for candle body or wick for sweep.

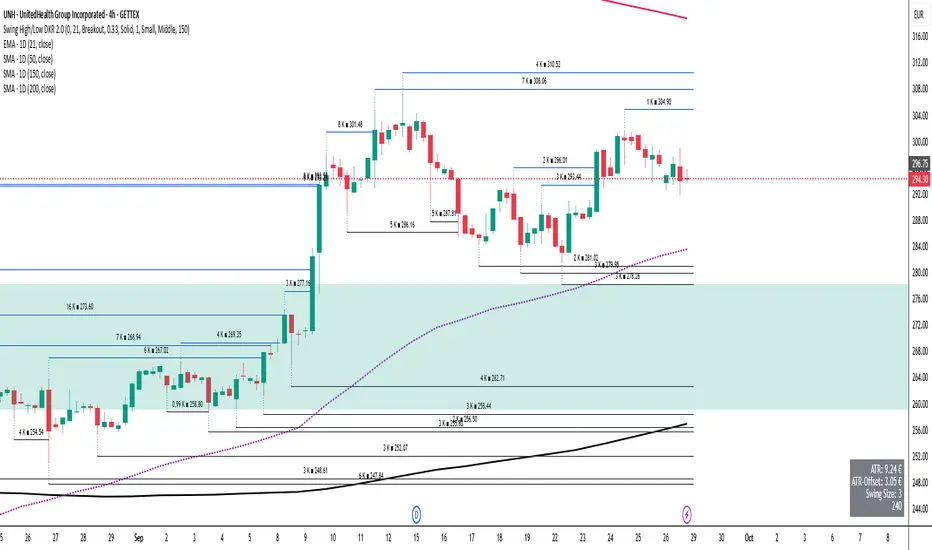
Swing High/Low MarkerThis indicator allows you to find the swing highs and lows of the chart and offsets it by the ATR and a custom factor to give you concrete breakout and stop loss prices.
Swings High Low with dates BY CheI share this simple indicator for free.
The indicator consists of marking the most important swings, either high or low.
So you can analyze how the price interacts in the future with these values.
The original code belongs to another author.
I added the possibility to filter swings between dates, this way only the swings we are interested in between those dates are marked.
Feel free to share and copy this script!
Enjoy!

Swing High Low Price Channel V.1You should buy/sell small order at small plot zone or after small plot. And, Buy/sell big order at big plot zone or after big plot.
Recommended, You should use this with Fibonacci Retracement, Price Action or Graph Pattern.

Market Structure DashboardThis indicator displays a **multi-timeframe dashboard** that helps traders track market structure across several horizons: Monthly, Weekly, Daily, H4, H1, M15, and M5.
It identifies the current trend (Bullish, Bearish, or Neutral) based on the progression of **swing highs and lows** (HH/HL, LH/LL).
For each timeframe, the dashboard shows:
* The **current structure** (Bullish, Bearish, Neutral) with a clear color code (green, red, gray).
* **Pivot information**:
* either the latest swing high/low values,
* or the exact date and time of their occurrence (user-selectable in the settings).
An integrated **alert system** notifies you whenever the market structure changes (e.g., "Daily: Neutral → Bullish").
### Key Features:
* Clear overview of multi-timeframe market structures.
* Customizable pivot info display (values or timestamps).
* Built-in alerts on trend changes.
* Compact and readable dashboard, displayed in the top-right corner of the chart.
This tool is ideal for traders who want to quickly assess the **overall market structure** across multiple timeframes and be instantly alerted to potential reversals.

SMC Structures and FVGสวัสดีครับ! ผมจะอธิบายอินดิเคเตอร์ "SMC Structures and FVG + MACD" ที่คุณให้มาอย่างละเอียดในแต่ละส่วน เพื่อให้คุณเข้าใจการทำงานของมันอย่างถ่องแท้ครับ
อินดิเคเตอร์นี้เป็นการผสมผสานแนวคิดของ Smart Money Concept (SMC) ซึ่งเน้นการวิเคราะห์โครงสร้างตลาด (Market Structure) และ Fair Value Gap (FVG) เข้ากับอินดิเคเตอร์ MACD เพื่อใช้เป็นตัวกรองหรือตัวยืนยันสัญญาณ Choch/BoS (Change of Character / Break of Structure)
1. ภาพรวมอินดิเคเตอร์ (Overall Purpose)
อินดิเคเตอร์นี้มีจุดประสงค์หลักคือ:
ระบุโครงสร้างตลาด: ตีเส้นและป้ายกำกับ Choch (Change of Character) และ BoS (Break of Structure) บนกราฟโดยอัตโนมัติ
ผสานการยืนยันด้วย MACD: สัญญาณ Choch/BoS จะถูกพิจารณาก็ต่อเมื่อ MACD Histogram เกิดการตัดขึ้นหรือลง (Zero Cross) ในทิศทางที่สอดคล้องกัน
แสดง Fair Value Gap (FVG): หากเปิดใช้งาน จะมีการตีกล่อง FVG บนกราฟ
แสดงระดับ Fibonacci: คำนวณและแสดงระดับ Fibonacci ที่สำคัญตามโครงสร้างตลาดปัจจุบัน
ปรับตาม Timeframe: การคำนวณและการแสดงผลทั้งหมดจะปรับตาม Timeframe ที่คุณกำลังใช้งานอยู่โดยอัตโนมัติ
2. ส่วนประกอบหลักของโค้ด (Code Breakdown)
โค้ดนี้สามารถแบ่งออกเป็นส่วนหลัก ๆ ได้ดังนี้:
2.1 Inputs (การตั้งค่า)
ส่วนนี้คือตัวแปรที่คุณสามารถปรับแต่งได้ในหน้าต่างการตั้งค่าของอินดิเคเตอร์ (คลิกที่รูปฟันเฟืองข้างชื่ออินดิเคเตอร์บนกราฟ)
MACD Settings (ตั้งค่า MACD):
fast_len: ความยาวของ Fast EMA สำหรับ MACD (ค่าเริ่มต้น 12)
slow_len: ความยาวของ Slow EMA สำหรับ MACD (ค่าเริ่มต้น 26)
signal_len: ความยาวของ Signal Line สำหรับ MACD (ค่าเริ่มต้น 9)
= ta.macd(close, fast_len, slow_len, signal_len): คำนวณค่า MACD Line, Signal Line และ Histogram โดยใช้ราคาปิด (close) และค่าความยาวที่กำหนด
is_bullish_macd_cross: ตรวจสอบว่า MACD Histogram ตัดขึ้นเหนือเส้น 0 (จากค่าลบเป็นบวก)
is_bearish_macd_cross: ตรวจสอบว่า MACD Histogram ตัดลงใต้เส้น 0 (จากค่าบวกเป็นลบ)
Fear Value Gap (FVG) Settings:
isFvgToShow: (Boolean) เปิด/ปิดการแสดง FVG บนกราฟ
bullishFvgColor: สีสำหรับ Bullish FVG
bearishFvgColor: สีสำหรับ Bearish FVG
mitigatedFvgColor: สีสำหรับ FVG ที่ถูก Mitigate (ลดทอน) แล้ว
fvgHistoryNbr: จำนวน FVG ย้อนหลังที่จะแสดง
isMitigatedFvgToReduce: (Boolean) เปิด/ปิดการลดขนาด FVG เมื่อถูก Mitigate
Structures (โครงสร้างตลาด) Settings:
isStructBodyCandleBreak: (Boolean) หากเป็น true การ Break จะต้องเกิดขึ้นด้วย เนื้อเทียน ที่ปิดเหนือ/ใต้ Swing High/Low หากเป็น false แค่ไส้เทียนทะลุก็ถือว่า Break
isCurrentStructToShow: (Boolean) เปิด/ปิดการแสดงเส้นโครงสร้างตลาดปัจจุบัน (เส้นสีน้ำเงินในภาพตัวอย่าง)
pivot_len: ความยาวของแท่งเทียนที่ใช้ในการมองหาจุด Pivot (Swing High/Low) ยิ่งค่าน้อยยิ่งจับ Swing เล็กๆ ได้, ยิ่งค่ามากยิ่งจับ Swing ใหญ่ๆ ได้
bullishBosColor, bearishBosColor: สีสำหรับเส้นและป้าย BOS ขาขึ้น/ขาลง
bosLineStyleOption, bosLineWidth: สไตล์ (Solid, Dotted, Dashed) และความหนาของเส้น BOS
bullishChochColor, bearishChochColor: สีสำหรับเส้นและป้าย CHoCH ขาขึ้น/ขาลง
chochLineStyleOption, chochLineWidth: สไตล์ (Solid, Dotted, Dashed) และความหนาของเส้น CHoCH
currentStructColor, currentStructLineStyleOption, currentStructLineWidth: สี, สไตล์ และความหนาของเส้นโครงสร้างตลาดปัจจุบัน
structHistoryNbr: จำนวนการ Break (Choch/BoS) ย้อนหลังที่จะแสดง
Structure Fibonacci (จากโค้ดต้นฉบับ):
เป็นชุด Input สำหรับเปิด/ปิด, กำหนดค่า, สี, สไตล์ และความหนาของเส้น Fibonacci Levels ต่างๆ (0.786, 0.705, 0.618, 0.5, 0.382) ที่จะถูกคำนวณจากโครงสร้างตลาดปัจจุบัน
2.2 Helper Functions (ฟังก์ชันช่วยทำงาน)
getLineStyle(lineOption): ฟังก์ชันนี้ใช้แปลงค่า String ที่เลือกจาก Input (เช่น "─", "┈", "╌") ให้เป็นรูปแบบ line.style_ ที่ Pine Script เข้าใจ
get_structure_highest_bar(lookback): ฟังก์ชันนี้พยายามหา Bar Index ของแท่งเทียนที่ทำ Swing High ภายในช่วง lookback ที่กำหนด
get_structure_lowest_bar(lookback): ฟังก์ชันนี้พยายามหา Bar Index ของแท่งเทียนที่ทำ Swing Low ภายในช่วง lookback ที่กำหนด
is_structure_high_broken(...): ฟังก์ชันนี้ตรวจสอบว่าราคาปัจจุบันได้ Break เหนือ _structureHigh (Swing High) หรือไม่ โดยพิจารณาจาก _highStructBreakPrice (ราคาปิดหรือราคา High ขึ้นอยู่กับการตั้งค่า isStructBodyCandleBreak)
FVGDraw(...): ฟังก์ชันนี้รับ Arrays ของ FVG Boxes, Types, Mitigation Status และ Labels มาประมวลผล เพื่ออัปเดตสถานะของ FVG (เช่น ถูก Mitigate หรือไม่) และปรับขนาด/ตำแหน่งของ FVG Box และ Label บนกราฟ
2.3 Global Variables (ตัวแปรทั่วทั้งอินดิเคเตอร์)
เป็นตัวแปรที่ประกาศด้วย var ซึ่งหมายความว่าค่าของมันจะถูกเก็บไว้และอัปเดตในแต่ละแท่งเทียน (persists across bars)
structureLines, structureLabels: Arrays สำหรับเก็บอ็อบเจกต์ line และ label ของเส้น Choch/BoS ที่วาดบนกราฟ
fvgBoxes, fvgTypes, fvgLabels, isFvgMitigated: Arrays สำหรับเก็บข้อมูลของ FVG Boxes และสถานะต่างๆ
structureHigh, structureLow: เก็บราคาของ Swing High/Low ที่สำคัญของโครงสร้างตลาดปัจจุบัน
structureHighStartIndex, structureLowStartIndex: เก็บ Bar Index ของจุดเริ่มต้นของ Swing High/Low ที่สำคัญ
structureDirection: เก็บสถานะของทิศทางโครงสร้างตลาด (1 = Bullish, 2 = Bearish, 0 = Undefined)
fiboXPrice, fiboXStartIndex, fiboXLine, fiboXLabel: ตัวแปรสำหรับเก็บข้อมูลและอ็อบเจกต์ของเส้น Fibonacci Levels
isBOSAlert, isCHOCHAlert: (Boolean) ใช้สำหรับส่งสัญญาณ Alert (หากมีการตั้งค่า Alert ไว้)
2.4 FVG Processing (การประมวลผล FVG)
ส่วนนี้จะตรวจสอบเงื่อนไขการเกิด FVG (Bullish FVG: high < low , Bearish FVG: low > high )
หากเกิด FVG และ isFvgToShow เป็น true จะมีการสร้าง box และ label ใหม่เพื่อแสดง FVG บนกราฟ
มีการจัดการ fvgBoxes และ fvgLabels เพื่อจำกัดจำนวน FVG ที่แสดงตาม fvgHistoryNbr และลบ FVG เก่าออก
ฟังก์ชัน FVGDraw จะถูกเรียกเพื่ออัปเดตสถานะของ FVG (เช่น การถูก Mitigate) และปรับการแสดงผล
2.5 Structures Processing (การประมวลผลโครงสร้างตลาด)
Initialization: ที่ bar_index == 0 (แท่งเทียนแรกของกราฟ) จะมีการกำหนดค่าเริ่มต้นให้กับ structureHigh, structureLow, structureHighStartIndex, structureLowStartIndex
Finding Current High/Low: highest, highestBar, lowest, lowestBar ถูกใช้เพื่อหา High/Low ที่สุดและ Bar Index ของมันใน 10 แท่งล่าสุด (หรือทั้งหมดหากกราฟสั้นกว่า 10 แท่ง)
Calculating Structure Max/Min Bar: structureMaxBar และ structureMinBar ใช้ฟังก์ชัน get_structure_highest_bar และ get_structure_lowest_bar เพื่อหา Bar Index ของ Swing High/Low ที่แท้จริง (ไม่ใช่แค่ High/Low ที่สุดใน lookback แต่เป็นจุด Pivot ที่สมบูรณ์)
Break Price: lowStructBreakPrice และ highStructBreakPrice จะเป็นราคาปิด (close) หรือราคา Low/High ขึ้นอยู่กับ isStructBodyCandleBreak
isStuctureLowBroken / isStructureHighBroken: เงื่อนไขเหล่านี้ตรวจสอบว่าราคาได้ทำลาย structureLow หรือ structureHigh หรือไม่ โดยพิจารณาจากราคา Break, ราคาแท่งก่อนหน้า และ Bar Index ของจุดเริ่มต้นโครงสร้าง
Choch/BoS Logic (ส่วนสำคัญที่ถูกผสานกับ MACD):
if(isStuctureLowBroken and is_bearish_macd_cross): นี่คือจุดที่ MACD เข้ามามีบทบาท หากราคาทำลาย structureLow (สัญญาณขาลง) และ MACD Histogram เกิด Bearish Zero Cross (is_bearish_macd_cross เป็น true) อินดิเคเตอร์จะพิจารณาว่าเป็น Choch หรือ BoS
หาก structureDirection == 1 (เดิมเป็นขาขึ้น) หรือ 0 (ยังไม่กำหนด) จะตีเป็น "CHoCH" (เปลี่ยนทิศทางโครงสร้างเป็นขาลง)
หาก structureDirection == 2 (เดิมเป็นขาลง) จะตีเป็น "BOS" (ยืนยันโครงสร้างขาลง)
มีการสร้าง line.new และ label.new เพื่อวาดเส้นและป้ายกำกับ
structureDirection จะถูกอัปเดตเป็น 1 (Bullish)
structureHighStartIndex, structureLowStartIndex, structureHigh, structureLow จะถูกอัปเดตเพื่อกำหนดโครงสร้างใหม่
else if(isStructureHighBroken and is_bullish_macd_cross): เช่นกันสำหรับขาขึ้น หากราคาทำลาย structureHigh (สัญญาณขาขึ้น) และ MACD Histogram เกิด Bullish Zero Cross (is_bullish_macd_cross เป็น true) อินดิเคเตอร์จะพิจารณาว่าเป็น Choch หรือ BoS
หาก structureDirection == 2 (เดิมเป็นขาลง) หรือ 0 (ยังไม่กำหนด) จะตีเป็น "CHoCH" (เปลี่ยนทิศทางโครงสร้างเป็นขาขึ้น)
หาก structureDirection == 1 (เดิมเป็นขาขึ้น) จะตีเป็น "BOS" (ยืนยันโครงสร้างขาขึ้น)
มีการสร้าง line.new และ label.new เพื่อวาดเส้นและป้ายกำกับ
structureDirection จะถูกอัปเดตเป็น 2 (Bearish)
structureHighStartIndex, structureLowStartIndex, structureHigh, structureLow จะถูกอัปเดตเพื่อกำหนดโครงสร้างใหม่
การลบเส้นเก่า: d.delete_line (หากไลบรารีทำงาน) จะถูกเรียกเพื่อลบเส้นและป้ายกำกับเก่าออกเมื่อจำนวนเกิน structHistoryNbr
Updating Structure High/Low (else block): หากไม่มีการ Break เกิดขึ้น แต่ราคาปัจจุบันสูงกว่า structureHigh หรือต่ำกว่า structureLow ในทิศทางที่สอดคล้องกัน (เช่น ยังคงเป็นขาขึ้นและทำ High ใหม่) structureHigh หรือ structureLow จะถูกอัปเดตเพื่อติดตาม High/Low ที่สุดของโครงสร้างปัจจุบัน
Current Structure Display:
หาก isCurrentStructToShow เป็น true อินดิเคเตอร์จะวาดเส้น structureHighLine และ structureLowLine เพื่อแสดงขอบเขตของโครงสร้างตลาดปัจจุบัน
Fibonacci Display:
หาก isFiboXToShow เป็น true อินดิเคเตอร์จะคำนวณและวาดเส้น Fibonacci Levels ต่างๆ (0.786, 0.705, 0.618, 0.5, 0.382) โดยอิงจาก structureHigh และ structureLow ของโครงสร้างตลาดปัจจุบัน
Alerts:
alertcondition: ใช้สำหรับตั้งค่า Alert ใน TradingView เมื่อเกิดสัญญาณ BOS หรือ CHOCH
plot(na):
plot(na) เป็นคำสั่งที่สำคัญในอินดิเคเตอร์ที่ไม่ได้ต้องการพล็อต Series ของข้อมูลบนกราฟ (เช่น ไม่ได้พล็อตเส้น EMA หรือ RSI) แต่ใช้วาดอ็อบเจกต์ (Line, Label, Box) โดยตรง
การมี plot(na) ช่วยให้ Pine Script รู้ว่าอินดิเคเตอร์นี้มีเอาต์พุตที่แสดงผลบนกราฟ แม้ว่าจะไม่ได้เป็น Series ที่พล็อตตามปกติก็ตาม
3. วิธีใช้งาน
คัดลอกโค้ดทั้งหมด ที่อยู่ในบล็อก immersive ด้านบน
ไปที่ TradingView และเปิดกราฟที่คุณต้องการ
คลิกที่เมนู "Pine Editor" ที่อยู่ด้านล่างของหน้าจอ
ลบโค้ดเดิมที่มีอยู่ และ วางโค้ดที่คัดลอกมา ลงไปแทน
คลิกที่ปุ่ม "Add to Chart"
อินดิเคเตอร์จะถูกเพิ่มลงในกราฟของคุณโดยอัตโนมัติ คุณสามารถคลิกที่รูปฟันเฟืองข้างชื่ออินดิเคเตอร์บนกราฟเพื่อเข้าถึงหน้าต่างการตั้งค่าและปรับแต่งตามความต้องการของคุณได้
Hello! I will explain the "SMC Structures and FVG + MACD" indicator you provided in detail, section by section, so you can fully understand how it works.This indicator combines the concepts of Smart Money Concept (SMC), which focuses on analyzing Market Structure and Fair Value Gaps (FVG), with the MACD indicator to serve as a filter or confirmation for Choch (Change of Character) and BoS (Break of Structure) signals.1. Overall PurposeThe main purposes of this indicator are:Identify Market Structure: Automatically draw lines and label Choch (Change of Character) and BoS (Break of Structure) on the chart.Integrate MACD Confirmation: Choch/BoS signals will only be considered when the MACD Histogram performs a cross (Zero Cross) in the corresponding direction.Display Fair Value Gap (FVG): If enabled, FVG boxes will be drawn on the chart.Display Fibonacci Levels: Calculate and display important Fibonacci levels based on the current market structure.Adapt to Timeframe: All calculations and displays will automatically adjust to the timeframe you are currently using.2. Code BreakdownThis code can be divided into the following main sections:2.1 Inputs (Settings)This section contains variables that you can adjust in the indicator's settings window (click the gear icon next to the indicator's name on the chart).MACD Settings:fast_len: Length of the Fast EMA for MACD (default 12)slow_len: Length of the Slow EMA for MACD (default 26)signal_len: Length of the Signal Line for MACD (default 9) = ta.macd(close, fast_len, slow_len, signal_len): Calculates the MACD Line, Signal Line, and Histogram using the closing price (close) and the specified lengths.is_bullish_macd_cross: Checks if the MACD Histogram crosses above the 0 line (from negative to positive).is_bearish_macd_cross: Checks if the MACD Histogram crosses below the 0 line (from positive to negative).Fear Value Gap (FVG) Settings:isFvgToShow: (Boolean) Enables/disables the display of FVG on the chart.bullishFvgColor: Color for Bullish FVG.bearishFvgColor: Color for Bearish FVG.mitigatedFvgColor: Color for FVG that has been mitigated.fvgHistoryNbr: Number of historical FVG to display.isMitigatedFvgToReduce: (Boolean) Enables/disables reducing the size of FVG when mitigated.Structures (โครงสร้างตลาด) Settings:isStructBodyCandleBreak: (Boolean) If true, the break must occur with the candle body closing above/below the Swing High/Low. If false, a wick break is sufficient.isCurrentStructToShow: (Boolean) Enables/disables the display of the current market structure lines (blue lines in the example image).pivot_len: Lookback length for identifying Pivot points (Swing High/Low). A smaller value captures smaller, more frequent swings; a larger value captures larger, more significant swings.bullishBosColor, bearishBosColor: Colors for bullish/bearish BOS lines and labels.bosLineStyleOption, bosLineWidth: Style (Solid, Dotted, Dashed) and width of BOS lines.bullishChochColor, bearishChochColor: Colors for bullish/bearish CHoCH lines and labels.chochLineStyleOption, chochLineWidth: Style (Solid, Dotted, Dashed) and width of CHoCH lines.currentStructColor, currentStructLineStyleOption, currentStructLineWidth: Color, style, and width of the current market structure lines.structHistoryNbr: Number of historical breaks (Choch/BoS) to display.Structure Fibonacci (from original code):A set of inputs to enable/disable, define values, colors, styles, and widths for various Fibonacci Levels (0.786, 0.705, 0.618, 0.5, 0.382) that will be calculated from the current market structure.2.2 Helper FunctionsgetLineStyle(lineOption): This function converts the selected string input (e.g., "─", "┈", "╌") into a line.style_ format understood by Pine Script.get_structure_highest_bar(lookback): This function attempts to find the Bar Index of the Swing High within the specified lookback period.get_structure_lowest_bar(lookback): This function attempts to find the Bar Index of the Swing Low within the specified lookback period.is_structure_high_broken(...): This function checks if the current price has broken above _structureHigh (Swing High), considering _highStructBreakPrice (closing price or high price depending on isStructBodyCandleBreak setting).FVGDraw(...): This function takes arrays of FVG Boxes, Types, Mitigation Status, and Labels to process and update the status of FVG (e.g., whether it's mitigated) and adjust the size/position of FVG Boxes and Labels on the chart.2.3 Global VariablesThese are variables declared with var, meaning their values are stored and updated on each bar (persists across bars).structureLines, structureLabels: Arrays to store line and label objects for Choch/BoS lines drawn on the chart.fvgBoxes, fvgTypes, fvgLabels, isFvgMitigated: Arrays to store FVG box data and their respective statuses.structureHigh, structureLow: Stores the price of the significant Swing High/Low of the current market structure.structureHighStartIndex, structureLowStartIndex: Stores the Bar Index of the start point of the significant Swing High/Low.structureDirection: Stores the status of the market structure direction (1 = Bullish, 2 = Bearish, 0 = Undefined).fiboXPrice, fiboXStartIndex, fiboXLine, fiboXLabel: Variables to store data and objects for Fibonacci Levels.isBOSAlert, isCHOCHAlert: (Boolean) Used to trigger alerts in TradingView (if alerts are configured).2.4 FVG ProcessingThis section checks the conditions for FVG formation (Bullish FVG: high < low , Bearish FVG: low > high ).If FVG occurs and isFvgToShow is true, a new box and label are created to display the FVG on the chart.fvgBoxes and fvgLabels are managed to limit the number of FVG displayed according to fvgHistoryNbr and remove older FVG.The FVGDraw function is called to update the FVG status (e.g., whether it's mitigated) and adjust its display.2.5 Structures ProcessingInitialization: At bar_index == 0 (the first bar of the chart), structureHigh, structureLow, structureHighStartIndex, and structureLowStartIndex are initialized.Finding Current High/Low: highest, highestBar, lowest, lowestBar are used to find the highest/lowest price and its Bar Index of it in the last 10 bars (or all bars if the chart is shorter than 10 bars).Calculating Structure Max/Min Bar: structureMaxBar and structureMinBar use get_structure_highest_bar and get_structure_lowest_bar functions to find the Bar Index of the true Swing High/Low (not just the highest/lowest in the lookback but a complete Pivot point).Break Price: lowStructBreakPrice and highStructBreakPrice will be the closing price (close) or the Low/High price, depending on the isStructBodyCandleBreak setting.isStuctureLowBroken / isStructureHighBroken: These conditions check if the price has broken structureLow or structureHigh, considering the break price, previous bar prices, and the Bar Index of the structure's starting point.Choch/BoS Logic (Key Integration with MACD):if(isStuctureLowBroken and is_bearish_macd_cross): This is where MACD plays a role. If the price breaks structureLow (bearish signal) AND the MACD Histogram performs a Bearish Zero Cross (is_bearish_macd_cross is true), the indicator will consider it a Choch or BoS.If structureDirection == 1 (previously bullish) or 0 (undefined), it will be labeled "CHoCH" (changing structure direction to bearish).If structureDirection == 2 (already bearish), it will be labeled "BOS" (confirming bearish structure).line.new and label.new are used to draw the line and label.structureDirection will be updated to 1 (Bullish).structureHighStartIndex, structureLowStartIndex, structureHigh, structureLow will be updated to define the new structure.else if(isStructureHighBroken and is_bullish_macd_cross): Similarly for bullish breaks. If the price breaks structureHigh (bullish signal) AND the MACD Histogram performs a Bullish Zero Cross (is_bullish_macd_cross is true), the indicator will consider it a Choch or BoS.If structureDirection == 2 (previously bearish) or 0 (undefined), it will be labeled "CHoCH" (changing structure direction to bullish).If structureDirection == 1 (already bullish), it will be labeled "BOS" (confirming bullish structure).line.new and label.new are used to draw the line and label.structureDirection will be updated to 2 (Bearish).structureHighStartIndex, structureLowStartIndex, structureHigh, structureLow will be updated to define the new structure.Deleting Old Lines: d.delete_line (if the library works) will be called to delete old lines and labels when their number exceeds structHistoryNbr.Updating Structure High/Low (else block): If no break occurs, but the current price is higher than structureHigh or lower than structureLow in the corresponding direction (e.g., still bullish and making a new high), structureHigh or structureLow will be updated to track the highest/lowest point of the current structure.Current Structure Display:If isCurrentStructToShow is true, the indicator draws structureHighLine and structureLowLine to show the boundaries of the current market structure.Fibonacci Display:If isFiboXToShow is true, the indicator calculates and draws various Fibonacci Levels (0.786, 0.705, 0.618, 0.5, 0.382) based on the structureHigh and structureLow of the current market structure.Alerts:alertcondition: Used to set up alerts in TradingView when BOS or CHOCH signals occur.plot(na):plot(na) is an important statement in indicators that do not plot data series directly on the chart (e.g., not plotting EMA or RSI lines) but instead draw objects (Line, Label, Box).Having plot(na) helps Pine Script recognize that this indicator has an output displayed on the chart, even if it's not a regularly plotted series.3. How to UseCopy all the code in the immersive block above.Go to TradingView and open your desired chart.Click on the "Pine Editor" menu at the bottom of the screen.Delete any existing code and paste the copied code in its place.Click the "Add to Chart" button.The indicator will be added to your chart automatically. You can click the gear icon next to the indicator's name on the chart to access the settings window and customize it to your needs.I hope this explanation helps you understand this indicator in detail. If anything is unclear, or you need further adjustments, please let me know.

Parallel Projections [theEccentricTrader]█ OVERVIEW
This indicator automatically projects parallel trendlines or channels, from a single point of origin. In the example above I have applied the indicator twice to the 1D SPXUSD. The five upper lines (green) are projected at an angle of -5 from the 1-month swing high anchor point with a projection ratio of -72. And the seven lower lines (blue) are projected at an angle of 10 with a projection ratio of 36 from the 1-week swing low anchor point.
█ CONCEPTS
Green and Red Candles
• A green candle is one that closes with a high price equal to or above the price it opened.
• A red candle is one that closes with a low price that is lower than the price it opened.
Swing Highs and Swing Lows
• A swing high is a green candle or series of consecutive green candles followed by a single red candle to complete the swing and form the peak.
• A swing low is a red candle or series of consecutive red candles followed by a single green candle to complete the swing and form the trough.
Peak and Trough Prices (Basic)
• The peak price of a complete swing high is the high price of either the red candle that completes the swing high or the high price of the preceding green candle, depending on which is higher.
• The trough price of a complete swing low is the low price of either the green candle that completes the swing low or the low price of the preceding red candle, depending on which is lower.
Historic Peaks and Troughs
The current, or most recent, peak and trough occurrences are referred to as occurrence zero. Previous peak and trough occurrences are referred to as historic and ordered numerically from right to left, with the most recent historic peak and trough occurrences being occurrence one.
Support and Resistance
• Support refers to a price level where the demand for an asset is strong enough to prevent the price from falling further.
• Resistance refers to a price level where the supply of an asset is strong enough to prevent the price from rising further.
Support and resistance levels are important because they can help traders identify where the price of an asset might pause or reverse its direction, offering potential entry and exit points. For example, a trader might look to buy an asset when it approaches a support level , with the expectation that the price will bounce back up. Alternatively, a trader might look to sell an asset when it approaches a resistance level , with the expectation that the price will drop back down.
It's important to note that support and resistance levels are not always relevant, and the price of an asset can also break through these levels and continue moving in the same direction.
Trendlines
Trendlines are straight lines that are drawn between two or more points on a price chart. These lines are used as dynamic support and resistance levels for making strategic decisions and predictions about future price movements. For example traders will look for price movements along, and reactions to, trendlines in the form of rejections or breakouts/downs.
█ FEATURES
Inputs
• Anchor Point Type
• Swing High/Low Occurrence
• HTF Resolution
• Highest High/Lowest Low Lookback
• Angle Degree
• Projection Ratio
• Number Lines
• Line Color
Anchor Point Types
• Swing High
• Swing Low
• Swing High (HTF)
• Swing Low (HTF)
• Highest High
• Lowest Low
• Intraday Highest High (intraday charts only)
• Intraday Lowest Low (intraday charts only)
Swing High/Swing Low Occurrence
This input is used to determine which historic peak or trough to reference for swing high or swing low anchor point types.
HTF Resolution
This input is used to determine which higher timeframe to reference for swing high (HTF) or swing low (HTF) anchor point types.
Highest High/Lowest Low Lookback
This input is used to determine the lookback length for highest high or lowest low anchor point types.
Intraday Highest High/Lowest Low Lookback
When using intraday highest high or lowest low anchor point types, the lookback length is calculated automatically based on number of bars since the daily candle opened.
Angle Degree
This input is used to determine the angle of the trendlines. The output is expressed in terms of point or pips, depending on the symbol type, which is then passed through the built in math.todegrees() function. Positive numbers will project the lines upwards while negative numbers will project the lines downwards. Depending on the market and timeframe, the impact input values will have on the visible gaps between the lines will vary greatly. For example, an input of 10 will have a far greater impact on the gaps between the lines when viewed from the 1-minute timeframe than it would on the 1-day timeframe. The input is a float and as such the value passed through can go into as many decimal places as the user requires.
It is also worth mentioning that as more lines are added the gaps between the lines, that are closest to the anchor point, will get tighter as they make their way up the y-axis. Although the gaps between the lines will stay constant at the x2 plot, i.e. a distance of 10 points between them, they will gradually get tighter and tighter at the point of origin as the slope of the lines get steeper.
Projection Ratio
This input is used to determine the distance between the parallels, expressed in terms of point or pips. Positive numbers will project the lines upwards while negative numbers will project the lines downwards. Depending on the market and timeframe, the impact input values will have on the visible gaps between the lines will vary greatly. For example, an input of 10 will have a far greater impact on the gaps between the lines when viewed from the 1-minute timeframe than it would on the 1-day timeframe. The input is a float and as such the value passed through can go into as many decimal places as the user requires.
Number Lines
This input is used to determine the number of lines to be drawn on the chart, maximum is 500.
█ LIMITATIONS
All green and red candle calculations are based on differences between open and close prices, as such I have made no attempt to account for green candles that gap lower and close below the close price of the preceding candle, or red candles that gap higher and close above the close price of the preceding candle. This may cause some unexpected behaviour on some markets and timeframes. I can only recommend using 24-hour markets, if and where possible, as there are far fewer gaps and, generally, more data to work with.
If the lines do not draw or you see a study error saying that the script references too many candles in history, this is most likely because the higher timeframe anchor point is not present on the current timeframe. This problem usually occurs when referencing a higher timeframe, such as the 1-month, from a much lower timeframe, such as the 1-minute. How far you can lookback for higher timeframe anchor points on the current timeframe will also be limited by your Trading View subscription plan. Premium users get 20,000 candles worth of data, pro+ and pro users get 10,000, and basic users get 5,000.
█ RAMBLINGS
It is my current thesis that the indicator will work best when used in conjunction with my Wavemeter indicator, which can be used to set the angle and projection ratio. For example, the average wave height or amplitude could be used as the value for the angle and projection ratio inputs. Or some factor or multiple of such an average. I think this makes sense as it allows for objectivity when applying the indicator across different markets and timeframes with different energies and vibrations.
“If you want to find the secrets of the universe, think in terms of energy, frequency and vibration.”
― Nikola Tesla

Fan Projections [theEccentricTrader]█ OVERVIEW
This indicator automatically projects trendlines in the shape of a fan, from a single point of origin. In the example above I have applied the indicator twice to the 1D SPXUSD. The seven upper lines (green) are projected at an angle of -5 from the 1-month swing high anchor point. And the five lower lines (blue) are projected at an angle of 10 from the 1-week swing low anchor point.
█ CONCEPTS
Green and Red Candles
• A green candle is one that closes with a high price equal to or above the price it opened.
• A red candle is one that closes with a low price that is lower than the price it opened.
Swing Highs and Swing Lows
• A swing high is a green candle or series of consecutive green candles followed by a single red candle to complete the swing and form the peak.
• A swing low is a red candle or series of consecutive red candles followed by a single green candle to complete the swing and form the trough.
Peak and Trough Prices (Basic)
• The peak price of a complete swing high is the high price of either the red candle that completes the swing high or the high price of the preceding green candle, depending on which is higher.
• The trough price of a complete swing low is the low price of either the green candle that completes the swing low or the low price of the preceding red candle, depending on which is lower.
Historic Peaks and Troughs
The current, or most recent, peak and trough occurrences are referred to as occurrence zero. Previous peak and trough occurrences are referred to as historic and ordered numerically from right to left, with the most recent historic peak and trough occurrences being occurrence one.
Support and Resistance
• Support refers to a price level where the demand for an asset is strong enough to prevent the price from falling further.
• Resistance refers to a price level where the supply of an asset is strong enough to prevent the price from rising further.
Support and resistance levels are important because they can help traders identify where the price of an asset might pause or reverse its direction, offering potential entry and exit points. For example, a trader might look to buy an asset when it approaches a support level , with the expectation that the price will bounce back up. Alternatively, a trader might look to sell an asset when it approaches a resistance level , with the expectation that the price will drop back down.
It's important to note that support and resistance levels are not always relevant, and the price of an asset can also break through these levels and continue moving in the same direction.
Trendlines
Trendlines are straight lines that are drawn between two or more points on a price chart. These lines are used as dynamic support and resistance levels for making strategic decisions and predictions about future price movements. For example traders will look for price movements along, and reactions to, trendlines in the form of rejections or breakouts/downs.
█ FEATURES
Inputs
• Anchor Point Type
• Swing High/Low Occurrence
• HTF Resolution
• Highest High/Lowest Low Lookback
• Angle Degree
• Number Lines
• Line Color
Anchor Point Types
• Swing High
• Swing Low
• Swing High (HTF)
• Swing Low (HTF)
• Highest High
• Lowest Low
• Intraday Highest High (intraday charts only)
• Intraday Lowest Low (intraday charts only)
Swing High/Swing Low Occurrence
This input is used to determine which historic peak or trough to reference for swing high or swing low anchor point types.
HTF Resolution
This input is used to determine which higher timeframe to reference for swing high (HTF) or swing low (HTF) anchor point types.
Highest High/Lowest Low Lookback
This input is used to determine the lookback length for highest high or lowest low anchor point types.
Intraday Highest High/Lowest Low Lookback
When using intraday highest high or lowest low anchor point types, the lookback length is calculated automatically based on number of bars since the daily candle opened.
Angle Degree
This input is used to determine the angle of the trendlines. The output is expressed in terms of point or pips, depending on the symbol type, which is then passed through the built in math.todegrees() function. Positive numbers will project the lines upwards while negative numbers will project the lines downwards. Depending on the market and timeframe, the impact input values will have on the visible gaps between the lines will vary greatly. For example, an input of 10 will have a far greater impact on the gaps between the lines when viewed from the 1-minute timeframe than it would on the 1-day timeframe. The input is a float and as such the value passed through can go into as many decimal places as the user requires.
It is also worth mentioning that as more lines are added the gaps between the lines, that are closest to the anchor point, will get tighter as they make their way up the y-axis. Although the gaps between the lines will stay constant at the x2 plot, i.e. a distance of 10 points between them, they will gradually get tighter and tighter at the point of origin as the slope of the lines get steeper.
Number Lines
This input is used to determine the number of lines to be drawn on the chart, maximum is 500.
█ LIMITATIONS
All green and red candle calculations are based on differences between open and close prices, as such I have made no attempt to account for green candles that gap lower and close below the close price of the preceding candle, or red candles that gap higher and close above the close price of the preceding candle. This may cause some unexpected behaviour on some markets and timeframes. I can only recommend using 24-hour markets, if and where possible, as there are far fewer gaps and, generally, more data to work with.
If the lines do not draw or you see a study error saying that the script references too many candles in history, this is most likely because the higher timeframe anchor point is not present on the current timeframe. This problem usually occurs when referencing a higher timeframe, such as the 1-month, from a much lower timeframe, such as the 1-minute. How far you can lookback for higher timeframe anchor points on the current timeframe will also be limited by your Trading View subscription plan. Premium users get 20,000 candles worth of data, pro+ and pro users get 10,000, and basic users get 5,000.
█ RAMBLINGS
It is my current thesis that the indicator will work best when used in conjunction with my Wavemeter indicator, which can be used to set the angle. For example, the average wave height or amplitude could be used as the value for the angle input. Or some factor or multiple of such an average. I think this makes sense as it allows for objectivity when applying the indicator across different markets and timeframes with different energies and vibrations.
“If you want to find the secrets of the universe, think in terms of energy, frequency and vibration.”
― Nikola Tesla

GEEKSDOBYTE IFVG w/ Buy/Sell Signals1. Inputs & Configuration
Swing Lookback (swingLen)
Controls how many bars on each side are checked to mark a swing high or swing low (default = 5).
Booleans to Toggle Plotting
showSwings – Show small triangle markers at swing highs/lows
showFVG – Show Fair Value Gap zones
showSignals – Show “BUY”/“SELL” labels when price inverts an FVG
showDDLine – Show a yellow “DD” line at the close of the inversion bar
showCE – Show an orange dashed “CE” line at the midpoint of the gap area
2. Swing High / Low Detection
isSwingHigh = ta.pivothigh(high, swingLen, swingLen)
Marks a bar as a swing high if its high is higher than the highs of the previous swingLen bars and the next swingLen bars.
isSwingLow = ta.pivotlow(low, swingLen, swingLen)
Marks a bar as a swing low if its low is lower than the lows of the previous and next swingLen bars.
Plotting
If showSwings is true, small red downward triangles appear above swing highs, and green upward triangles below swing lows.
3. Fair Value Gap (3‐Bar) Identification
A Fair Value Gap (FVG) is defined here using a simple three‐bar logic (sometimes called an “inefficiency” in price):
Bullish FVG (bullFVG)
Checks if, two bars ago, the low of that bar (low ) is strictly greater than the current bar’s high (high).
In other words:
bullFVG = low > high
Bearish FVG (bearFVG)
Checks if, two bars ago, the high of that bar (high ) is strictly less than the current bar’s low (low).
In other words:
bearFVG = high < low
When either condition is true, it identifies a three‐bar “gap” or unfilled imbalance in the market.
4. Drawing FVG Zones
If showFVG is enabled, each time a bullish or bearish FVG is detected:
Bullish FVG Zone
Draws a semi‐transparent green box from the bar two bars ago (where the gap began) at low up to the current bar’s high.
Bearish FVG Zone
Draws a semi‐transparent red box from the bar two bars ago at high down to the current bar’s low.
These colored boxes visually highlight the “fair value imbalance” area on the chart.
5. Inversion (Fill) Detection & Entry Signals
An inversion is defined as the price “closing through” that previously drawn FVG:
Bullish Inversion (bullInversion)
Occurs when a bullish FVG was identified on bar-2 (bullFVG), and on the current bar the close is greater than that old bar-2 low:
bullInversion = bullFVG and close > low
Bearish Inversion (bearInversion)
Occurs when a bearish FVG was identified on bar-2 (bearFVG), and on the current bar the close is lower than that old bar-2 high:
bearInversion = bearFVG and close < high
When an inversion is true, the indicator optionally draws two lines and a label (depending on input toggles):
Draw “DD” Line (yellow, solid)
Plots a horizontal yellow line from the current bar’s close price extending five bars forward (bar_index + 5). This is often referred to as a “Demand/Daily Demand” line, marking where price inverted the gap.
Draw “CE” Line (orange, dashed)
Calculates the midpoint (ce) of the original FVG zone.
For a bullish inversion:
ce = (low + high) / 2
For a bearish inversion:
ce = (high + low) / 2
Plots a horizontal dashed orange line at that midpoint for five bars forward.
Plot Label (“BUY” / “SELL”)
If showSignals is true, a green “BUY” label is placed at the low of the current bar when a bullish inversion occurs.
Likewise, a red “SELL” label at the high of the current bar when a bearish inversion happens.
6. Putting It All Together
Swing Markers (Optional):
Visually confirm recent swing highs and swing lows with small triangles.
FVG Zones (Optional):
Highlight areas where price left a 3-bar gap (bullish in green, bearish in red).
Inversion Confirmation:
Wait for price to close beyond the old FVG boundary.
Once that happens, draw the yellow “DD” line at the close, the orange dashed “CE” line at the zone’s midpoint, and place a “BUY” or “SELL” label exactly on that bar.
User Controls:
All of the above elements can be individually toggled on/off (showSwings, showFVG, showSignals, showDDLine, showCE).
In Practice
A bullish FVG forms whenever a strong drop leaves a gap in liquidity (three bars ago low > current high).
When price later “fills” that gap by closing above the old low, the script signals a potential long entry (BUY), draws a demand line at the closing price, and marks the midpoint of that gap.
Conversely, a bearish FVG marks a potential short zone (three bars ago high < current low). When price closes below that gap’s high, it signals a SELL, with similar lines drawn.
By combining these elements, the indicator helps users visually identify inefficiencies (FVGs), confirm when price inverts/fills them, and place straightforward buy/sell labels alongside reference lines for trade management.

Enigma Sniper 369The "Enigma Sniper 369" is a custom-built Pine Script indicator designed for TradingView, tailored specifically for forex traders seeking high-probability entries during high-volatility market sessions.
Unlike generic trend-following or scalping tools, this indicator uniquely combines session-based "kill zones" (London and US sessions), momentum-based candle analysis, and an optional EMA trend filter to pinpoint liquidity grabs and reversal opportunities.
Its originality lies in its focus on liquidity hunting—identifying levels where stop losses are likely clustered (around swing highs/lows and wick midpoints)—and providing visual entry zones that are dynamically removed once price breaches them, reducing clutter and focusing on actionable signals.
The name "369" reflects the structured approach of three key components (session timing, candle logic, and trend filter) working in harmony to snipe precise entries.
What It Does
"Enigma Sniper 369" identifies potential buy and sell opportunities by drawing two types of horizontal lines on the chart during user-defined London and US
session kill zones:
Solid Lines: Mark the swing low (for buys) or swing high (for sells) of a trigger candle, indicating a potential entry point where stop losses might be clustered.
Dotted Lines: Mark the 50% level of the candle’s wick (lower wick for buys, upper wick for sells), serving as a secondary confirmation zone for entries or tighter stop-loss placement.
These lines are plotted only when specific candle conditions are met within the kill zones, and they are automatically deleted once the price crosses them, signaling that the liquidity at that level has likely been grabbed. The indicator also includes an optional EMA filter to ensure trades align with the broader trend, reducing false signals in choppy markets.
How It Works
The indicator’s logic is built on a multi-layered approach:
Kill Zone Timing: Trades are only considered during user-defined London and US session hours (e.g., London from 02:00 to 12:00 UTC, as seen in the screenshots). These sessions are known for high volatility and liquidity, making them ideal for capturing institutional moves.
Candle-Based Momentum Logic:
Buy Signal: A candle must close above its midpoint (indicating bullish momentum) and have a lower low than the previous candle (suggesting a potential liquidity grab below the previous swing low). This is expressed as close > (high + low) / 2 and low < low .
Sell Signal: A candle must close below its midpoint (bearish momentum) and have a higher high than the previous candle (indicating a potential liquidity grab above the previous swing high), expressed as close < (high + low) / 2 and high > high .
These conditions ensure the indicator targets candles that break recent structure to hunt stop losses while showing directional momentum.
Optional EMA Filter: A 50-period EMA (customizable) can be enabled to filter signals based on trend direction.
Buy signals are only generated if the EMA is trending upward (ema_value > ema_value ), and sell signals require a downward EMA trend (ema_value < ema_value ). This reduces noise by aligning entries with the broader market trend.
Liquidity Levels and Deletion Logic:
For a buy signal, a solid green line is drawn at the candle’s low, and a dotted green line at the 50% level of the lower wick (from the candle body’s bottom to the low).
For a sell signal, a solid red line is drawn at the candle’s high, and a dotted red line at the 50% level of the upper wick (from the body’s top to the high).
These lines extend to the right until the price crosses them, at which point they are deleted, indicating the liquidity at that level has been taken (e.g., stop losses triggered).
Alerts: The indicator includes alert conditions for buy and sell signals, notifying traders when a new setup is identified.
Underlying Concepts
The indicator is grounded in the concept of liquidity hunting, a strategy often employed by institutional traders. Markets frequently move to levels where stop losses are clustered—typically just beyond swing highs or lows—before reversing in the opposite direction. The "Enigma Sniper 369" targets these moves by identifying candles that break structure (e.g., a lower low or higher high) during high-volatility sessions, suggesting a potential sweep of stop losses. The 50% wick level acts as a secondary confirmation, as this midpoint often represents a zone where tighter stop losses are placed by retail traders. The optional EMA filter adds a trend-following element, ensuring entries are taken in the direction of the broader market momentum, which is particularly useful on lower timeframes like the 15-minute chart shown in the screenshots.
How to Use It
Here’s a step-by-step guide based on the provided usage example on the GBP/USD 15-minute chart:
Setup the Indicator: Add "Enigma Sniper 369" to your TradingView chart. Adjust the London and US session hours to match your timezone (e.g., London from 02:00 to 12:00 UTC, US from 13:00 to 22:00 UTC). Customize the EMA period (default 50) and line styles/colors if desired.
Identify Kill Zones: The indicator highlights the London session in light green and the US session in light purple, as seen in the screenshots. Focus on these periods for signals, as they are the most volatile and likely to produce liquidity grabs.
Wait for a Signal: Look for solid and dotted lines to appear during the kill zones:
Buy Setup: A solid green line at the swing low and a dotted green line at the 50% lower wick level indicate a potential buy. This suggests the market may have grabbed liquidity below the swing low and is now poised to move higher.
Sell Setup: A solid red line at the swing high and a dotted red line at the 50% upper wick level indicate a potential sell, suggesting liquidity was taken above the swing high.
Place Your Trade:
For a buy, set a buy limit order at the dotted green line (50% wick level), as this is a more conservative entry point. Place your stop loss just below the solid green line (swing low) to cover the full swing. For example, in the screenshots, the market retraces to the dotted line at 1.32980 after a liquidity grab below the swing low, triggering a buy limit order.
For a sell, set a sell limit order at the dotted red line, with a stop loss just above the solid red line.
Monitor Price Action: Once the price crosses a line, it is deleted, indicating the liquidity at that level has been taken. In the screenshots, after the buy limit is triggered, the market moves higher, confirming the setup. The caption notes, “The market returns and tags us in long with a buy limit,” highlighting this retracement strategy.
Additional Context: Use the indicator to identify liquidity levels that may be targeted later. For example, the screenshot notes, “If a new session is about to open I will wait for the grab liquidity to go long,” showing how the indicator can be used to anticipate future moves at session opens (e.g., London open at 1.32980).
Risk Management: Always set a stop loss below the swing low (for buys) or above the swing high (for sells) to protect against adverse moves. The 50% wick level helps tighten entries, improving the risk-reward ratio.
Practical Example
On the GBP/USD 15-minute chart, during the London session (02:00 UTC), the indicator identifies a buy setup with a solid green line at 1.32901 (swing low) and a dotted green line at 1.32980 (50% wick level). The market initially dips below the swing low, grabbing liquidity, then retraces to the dotted line, triggering a buy limit order. The price subsequently rises to 1.33404, yielding a profitable trade. The user notes, “The logic is in the last candle it provides new level to go long,” emphasizing the indicator’s ability to identify fresh levels after a liquidity sweep.
Customization Tips
Adjust the EMA period to suit your timeframe (e.g., a shorter period like 20 for faster signals on lower timeframes).
Modify the session hours to align with your broker’s timezone or specific market conditions.
Use the alert feature to get notified of new setups without constantly monitoring the chart.
Why It’s Useful for Traders
The "Enigma Sniper 369" stands out by combining session timing, momentum-based candle analysis, and liquidity hunting into a single tool. It provides clear, actionable levels for entries and stop losses, removes invalid signals dynamically, and aligns trades with high-probability market conditions. Whether you’re a scalper looking for quick moves during London open or a swing trader targeting session-based reversals, this indicator offers a structured, data-driven approach to trading.

Price-Action CandlesWhat is a swing high or swing low?
Swing highs and lows are price extremes. For example say we set our swing length to 5. A candle that is a swing high with a swing length of 5 will have 5 bars to the left that are lower and 5 bars to the right that are lower. A candle that is a swing low with a swing length of 5 will have 5 bars to the left that are higher and 5 bars to the right that are higher.
How are the trend candles calculated?
The trend candles are calculated by storing and comparing historical swing lows and swing highs.
The pinescript code goes as follows:
The pinescript code goes as follows:
var int trend = na
trend := ((hh and high >= psh) or close > csh) ? 1 : ((ll and low <= psl) or close < csl) ? -1 : lh or hl ? 0 : trend
What does that gibberish mean?
-Candle can be GREEN IF
- We have a higher high (current swing high is greater than the previous swing high) and the high is greater than the previous swing high
- OR The current close is greater than the current swing high
-Candle can be RED IF
- We have a lower low (current swing low is less than the previous swing low) and the low is less than the previous swing low
- OR The current close is less than the current swing low
-Candle can be YELLOW IF
- We have a new swing high and the new swing high is less than the previous swing high
- OR We have a new swing low and the new swing low is greater than the previous swing low
If none of the conditions above are true then we continue with whatever color the previous bar was.
What is repainting?
Repainting is "script behavior causing historical vs realtime calculations or plots to behave differently." That definition comes directly from Tradingview. If you want to read the full explanation you can visit it here www.tradingview.com . The price-action candles use swing highs and swing lows which need bars to the left (past) and bars to the right ("future") in order to confirm the swing level. Because of the need to wait for confirmation to for swing levels the plot style can be repainting. With the price-action candles indicator the only repainting part of the indicator is the labels. The price-action candles themselves WILL NOT REPAINT. The labels however can be set to repaint or not depending on the user preference. If the user opts to use repainting then the label location is shifted back by the length of the price-action. So if the "Price-Action Length" input is set to 10, and the user wants repainting, the swing high/low label will be shifted back 10 bars. If the user opts for no repainting, the label will not be shifted and instead show on the exact bar the swing level was confirmed.
Examples Below.
Repaint
Here the labels are shifted back the price-action length.
Non-Repaint
Here the labels are not shifted back because the input setting is set to not repaint.
Multi-timeframe Analysis
The users can view the trend from multiple different timeframes at once with a table displayed at the bottom of their charts. The timeframe can be lower or higher than the chart timeframe.
More examples
Be on the lookout for the Price Action Candles (Lower) indicator where you can view the multi-timeframe labels on a lower price grid in order to see the history over time!

CNTLibraryLibrary "CNTLibrary"
Custom Functions To Help Code In Pinescript V5
Coded By Christian Nataliano
First Coded In 10/06/2023
Last Edited In 22/06/2023
Huge Shout Out To © ZenAndTheArtOfTrading and his ZenLibrary V5, Some Of The Custom Functions Were Heavily Inspired By Matt's Work & His Pine Script Mastery Course
Another Shout Out To The TradingView's Team Library ta V5
//====================================================================================================================================================
// Custom Indicator Functions
//====================================================================================================================================================
GetKAMA(KAMA_lenght, Fast_KAMA, Slow_KAMA)
Calculates An Adaptive Moving Average Based On Perry J Kaufman's Calculations
Parameters:
KAMA_lenght (int) : Is The KAMA Lenght
Fast_KAMA (int) : Is The KAMA's Fastes Moving Average
Slow_KAMA (int) : Is The KAMA's Slowest Moving Average
Returns: Float Of The KAMA's Current Calculations
GetMovingAverage(Source, Lenght, Type)
Get Custom Moving Averages Values
Parameters:
Source (float) : Of The Moving Average, Defval = close
Lenght (simple int) : Of The Moving Average, Defval = 50
Type (string) : Of The Moving Average, Defval = Exponential Moving Average
Returns: The Moving Average Calculation Based On Its Given Source, Lenght & Calculation Type (Please Call Function On Global Scope)
GetDecimals()
Calculates how many decimals are on the quote price of the current market © ZenAndTheArtOfTrading
Returns: The current decimal places on the market quote price
Truncate(number, decimalPlaces)
Truncates (cuts) excess decimal places © ZenAndTheArtOfTrading
Parameters:
number (float)
decimalPlaces (simple float)
Returns: The given number truncated to the given decimalPlaces
ToWhole(number)
Converts pips into whole numbers © ZenAndTheArtOfTrading
Parameters:
number (float)
Returns: The converted number
ToPips(number)
Converts whole numbers back into pips © ZenAndTheArtOfTrading
Parameters:
number (float)
Returns: The converted number
GetPctChange(value1, value2, lookback)
Gets the percentage change between 2 float values over a given lookback period © ZenAndTheArtOfTrading
Parameters:
value1 (float)
value2 (float)
lookback (int)
BarsAboveMA(lookback, ma)
Counts how many candles are above the MA © ZenAndTheArtOfTrading
Parameters:
lookback (int)
ma (float)
Returns: The bar count of how many recent bars are above the MA
BarsBelowMA(lookback, ma)
Counts how many candles are below the MA © ZenAndTheArtOfTrading
Parameters:
lookback (int)
ma (float)
Returns: The bar count of how many recent bars are below the EMA
BarsCrossedMA(lookback, ma)
Counts how many times the EMA was crossed recently © ZenAndTheArtOfTrading
Parameters:
lookback (int)
ma (float)
Returns: The bar count of how many times price recently crossed the EMA
GetPullbackBarCount(lookback, direction)
Counts how many green & red bars have printed recently (ie. pullback count) © ZenAndTheArtOfTrading
Parameters:
lookback (int)
direction (int)
Returns: The bar count of how many candles have retraced over the given lookback & direction
GetSwingHigh(Lookback, SwingType)
Check If Price Has Made A Recent Swing High
Parameters:
Lookback (int) : Is For The Swing High Lookback Period, Defval = 7
SwingType (int) : Is For The Swing High Type Of Identification, Defval = 1
Returns: A Bool - True If Price Has Made A Recent Swing High
GetSwingLow(Lookback, SwingType)
Check If Price Has Made A Recent Swing Low
Parameters:
Lookback (int) : Is For The Swing Low Lookback Period, Defval = 7
SwingType (int) : Is For The Swing Low Type Of Identification, Defval = 1
Returns: A Bool - True If Price Has Made A Recent Swing Low
//====================================================================================================================================================
// Custom Risk Management Functions
//====================================================================================================================================================
CalculateStopLossLevel(OrderType, Entry, StopLoss)
Calculate StopLoss Level
Parameters:
OrderType (int) : Is To Determine A Long / Short Position, Defval = 1
Entry (float) : Is The Entry Level Of The Order, Defval = na
StopLoss (float) : Is The Custom StopLoss Distance, Defval = 2x ATR Below Close
Returns: Float - The StopLoss Level In Actual Price As A
CalculateStopLossDistance(OrderType, Entry, StopLoss)
Calculate StopLoss Distance In Pips
Parameters:
OrderType (int) : Is To Determine A Long / Short Position, Defval = 1
Entry (float) : Is The Entry Level Of The Order, NEED TO INPUT PARAM
StopLoss (float) : Level Based On Previous Calculation, NEED TO INPUT PARAM
Returns: Float - The StopLoss Value In Pips
CalculateTakeProfitLevel(OrderType, Entry, StopLossDistance, RiskReward)
Calculate TakeProfit Level
Parameters:
OrderType (int) : Is To Determine A Long / Short Position, Defval = 1
Entry (float) : Is The Entry Level Of The Order, Defval = na
StopLossDistance (float)
RiskReward (float)
Returns: Float - The TakeProfit Level In Actual Price
CalculateTakeProfitDistance(OrderType, Entry, TakeProfit)
Get TakeProfit Distance In Pips
Parameters:
OrderType (int) : Is To Determine A Long / Short Position, Defval = 1
Entry (float) : Is The Entry Level Of The Order, NEED TO INPUT PARAM
TakeProfit (float) : Level Based On Previous Calculation, NEED TO INPUT PARAM
Returns: Float - The TakeProfit Value In Pips
CalculateConversionCurrency(AccountCurrency, SymbolCurrency, BaseCurrency)
Get The Conversion Currecny Between Current Account Currency & Current Pair's Quoted Currency (FOR FOREX ONLY)
Parameters:
AccountCurrency (simple string) : Is For The Account Currency Used
SymbolCurrency (simple string) : Is For The Current Symbol Currency (Front Symbol)
BaseCurrency (simple string) : Is For The Current Symbol Base Currency (Back Symbol)
Returns: Tuple Of A Bollean (Convert The Currency ?) And A String (Converted Currency)
CalculateConversionRate(ConvertCurrency, ConversionRate)
Get The Conversion Rate Between Current Account Currency & Current Pair's Quoted Currency (FOR FOREX ONLY)
Parameters:
ConvertCurrency (bool) : Is To Check If The Current Symbol Needs To Be Converted Or Not
ConversionRate (float) : Is The Quoted Price Of The Conversion Currency (Input The request.security Function Here)
Returns: Float Price Of Conversion Rate (If In The Same Currency Than Return Value Will Be 1.0)
LotSize(LotSizeSimple, Balance, Risk, SLDistance, ConversionRate)
Get Current Lot Size
Parameters:
LotSizeSimple (bool) : Is To Toggle Lot Sizing Calculation (Simple Is Good Enough For Stocks & Crypto, Whilst Complex Is For Forex)
Balance (float) : Is For The Current Account Balance To Calculate The Lot Sizing Based Off
Risk (float) : Is For The Current Risk Per Trade To Calculate The Lot Sizing Based Off
SLDistance (float) : Is The Current Position StopLoss Distance From Its Entry Price
ConversionRate (float) : Is The Currency Conversion Rate (Used For Complex Lot Sizing Only)
Returns: Float - Position Size In Units
ToLots(Units)
Converts Units To Lots
Parameters:
Units (float) : Is For How Many Units Need To Be Converted Into Lots (Minimun 1000 Units)
Returns: Float - Position Size In Lots
ToUnits(Lots)
Converts Lots To Units
Parameters:
Lots (float) : Is For How Many Lots Need To Be Converted Into Units (Minimun 0.01 Units)
Returns: Int - Position Size In Units
ToLotsInUnits(Units)
Converts Units To Lots Than Back To Units
Parameters:
Units (float) : Is For How Many Units Need To Be Converted Into Lots (Minimun 1000 Units)
Returns: Float - Position Size In Lots That Were Rounded To Units
ATRTrail(OrderType, SourceType, ATRPeriod, ATRMultiplyer, SwingLookback)
Calculate ATR Trailing Stop
Parameters:
OrderType (int) : Is To Determine A Long / Short Position, Defval = 1
SourceType (int) : Is To Determine Where To Calculate The ATR Trailing From, Defval = close
ATRPeriod (simple int) : Is To Change Its ATR Period, Defval = 20
ATRMultiplyer (float) : Is To Change Its ATR Trailing Distance, Defval = 1
SwingLookback (int) : Is To Change Its Swing HiLo Lookback (Only From Source Type 5), Defval = 7
Returns: Float - Number Of The Current ATR Trailing
DangerZone(WinRate, AvgRRR, Filter)
Calculate Danger Zone Of A Given Strategy
Parameters:
WinRate (float) : Is The Strategy WinRate
AvgRRR (float) : Is The Strategy Avg RRR
Filter (float) : Is The Minimum Profit It Needs To Be Out Of BE Zone, Defval = 3
Returns: Int - Value, 1 If Out Of Danger Zone, 0 If BE, -1 If In Danger Zone
IsQuestionableTrades(TradeTP, TradeSL)
Checks For Questionable Trades (Which Are Trades That Its TP & SL Level Got Hit At The Same Candle)
Parameters:
TradeTP (float) : Is The Trade In Question Take Profit Level
TradeSL (float) : Is The Trade In Question Stop Loss Level
Returns: Bool - True If The Last Trade Was A "Questionable Trade"
//====================================================================================================================================================
// Custom Strategy Functions
//====================================================================================================================================================
OpenLong(EntryID, LotSize, LimitPrice, StopPrice, Comment, CommentValue)
Open A Long Order Based On The Given Params
Parameters:
EntryID (string) : Is The Trade Entry ID, Defval = "Long"
LotSize (float) : Is The Lot Size Of The Trade, Defval = 1
LimitPrice (float) : Is The Limit Order Price To Set The Order At, Defval = Na / Market Order Execution
StopPrice (float) : Is The Stop Order Price To Set The Order At, Defval = Na / Market Order Execution
Comment (string) : Is The Order Comment, Defval = Long Entry Order
CommentValue (string) : Is For Custom Values In The Order Comment, Defval = Na
Returns: Void
OpenShort(EntryID, LotSize, LimitPrice, StopPrice, Comment, CommentValue)
Open A Short Order Based On The Given Params
Parameters:
EntryID (string) : Is The Trade Entry ID, Defval = "Short"
LotSize (float) : Is The Lot Size Of The Trade, Defval = 1
LimitPrice (float) : Is The Limit Order Price To Set The Order At, Defval = Na / Market Order Execution
StopPrice (float) : Is The Stop Order Price To Set The Order At, Defval = Na / Market Order Execution
Comment (string) : Is The Order Comment, Defval = Short Entry Order
CommentValue (string) : Is For Custom Values In The Order Comment, Defval = Na
Returns: Void
TP_SLExit(FromID, TPLevel, SLLevel, PercentageClose, Comment, CommentValue)
Exits Based On Predetermined TP & SL Levels
Parameters:
FromID (string) : Is The Trade ID That The TP & SL Levels Be Palced
TPLevel (float) : Is The Take Profit Level
SLLevel (float) : Is The StopLoss Level
PercentageClose (float) : Is The Amount To Close The Order At (In Percentage) Defval = 100
Comment (string) : Is The Order Comment, Defval = Exit Order
CommentValue (string) : Is For Custom Values In The Order Comment, Defval = Na
Returns: Void
CloseLong(ExitID, PercentageClose, Comment, CommentValue, Instant)
Exits A Long Order Based On A Specified Condition
Parameters:
ExitID (string) : Is The Trade ID That Will Be Closed, Defval = "Long"
PercentageClose (float) : Is The Amount To Close The Order At (In Percentage) Defval = 100
Comment (string) : Is The Order Comment, Defval = Exit Order
CommentValue (string) : Is For Custom Values In The Order Comment, Defval = Na
Instant (bool) : Is For Exit Execution Type, Defval = false
Returns: Void
CloseShort(ExitID, PercentageClose, Comment, CommentValue, Instant)
Exits A Short Order Based On A Specified Condition
Parameters:
ExitID (string) : Is The Trade ID That Will Be Closed, Defval = "Short"
PercentageClose (float) : Is The Amount To Close The Order At (In Percentage) Defval = 100
Comment (string) : Is The Order Comment, Defval = Exit Order
CommentValue (string) : Is For Custom Values In The Order Comment, Defval = Na
Instant (bool) : Is For Exit Execution Type, Defval = false
Returns: Void
BrokerCheck(Broker)
Checks Traded Broker With Current Loaded Chart Broker
Parameters:
Broker (string) : Is The Current Broker That Is Traded
Returns: Bool - True If Current Traded Broker Is Same As Loaded Chart Broker
OpenPC(LicenseID, OrderType, UseLimit, LimitPrice, SymbolPrefix, Symbol, SymbolSuffix, Risk, SL, TP, OrderComment, Spread)
Compiles Given Parameters Into An Alert String Format To Open Trades Using Pine Connector
Parameters:
LicenseID (string) : Is The Users PineConnector LicenseID
OrderType (int) : Is The Desired OrderType To Open
UseLimit (bool) : Is If We Want To Enter The Position At Exactly The Previous Closing Price
LimitPrice (float) : Is The Limit Price Of The Trade (Only For Pending Orders)
SymbolPrefix (string) : Is The Current Symbol Prefix (If Any)
Symbol (string) : Is The Traded Symbol
SymbolSuffix (string) : Is The Current Symbol Suffix (If Any)
Risk (float) : Is The Trade Risk Per Trade / Fixed Lot Sizing
SL (float) : Is The Trade SL In Price / In Pips
TP (float) : Is The Trade TP In Price / In Pips
OrderComment (string) : Is The Executed Trade Comment
Spread (float) : is The Maximum Spread For Execution
Returns: String - Pine Connector Order Syntax Alert Message
ClosePC(LicenseID, OrderType, SymbolPrefix, Symbol, SymbolSuffix)
Compiles Given Parameters Into An Alert String Format To Close Trades Using Pine Connector
Parameters:
LicenseID (string) : Is The Users PineConnector LicenseID
OrderType (int) : Is The Desired OrderType To Close
SymbolPrefix (string) : Is The Current Symbol Prefix (If Any)
Symbol (string) : Is The Traded Symbol
SymbolSuffix (string) : Is The Current Symbol Suffix (If Any)
Returns: String - Pine Connector Order Syntax Alert Message
//====================================================================================================================================================
// Custom Backtesting Calculation Functions
//====================================================================================================================================================
CalculatePNL(EntryPrice, ExitPrice, LotSize, ConversionRate)
Calculates Trade PNL Based On Entry, Eixt & Lot Size
Parameters:
EntryPrice (float) : Is The Trade Entry
ExitPrice (float) : Is The Trade Exit
LotSize (float) : Is The Trade Sizing
ConversionRate (float) : Is The Currency Conversion Rate (Used For Complex Lot Sizing Only)
Returns: Float - The Current Trade PNL
UpdateBalance(PrevBalance, PNL)
Updates The Previous Ginve Balance To The Next PNL
Parameters:
PrevBalance (float) : Is The Previous Balance To Be Updated
PNL (float) : Is The Current Trade PNL To Be Added
Returns: Float - The Current Updated PNL
CalculateSlpComm(PNL, MaxRate)
Calculates Random Slippage & Commisions Fees Based On The Parameters
Parameters:
PNL (float) : Is The Current Trade PNL
MaxRate (float) : Is The Upper Limit (In Percentage) Of The Randomized Fee
Returns: Float - A Percentage Fee Of The Current Trade PNL
UpdateDD(MaxBalance, Balance)
Calculates & Updates The DD Based On Its Given Parameters
Parameters:
MaxBalance (float) : Is The Maximum Balance Ever Recorded
Balance (float) : Is The Current Account Balance
Returns: Float - The Current Strategy DD
CalculateWR(TotalTrades, LongID, ShortID)
Calculate The Total, Long & Short Trades Win Rate
Parameters:
TotalTrades (int) : Are The Current Total Trades That The Strategy Has Taken
LongID (string) : Is The Order ID Of The Long Trades Of The Strategy
ShortID (string) : Is The Order ID Of The Short Trades Of The Strategy
Returns: Tuple Of Long WR%, Short WR%, Total WR%, Total Winning Trades, Total Losing Trades, Total Long Trades & Total Short Trades
CalculateAvgRRR(WinTrades, LossTrades)
Calculates The Overall Strategy Avg Risk Reward Ratio
Parameters:
WinTrades (int) : Are The Strategy Winning Trades
LossTrades (int) : Are The Strategy Losing Trades
Returns: Float - The Average RRR Values
CAGR(StartTime, StartPrice, EndTime, EndPrice)
Calculates The CAGR Over The Given Time Period © TradingView
Parameters:
StartTime (int) : Is The Starting Time Of The Calculation
StartPrice (float) : Is The Starting Price Of The Calculation
EndTime (int) : Is The Ending Time Of The Calculation
EndPrice (float) : Is The Ending Price Of The Calculation
Returns: Float - The CAGR Values
//====================================================================================================================================================
// Custom Plot Functions
//====================================================================================================================================================
EditLabels(LabelID, X1, Y1, Text, Color, TextColor, EditCondition, DeleteCondition)
Edit / Delete Labels
Parameters:
LabelID (label) : Is The ID Of The Selected Label
X1 (int) : Is The X1 Coordinate IN BARINDEX Xloc
Y1 (float) : Is The Y1 Coordinate IN PRICE Yloc
Text (string) : Is The Text Than Wants To Be Written In The Label
Color (color) : Is The Color Value Change Of The Label Text
TextColor (color)
EditCondition (int) : Is The Edit Condition of The Line (Setting Location / Color)
DeleteCondition (bool) : Is The Delete Condition Of The Line If Ture Deletes The Prev Itteration Of The Line
Returns: Void
EditLine(LineID, X1, Y1, X2, Y2, Color, EditCondition, DeleteCondition)
Edit / Delete Lines
Parameters:
LineID (line) : Is The ID Of The Selected Line
X1 (int) : Is The X1 Coordinate IN BARINDEX Xloc
Y1 (float) : Is The Y1 Coordinate IN PRICE Yloc
X2 (int) : Is The X2 Coordinate IN BARINDEX Xloc
Y2 (float) : Is The Y2 Coordinate IN PRICE Yloc
Color (color) : Is The Color Value Change Of The Line
EditCondition (int) : Is The Edit Condition of The Line (Setting Location / Color)
DeleteCondition (bool) : Is The Delete Condition Of The Line If Ture Deletes The Prev Itteration Of The Line
Returns: Void
//====================================================================================================================================================
// Custom Display Functions (Using Tables)
//====================================================================================================================================================
FillTable(TableID, Column, Row, Title, Value, BgColor, TextColor, ToolTip)
Filling The Selected Table With The Inputed Information
Parameters:
TableID (table) : Is The Table ID That Wants To Be Edited
Column (int) : Is The Current Column Of The Table That Wants To Be Edited
Row (int) : Is The Current Row Of The Table That Wants To Be Edited
Title (string) : Is The String Title Of The Current Cell Table
Value (string) : Is The String Value Of The Current Cell Table
BgColor (color) : Is The Selected Color For The Current Table
TextColor (color) : Is The Selected Color For The Current Table
ToolTip (string) : Is The ToolTip Of The Current Cell In The Table
Returns: Void
DisplayBTResults(TableID, BgColor, TextColor, StartingBalance, Balance, DollarReturn, TotalPips, MaxDD)
Filling The Selected Table With The Inputed Information
Parameters:
TableID (table) : Is The Table ID That Wants To Be Edited
BgColor (color) : Is The Selected Color For The Current Table
TextColor (color) : Is The Selected Color For The Current Table
StartingBalance (float) : Is The Account Starting Balance
Balance (float)
DollarReturn (float) : Is The Account Dollar Reture
TotalPips (float) : Is The Total Pips Gained / loss
MaxDD (float) : Is The Maximum Drawdown Over The Backtesting Period
Returns: Void
DisplayBTResultsV2(TableID, BgColor, TextColor, TotalWR, QTCount, LongWR, ShortWR, InitialCapital, CumProfit, CumFee, AvgRRR, MaxDD, CAGR, MeanDD)
Filling The Selected Table With The Inputed Information
Parameters:
TableID (table) : Is The Table ID That Wants To Be Edited
BgColor (color) : Is The Selected Color For The Current Table
TextColor (color) : Is The Selected Color For The Current Table
TotalWR (float) : Is The Strategy Total WR In %
QTCount (int) : Is The Strategy Questionable Trades Count
LongWR (float) : Is The Strategy Total WR In %
ShortWR (float) : Is The Strategy Total WR In %
InitialCapital (float) : Is The Strategy Initial Starting Capital
CumProfit (float) : Is The Strategy Ending Cumulative Profit
CumFee (float) : Is The Strategy Ending Cumulative Fee (Based On Randomized Fee Assumptions)
AvgRRR (float) : Is The Strategy Average Risk Reward Ratio
MaxDD (float) : Is The Strategy Maximum DrawDown In Its Backtesting Period
CAGR (float) : Is The Strategy Compounded Average GRowth In %
MeanDD (float) : Is The Strategy Mean / Average Drawdown In The Backtesting Period
Returns: Void
//====================================================================================================================================================
// Custom Pattern Detection Functions
//====================================================================================================================================================
BullFib(priceLow, priceHigh, fibRatio)
Calculates A Bullish Fibonacci Value (From Swing Low To High) © ZenAndTheArtOfTrading
Parameters:
priceLow (float)
priceHigh (float)
fibRatio (float)
Returns: The Fibonacci Value Of The Given Ratio Between The Two Price Points
BearFib(priceLow, priceHigh, fibRatio)
Calculates A Bearish Fibonacci Value (From Swing High To Low) © ZenAndTheArtOfTrading
Parameters:
priceLow (float)
priceHigh (float)
fibRatio (float)
Returns: The Fibonacci Value Of The Given Ratio Between The Two Price Points
GetBodySize()
Gets The Current Candle Body Size IN POINTS © ZenAndTheArtOfTrading
Returns: The Current Candle Body Size IN POINTS
GetTopWickSize()
Gets The Current Candle Top Wick Size IN POINTS © ZenAndTheArtOfTrading
Returns: The Current Candle Top Wick Size IN POINTS
GetBottomWickSize()
Gets The Current Candle Bottom Wick Size IN POINTS © ZenAndTheArtOfTrading
Returns: The Current Candle Bottom Wick Size IN POINTS
GetBodyPercent()
Gets The Current Candle Body Size As A Percentage Of Its Entire Size Including Its Wicks © ZenAndTheArtOfTrading
Returns: The Current Candle Body Size IN PERCENTAGE
GetTopWickPercent()
Gets The Current Top Wick Size As A Percentage Of Its Entire Body Size
Returns: Float - The Current Candle Top Wick Size IN PERCENTAGE
GetBottomWickPercent()
Gets The Current Bottom Wick Size As A Percentage Of Its Entire Bodu Size
Returns: Float - The Current Candle Bottom Size IN PERCENTAGE
BullishEC(Allowance, RejectionWickSize, EngulfWick, NearSwings, SwingLookBack)
Checks If The Current Bar Is A Bullish Engulfing Candle
Parameters:
Allowance (int) : To Give Flexibility Of Engulfing Pattern Detection In Markets That Have Micro Gaps, Defval = 0
RejectionWickSize (float) : To Filter Out long (Upper And Lower) Wick From The Bullsih Engulfing Pattern, Defval = na
EngulfWick (bool) : To Specify If We Want The Pattern To Also Engulf Its Upper & Lower Previous Wicks, Defval = false
NearSwings (bool) : To Specify If We Want The Pattern To Be Near A Recent Swing Low, Defval = true
SwingLookBack (int) : To Specify How Many Bars Back To Detect A Recent Swing Low, Defval = 10
Returns: Bool - True If The Current Bar Matches The Requirements of a Bullish Engulfing Candle
BearishEC(Allowance, RejectionWickSize, EngulfWick, NearSwings, SwingLookBack)
Checks If The Current Bar Is A Bearish Engulfing Candle
Parameters:
Allowance (int) : To Give Flexibility Of Engulfing Pattern Detection In Markets That Have Micro Gaps, Defval = 0
RejectionWickSize (float) : To Filter Out long (Upper And Lower) Wick From The Bearish Engulfing Pattern, Defval = na
EngulfWick (bool) : To Specify If We Want The Pattern To Also Engulf Its Upper & Lower Previous Wicks, Defval = false
NearSwings (bool) : To Specify If We Want The Pattern To Be Near A Recent Swing High, Defval = true
SwingLookBack (int) : To Specify How Many Bars Back To Detect A Recent Swing High, Defval = 10
Returns: Bool - True If The Current Bar Matches The Requirements of a Bearish Engulfing Candle
Hammer(Fib, ColorMatch, NearSwings, SwingLookBack, ATRFilterCheck, ATRPeriod)
Checks If The Current Bar Is A Hammer Candle
Parameters:
Fib (float) : To Specify Which Fibonacci Ratio To Use When Determining The Hammer Candle, Defval = 0.382 Ratio
ColorMatch (bool) : To Filter Only Bullish Closed Hammer Candle Pattern, Defval = false
NearSwings (bool) : To Specify If We Want The Doji To Be Near A Recent Swing Low, Defval = true
SwingLookBack (int) : To Specify How Many Bars Back To Detect A Recent Swing Low, Defval = 10
ATRFilterCheck (float) : To Filter Smaller Hammer Candles That Might Be Better Classified As A Doji Candle, Defval = 1
ATRPeriod (simple int) : To Change ATR Period Of The ATR Filter, Defval = 20
Returns: Bool - True If The Current Bar Matches The Requirements of a Hammer Candle
Star(Fib, ColorMatch, NearSwings, SwingLookBack, ATRFilterCheck, ATRPeriod)
Checks If The Current Bar Is A Hammer Candle
Parameters:
Fib (float) : To Specify Which Fibonacci Ratio To Use When Determining The Hammer Candle, Defval = 0.382 Ratio
ColorMatch (bool) : To Filter Only Bullish Closed Hammer Candle Pattern, Defval = false
NearSwings (bool) : To Specify If We Want The Doji To Be Near A Recent Swing Low, Defval = true
SwingLookBack (int) : To Specify How Many Bars Back To Detect A Recent Swing Low, Defval = 10
ATRFilterCheck (float) : To Filter Smaller Hammer Candles That Might Be Better Classified As A Doji Candle, Defval = 1
ATRPeriod (simple int) : To Change ATR Period Of The ATR Filter, Defval = 20
Returns: Bool - True If The Current Bar Matches The Requirements of a Hammer Candle
Doji(MaxWickSize, MaxBodySize, DojiType, NearSwings, SwingLookBack)
Checks If The Current Bar Is A Doji Candle
Parameters:
MaxWickSize (float) : To Specify The Maximum Lenght Of Its Upper & Lower Wick, Defval = 2
MaxBodySize (float) : To Specify The Maximum Lenght Of Its Candle Body IN PERCENT, Defval = 0.05
DojiType (int)
NearSwings (bool) : To Specify If We Want The Doji To Be Near A Recent Swing High / Low (Only In Dragonlyf / Gravestone Mode), Defval = true
SwingLookBack (int) : To Specify How Many Bars Back To Detect A Recent Swing High / Low (Only In Dragonlyf / Gravestone Mode), Defval = 10
Returns: Bool - True If The Current Bar Matches The Requirements of a Doji Candle
BullishIB(Allowance, RejectionWickSize, EngulfWick, NearSwings, SwingLookBack)
Checks If The Current Bar Is A Bullish Harami Candle
Parameters:
Allowance (int) : To Give Flexibility Of Harami Pattern Detection In Markets That Have Micro Gaps, Defval = 0
RejectionWickSize (float) : To Filter Out long (Upper And Lower) Wick From The Bullsih Harami Pattern, Defval = na
EngulfWick (bool) : To Specify If We Want The Pattern To Also Engulf Its Upper & Lower Previous Wicks, Defval = false
NearSwings (bool) : To Specify If We Want The Pattern To Be Near A Recent Swing Low, Defval = true
SwingLookBack (int) : To Specify How Many Bars Back To Detect A Recent Swing Low, Defval = 10
Returns: Bool - True If The Current Bar Matches The Requirements of a Bullish Harami Candle
BearishIB(Allowance, RejectionWickSize, EngulfWick, NearSwings, SwingLookBack)
Checks If The Current Bar Is A Bullish Harami Candle
Parameters:
Allowance (int) : To Give Flexibility Of Harami Pattern Detection In Markets That Have Micro Gaps, Defval = 0
RejectionWickSize (float) : To Filter Out long (Upper And Lower) Wick From The Bearish Harami Pattern, Defval = na
EngulfWick (bool) : To Specify If We Want The Pattern To Also Engulf Its Upper & Lower Previous Wicks, Defval = false
NearSwings (bool) : To Specify If We Want The Pattern To Be Near A Recent Swing High, Defval = true
SwingLookBack (int) : To Specify How Many Bars Back To Detect A Recent Swing High, Defval = 10
Returns: Bool - True If The Current Bar Matches The Requirements of a Bearish Harami Candle
//====================================================================================================================================================
// Custom Time Functions
//====================================================================================================================================================
BarInSession(sess, useFilter)
Determines if the current price bar falls inside the specified session © ZenAndTheArtOfTrading
Parameters:
sess (simple string)
useFilter (bool)
Returns: A boolean - true if the current bar falls within the given time session
BarOutSession(sess, useFilter)
Determines if the current price bar falls outside the specified session © ZenAndTheArtOfTrading
Parameters:
sess (simple string)
useFilter (bool)
Returns: A boolean - true if the current bar falls outside the given time session
DateFilter(startTime, endTime)
Determines if this bar's time falls within date filter range © ZenAndTheArtOfTrading
Parameters:
startTime (int)
endTime (int)
Returns: A boolean - true if the current bar falls within the given dates
DayFilter(monday, tuesday, wednesday, thursday, friday, saturday, sunday)
Checks if the current bar's day is in the list of given days to analyze © ZenAndTheArtOfTrading
Parameters:
monday (bool)
tuesday (bool)
wednesday (bool)
thursday (bool)
friday (bool)
saturday (bool)
sunday (bool)
Returns: A boolean - true if the current bar's day is one of the given days
AUSSess()
Checks If The Current Australian Forex Session In Running
Returns: Bool - True If Currently The Australian Session Is Running
ASIASess()
Checks If The Current Asian Forex Session In Running
Returns: Bool - True If Currently The Asian Session Is Running
EURSess()
Checks If The Current European Forex Session In Running
Returns: Bool - True If Currently The European Session Is Running
USSess()
Checks If The Current US Forex Session In Running
Returns: Bool - True If Currently The US Session Is Running
UNIXToDate(Time, ConversionType, TimeZone)
Converts UNIX Time To Datetime
Parameters:
Time (int) : Is The UNIX Time Input
ConversionType (int) : Is The Datetime Output Format, Defval = DD-MM-YYYY
TimeZone (string) : Is To Convert The Outputed Datetime Into The Specified Time Zone, Defval = Exchange Time Zone
Returns: String - String Of Datetime

LiquidEdge Original1️⃣ Why Most Traders Miss Key Market Turning Points
Most traders (you) struggle to identify true market pivots THE REAL TOP and BOTTOMS where reversals begin.
❌ You enter too early or too late because price alone doesn’t give enough confirmation
❌ You follow price blindly, unaware of the volume pressure building underneath
❌ You get caught in sideways markets, not realizing they’re often accumulation or distribution zones
❌ You can’t tell if momentum is building or fading, which leads to low confidence and inconsistent results
👉 LiquidEdge helps solve this by tracking volume momentum through a modified MFI slope and scoring system. It highlights potential pivots with real context, so you can see where smart money might be entering or exiting before price makes it obvious.
2️⃣ What LiquidEdge Actually Does and How
LiquidEdge helps solve common trading problems by adding structure and clarity to volume analysis.
✅ It builds on the classic Money Flow Index (MFI), but instead of just showing overbought/oversold levels, it calculates the slope of MFI to track real-time changes in volume momentum
✅ Each setup is scored based on a combination of factors: divergence strength, trend alignment using EMA, and whether the signal occurs inside a liquidity zone
✅ Hidden accumulation or distribution is revealed when volume pressure increases or fades while price remains flat or moves slightly, a sign of smart money positioning
✅ Divergences are only flagged when they occur near pivot zones and align with overall trend conditions, helping reduce false signals
✅ Potential pivots are identified when multiple factors overlap such as a liquidity zone breach, volume slope shift, and valid divergence which often signals entry or exit points for institutional players
👉 The result is a structured interpretation of price and volume flow, helping traders read momentum shifts and potential reversals more clearly in both trending and ranging markets.
3️⃣ What Makes LiquidEdge Different
LiquidEdge is built on top of the classic Money Flow Index (MFI), but adds structure that transforms it from a basic momentum tool into a decision-support system.
Instead of simply showing highs and lows, it scores each potential setup based on:
✅ The steepness and direction of the MFI slope (used to measure volume pressure)
✅ Whether the setup aligns with the broader trend using an EMA filter (default: 200 EMA)
✅ Whether the signal appears inside predefined liquidity zones (MFI above 80 or below 20)
👉 This scoring system reduces noise and helps you focus only on high-probability setups.
👉 It also checks volume pressure across multiple timeframes using MFI slope on 5M, 15M, 1H, 4H, and Daily charts. This reveals whether short-term moves are backed by longer-term volume momentum.
Color changes in the line and histogram are not decorative they reflect real shifts in volume pressure. Every visual cue is linked to live market logic.
What Makes It Stand Out
👉 Setup Scoring That Makes Sense
Each setup is scored by combining:
Signal strength (MFI slope intensity and stability)
Trend direction (via customizable EMA)
Liquidity zone relevance (MFI range filtering)
This structured scoring means you spend less time second-guessing and more time reading clean signals.
👉 Flow That Follows Real Momentum
The slope of the MFI tracks whether volume pressure is rising or falling:
🟢 Green = increasing inflow (buying pressure)
🔴 Red = increasing outflow (selling pressure)
👉 Multi-Timeframe Volume Context
LiquidEdge calculates flow direction independently on each major timeframe. You’ll know if short-term setups are confirmed by higher timeframe volume or going against it.
👉 Smart Divergence Filtering
Unlike simple divergence tools that compare price highs/lows directly, LiquidEdge filters divergences based on:
Local pivot zones (defined by lookback periods)
Trend confirmation (to eliminate countertrend noise)
4️⃣ How LiquidEdge Works (Under the Hood)
LiquidEdge tracks directional momentum using the slope of the Money Flow Index (MFI) giving you a real-time read on buying and selling pressure.
When the slope rises, it means buyers are stepping in and volume is supporting the move.
When it falls, sellers are taking control and volume outflow is increasing.
This slope acts like a pressure gauge for the market, helping you spot when a trend has strength or when it's starting to fade.
💡 Quick Comparison
RSI = momentum from price
MFI = momentum from price + volume
LiquidEdge takes it one step further by calculating the rate of change (slope) in MFI. That’s where the pressure signal comes from not just value, but directional flow.
Core Calculations (Simplified)
Typical Price = (High + Low + Close) ÷ 3
Raw Money Flow = Typical Price × Volume
MFI = 100 −
MFI ranges from 0 to 100.
High = strong buying volume
Low = growing selling pressure
LiquidEdge then calculates the slope of this MFI over time to track volume momentum dynamically.
Divergence Engine
LiquidEdge detects divergence by comparing price pivots with the direction of MFI slope.
❌ If price makes a higher high but MFI slope turns down, it’s a bearish divergence
✅ If price makes a lower low but MFI slope rises, it’s a bullish divergence
Divergences are only confirmed when they occur:
Near local pivot zones (defined by configurable lookback windows)
And, optionally, in alignment with the broader trend using an EMA filter
This filtering helps reduce false positives and keeps you focused on clean setups.
Structured Confidence Scoring
Each signal is visually scored based on:
➡️ Whether a valid divergence is detected
➡️ Whether the signal occurs inside a liquidity zone (MFI > 80 or < 20)
➡️ Whether the setup aligns with the overall trend direction (EMA filter)
More confluence = higher confidence
The scoring system helps prioritize setups that meet multiple criteria, not just one.
Liquidity Zones
Above 80: Signals possible buying exhaustion 👉 risk of reversal
Below 20: Indicates potential selling exhaustion 👉 watch for a bounce
Zones are shaded directly on the chart to highlight pressure extremes in real time.
Price + Volume Fusion
LiquidEdge blends price action with volume pressure using MFI slope and histogram behavior. It doesn’t just show you where price is moving. it shows whether the move is backed by real volume.
This lets you see:
Whether volume is confirming or fading behind a move
If a reversal is building even before price confirms it
Visual Feedback That Speaks Clearly
🟢 Green slope = increasing buying pressure
🔴 Red slope = increasing selling pressure
5️⃣ When Price Is Flat but LiquidEdge Moves: Volume Tells the Truth
One of the most useful things LiquidEdge can do is reveal pressure shifts when price looks neutral.
If price is moving sideways but the MFI slope or histogram rises, it may suggest that buying pressure is quietly increasing possibly pointing to early accumulation.
If price stays flat while the volume slope or histogram drops, this could indicate distribution, where sellers are exiting without moving the market noticeably.
These changes don’t guarantee a breakout or breakdown, but they often precede key moves especially when combined with other confluences like trend alignment or liquidity zones.
👉 LiquidEdge helps spot these setups by measuring volume momentum shifts beneath price action.
It doesn’t predict the future, but it gives you additional context to evaluate what may be developing before it’s visible on price alone.
6️⃣ Multi-Timeframe Flow Table
LiquidEdge includes a real-time table that tracks volume pressure across multiple timeframes including 5-minute, 15-minute, 1-hour, 4-hour, and daily charts.
Each row reflects the direction of the MFI slope on that timeframe, indicating whether volume pressure is increasing (inflow) or decreasing (outflow).
🟢 A rising slope suggests that buying momentum is building
🔴 A falling slope suggests selling pressure may be increasing
👉 This lets traders quickly assess whether short-term setups are aligned with higher timeframe volume trends a useful layer of confirmation for both intraday and swing strategies.
Rather than flipping between charts, the table gives you a snapshot of flow strength across the board, helping you stay focused on opportunities that align with broader market pressure.
7️⃣ Timeframes & Assets
Where LiquidEdge Works Best:
✅ Crypto: Supports major coins and high-volume altcoins (BTC, ETH, Top 100)
✅ Stocks: Effective on large-cap and mid-cap equities with consistent volume
✅ Futures: Tested on instruments like NQ, MNQ, ES, and MES
✅ Any liquid market where volume data is reliable and stable
For best results, use LiquidEdge on assets with consistent trading volume. It’s not recommended for ultra-low volume crypto pairs or micro-cap stocks, where irregular volume can distort signals.
Recommended Timeframes:
👉 Intraday trading: Works well on 3-minute, 5-minute, 15-minute, and 1-hour charts
👉 Swing trading: Performs reliably on 4-hour, daily, and weekly charts
👉 Ultra short-term (1-minute or less): Not recommended due to high noise and low reliability
LiquidEdge adapts to various trading styles from scalping short-term momentum shifts to analyzing broader volume trends across swing and positional setups. The key is choosing assets and timeframes with reliable volume flow for the tool to work effectively.
8️⃣ Common Mistakes to Avoid When Using LiquidEdge
❌ Using It in Isolation
LiquidEdge offers valuable context, but it’s not designed to function as a standalone trading system. Always combine it with key tools such as trendlines, support/resistance zones, chart structure, or fundamental data. The more supporting evidence you have, the stronger your analysis becomes.
❌ Relying on a Single Indicator
No indicator, including LiquidEdge, can account for every market condition. It’s important to use it alongside other forms of confirmation to avoid making decisions based on limited data.
❌ Misinterpreting Divergences as Reversals
A divergence between price and volume pressure doesn't always signal the end of a trend. If the broader direction remains strong (based on EMAs or higher timeframe volume flow), a divergence could reflect temporary consolidation rather than reversal.
❌ Ignoring Trend Alignment and Confidence Scoring
LiquidEdge includes confidence scoring to help validate signals. Disregarding this structure can lead to reacting to weak or out-of-context divergences, especially in choppy or low-volume environments.
❌ Using It on Second-Based or Tick Charts
Very low timeframes introduce too much noise, which can distort volume slope and divergence signals. For intraday analysis, start with 3-minute charts or higher. For swing trading, use 4H and up for clearer, more reliable structure.
9️⃣ LiquidEdge Settings Overview
A quick breakdown of what you can customize in the indicator and how each option affects what you see:
➡️ LiquidEdge Length
Controls how sensitive the indicator is to changes in volume pressure (via MFI slope).
Shorter values = faster response, more frequent signals
Longer values = smoother output, less noise
👉 Default: 14
➡️ EMA Trend Filter
Determines overall trend direction based on EMA slope. Used to filter out signals that go against the broader move.
Helps reduce countertrend entries
Adjustable to suit your strategy
👉 Recommended: 200 EMA
➡️ Pivot Lookback (Left & Right)
Defines how many bars the system looks back and forward to identify swing highs/lows for divergence detection.
Narrow: more responsive but can be noisy
Wide: slower but more stable pivot zones
👉 Default: 5 left / 5 right
➡️ Histogram Toggle
Enables a visual histogram showing how volume pressure deviates from its recent average.
Useful for spotting shifts in flow intensity
👉 Optional for added visual detail
➡️ Liquidity Zones
Highlights potential exhaustion zones based on MFI value:
Above 80 = potential distribution (buying pressure peaking)
Below 20 = possible accumulation (selling pressure fading)
👉 Zones are fully customizable (color, opacity, background)
➡️ Custom Threshold Zones
Set your own upper/lower boundaries for liquidity extremes helpful when adapting to different markets or asset classes.
👉 Especially useful outside of crypto/forex
➡️ Show LiquidEdge Line
Toggle the main MFI slope line. When turned off, liquidity zones and levels also disappear.
👉 Use if you prefer to focus only on histogram/divergences
➡️ Style Settings
Customize line colors, histogram appearance, and background shading
👉 Helps tailor visuals to your chart layout
➡️ Simplified Mode
Removes all colors and replaces visuals with a clean, grayscale output.
👉 Ideal for minimalist or distraction-free charting
➡️ Signal Score Label
Displays the confidence score of the current setup, based on:
Divergence presence
Liquidity zone positioning
Trend alignment (EMA)
👉 Tooltip explains how the score is calculated
➡️ Divergence Labels
Shows “Bullish” or “Bearish” labels at divergence points.
Optional Filters based on trend if EMA filter is active
➡️ Multi-Timeframe Flow Table
Shows directional flow (based on MFI slope) across: 5M, 15M, 1H, 4H, 1D
Color-coded (faded green/red) for clarity
👉 Table position is customizable on your chart
➡️ Alerts
Get notified when any of these conditions are met:
✅ Bullish or bearish divergence detected
✅ Price enters high/low liquidity zones
✅ Signal score reaches a defined value
➡️ Visibility Settings
Control which timeframes display the LiquidEdge indicator
👉 Best used on 3-minute and above
⚠️ Not recommended on ultra-low or second-based charts due to noise
🔟 Q&A – What Traders Usually Ask
➡️ Can this help reduce bad trades?
To a degree, yes. LiquidEdge is built to highlight areas where price may react, based on volume pressure, liquidity zones, and divergence patterns. It can offer clarity in sideways or messy markets, helping traders avoid impulsive or poorly timed entries.
That said, it’s not predictive or guaranteed. It works best when used with broader context including structure, support/resistance, trend, and volume-based confluence.
👉 Reminder: LiquidEdge is not a signal tool. It’s a decision-support framework designed to help you assess potential shifts, not replace judgment or trading rules.
➡️ Is this just another flashy signal tool?
No. LiquidEdge doesn’t give buy/sell alerts. Instead, it visualizes volume shifts using MFI slope, divergence filtering, and trend-based scoring. It’s built to help you understand why price action may be changing not just react to a one-dimensional signal.
You’re seeing how volume pressure evolves across timeframes, which gives added context to what’s unfolding in the market.
➡️ How do I know this isn’t just another overhyped tool?
LiquidEdge is based on real trading logic: volume pressure (via MFI slope), price behavior, and divergence within trend and liquidity zones. It was developed and tested by traders, not packaged by marketers.
No performance is guaranteed. It’s designed to support your decisions not promise results.
➡️ Will this work with my trading style?
If you trade any market with volume crypto, stocks, or futures LiquidEdge can add value.
✔️ Scalpers: Best from 3-minute and up
✔️ Swing traders: Works well on 4H, Daily, Weekly
✔️ Investors: Weekly charts show pressure buildup over time
⚠️ Avoid ultra-low timeframes (under 1M) or illiquid markets, as noise and irregular data can reduce reliability.
➡️ Can I trust the signals?
These are not buy/sell signals. LiquidEdge offers confidence-weighted insights based on:
✔️ Valid divergence
✔️ Zone positioning (above 80 / below 20)
✔️ Optional trend alignment (via EMA)
Each setup is scored visually to reflect how much confluence exists. You can combine that information with structure, price action, or your existing tools to evaluate opportunities.
👉 Think of LiquidEdge as a decision filter not a trigger.
It’s meant to slow down impulsive trades and help you make more context-aware decisions.
1️⃣1️⃣ Limitations – Know When It’s Less Effective
LiquidEdge performs best in stable, high-volume markets where volume data is consistent and structure is visible.
It’s not recommended for:
❌ Low-volume tokens
❌ Micro-cap or penny stocks
❌ Newly listed assets with limited trading history
These types of markets often show inconsistent or erratic volume behavior, making it difficult for LiquidEdge to accurately assess pressure or identify reliable divergences.
⚠️ During major news events or sudden volatility spikes, volume and price behavior can become disconnected or extreme. This may distort MFI slope calculations and reduce the accuracy of divergence or confidence scoring.
LiquidEdge is built to read structured volume flow. When market conditions become highly erratic or unpredictable, it's best to:
Wait for structure to return
Use it alongside other filters for additional confirmation
This isn't a flaw it's simply the nature of tools that rely on consistency in price and volume data.
1️⃣2️⃣ Real Chart Examples – See It in Action
Now that you’ve seen how LiquidEdge works, here are real-world chart examples from various asset classes
including:
✅ Crypto
✅ Stocks
✅ Futures
✅ Commodities
These examples demonstrate how LiquidEdge behaves under different conditions, and how both the line (MFI slope) and histogram (volume deviation) can be used to interpret market flow.
In each walkthrough, you’ll see:
How the histogram can highlight potential momentum shifts
When the slope line provides stronger directional clarity
Examples of possible hidden accumulation or distribution (before price responds)
What to watch out for such as weak volume, false divergences, or conflicting flow signals
👉 These are real examples based on live market data not theoretical setups. They’re meant to help you recognize how LiquidEdge reacts across multiple styles and timeframes.
Let’s walk through each one and break down the logic step by step, so you can understand how to evaluate setups using structure, volume behavior, and context-driven confluence.
Example: Microsoft (MSFT) – Possible Hidden Accumulation
In this setup, price was moving lower within a short-term downtrend. However, LiquidEdge began showing signs of increasing inflow pressure a common characteristic of accumulation, where volume rises even as price declines.
This divergence suggested that buying interest may have been increasing behind the scenes, despite weak price action on the surface.
Step-by-step breakdown:
👉 Trend context – Price was clearly trending down at the time
👉 Volume divergence – Price made lower lows, but LiquidEdge slope was rising = possible bullish divergence
👉 Accumulation clue – The rising slope, despite falling price, pointed to volume inflow often seen during quiet accumulation
👉 Histogram support – Volume pressure (via the histogram) also increased, confirming the flow shift
👉 Anticipating reaction – When liquidity pressure rises ahead of price, it can signal potential reversal interest
In this case, price later moved sharply higher. While not guaranteed, setups like this illustrate how divergence + volume flow may help highlight early accumulation zones before price confirms the shift.
Same Setup – Focusing on the Histogram Alone
Here, we’re revisiting the Microsoft setup but this time focusing only on the histogram, without the MFI slope line.
Even without the directional slope, the histogram showed rising volume pressure while price continued to drift lower. This visual pattern may indicate that buying interest was quietly increasing, despite weak price movement.
This is where the histogram adds value: it helps visualize the intensity of volume flow over time. When volume pressure builds during a flat or declining price phase, it can be consistent with accumulation where larger participants begin positioning before the market responds.
This example highlights how the histogram alone can provide early insight into underlying volume dynamics even before price shifts noticeably.
Filtering with EMA and why It Matters
Here, we revisit the Microsoft example this time applying the 200 EMA filter, which helps define the broader trend.
Once enabled, LiquidEdge automatically removed any bullish or bearish divergence signals that were against the prevailing trend. This helped reduce noise and focus only on setups aligned with market structure.
✅ The EMA acts as a contextual filter.
For example, if a bullish divergence occurs during a confirmed downtrend, LiquidEdge suppresses that signal helping you avoid setups that may carry more risk.
This filtering mechanism is especially useful in fast or choppy markets, where not all divergences are meaningful.
Want More Flexibility? Adjust the Filter
If you're a more aggressive trader or prefer shorter-term signals, you can reduce the EMA length (e.g., to 150, 50, or even 25). This increases the number of setups shown but also raises the importance of additional context and confirmation.
⚠️ Keep in mind:
❌ More signals doesn’t always mean better outcomes
✅ Focused, context-aware signals tend to be more consistent with broader market pressure
If you’re using this in combination with strategies like options trading, this filter can help refine your entry zones especially when paired with other structure or volatility tools.
Distribution Example and Bitcoin Setup Before a Major Drop
In this example, Bitcoin was trading in a relatively tight range while price continued to push upward. However, LiquidEdge began to show signs of volume outflow, which can suggest potential distribution.
Here’s what was observed:
🔴 Price was moving up inside a horizontal range
🔴 LiquidEdge’s slope indicated declining volume pressure
🔴 Several bearish divergence signals appeared during this consolidation phase
🔴 The histogram also showed weakening flow, even before price broke down
These overlapping signals pointed to a possible distribution phase, where buying momentum was fading despite price still holding up.
🧭 Signs to Watch for in Potential Distribution:
1️⃣ Price holding flat or rising slightly within a tight range
2️⃣ Volume pressure (line or histogram) sloping downward
3️⃣ Repeated bearish divergences forming at the highs
4️⃣ Lack of follow-through on bullish setups signaling hesitation in demand
While LiquidEdge can’t predict market outcomes, this scenario demonstrates how a combination of divergence, outflow, and failure to break out may serve as early warnings that momentum is shifting beneath the surface.
Failed Auction Example – Volume Shift Before a Breakdown
In this example, price attempted to break out above a recent high, creating the appearance of a bullish continuation. However, LiquidEdge began to signal volume outflow, despite the upward price move a potential sign of a failed auction.
Here’s what was observed:
👉 Price made a new high, appearing to break resistance
👉 LiquidEdge slope and histogram both showed declining liquidity
👉 The indicator formed lower lows, even as price pushed higher
👉 This divergence suggested that volume wasn’t supporting the breakout
Shortly after, price reversed and returned back inside the range which is a common characteristic of failed auction behavior.
🧭 Spotting a Potential Failed Auction with LiquidEdge:
1️⃣ Price breaks above a recent high
2️⃣ Volume flow (line + histogram) shows outflow, not inflow
3️⃣ Indicator forms lower lows while price makes higher highs (bearish divergence)
4️⃣ Market reverts back into the previous range without follow-through
While no tool can predict outcomes, this setup demonstrated how volume pressure and divergence can help identify moments where a breakout may lack real support offering context before price action confirms the shift.
Reading the Histogram - Spotting Pressure Fades
In this example, price was still rising but the LiquidEdge histogram showed falling volume pressure. This type of divergence between price and volume can serve as a potential early signal that momentum may be fading.
🔻 Histogram levels declined while price continued higher
🔻 This suggested that buying pressure was weakening, even though price hadn’t turned
🔻 Volume flow behavior didn’t support the continuation possibly indicating buyer exhaustion
Just before the peak, the histogram nearly reached its lower threshold, despite price still being near its highs.
💡 How to Read It:
When volume pressure (shown by the histogram) starts to fade while price is still rising, it can indicate that momentum is weakening. This may precede a pullback or reversal particularly if other factors like divergence or zone exhaustion are also present.
Conversely, rising histogram values during a price drop may suggest potential accumulation.
👉 Use the histogram as a volume intensity gauge, not a signal on its own especially when evaluating whether a move is supported by actual flow, or just price momentum.
The Table – Fast, Visual Multi-Timeframe Flow Insight
The multi-timeframe flow table in LiquidEdge provides a consolidated view of volume momentum across several key timeframes so you don’t need to switch between charts to compare flow strength.
👉 Instead of flipping from 5-minute to 15M, 1H, 4H, and Daily, the table displays flow direction on all of them at a glance.
Example layout:
🔼 Daily: Up
🔽 1H: Down
🔼 15M: Up
🔽 5M: Down
This setup gives you a quick read on whether volume momentum is aligned across multiple timeframes or diverging which can help frame your trade approach.
🧠 Why It’s Useful:
✅ Supports timeframe alignment
If higher timeframes show strong inflow while lower ones are mixed, you may interpret it as a swing-based opportunity. If short timeframes show pressure but higher frames are flat, it might suggest short-term setups with caution.
✅ Improves context awareness
Instead of interpreting a move in isolation, the table helps you assess whether short-term signals are part of a broader shift or going against higher timeframe flow.
💡 Pro Tip: Use the table as a starting point in your analysis. It’s a simple but effective snapshot of current liquidity pressure across the board helping you plan trades with broader context, rather than reacting chart-by-chart.
🔚 Final Thoughts
If you're focused on trading with better clarity and structure, LiquidEdge is designed to help you interpret what’s happening beneath the surface not just follow price movement.
While many tools highlight price alone, LiquidEdge combines volume pressure, divergence filtering, and trend-based context to help identify potential areas of accumulation, distribution, or momentum shifts even before they become obvious on a chart.
👉 This isn’t just another signal tool. It’s a framework to support smarter decision-making:
✔️ One that helps you filter out noise
✔️ One that scores setups using multiple layers of confirmation
✔️ One that brings volume context into every trade idea
Whether you're scalping on a 5-minute chart or managing a longer-term swing trade, LiquidEdge is built to help you stay aligned with volume-driven behavior not just react to price alone.
If you've struggled with late entries, unreliable setups, or second-guessing trades, this tool was designed to bring more structure to your process. It won’t remove all uncertainty but it can help you stay more selective, confident, and intentional.
✅ Trade with clarity
✅ Stay process-driven
✅ Focus on structure, not noise
LiquidEdge is not meant to replace your strategy. It’s here to enhance it.
In this chart, the 200 EMA filter was applied. As a result, only signals that aligned with the dominant trend direction were displayed helping to reduce distractions and focus on setups with stronger context.
💡 Using a higher EMA setting like 200 can reduce the number of signals shown, but may help you focus on higher-conviction opportunities.
That said, every trader is different:
Longer EMAs = fewer signals, but more trend-filtered setups
Shorter EMAs = more signals, faster entries but with potentially more noise
👉 Adjust the filter based on your trading style. Use a 200 EMA for swing trading, or reduce it to 50, 25, or even 5 if you're trading more aggressively or intraday.
LiquidEdge adapts to you not the other way around.
🔁 Adjusting EMA for Your Trading Style
Personal Tip: When trading more aggressively, I often use a 5 EMA filter especially when combining histogram strength with other tools. This increases signal responsiveness and may help highlight short-term flow shifts more quickly.
Below are visual examples that show how different EMA lengths impact the behavior of LiquidEdge:
50 EMA ON
25 EMA ON
5 EMA ON
Lower EMA Example – Gold with the 5 EMA
In this example, the 5 EMA filter was applied to Gold. As expected, more signals were plotted compared to higher EMA settings. The tool became more responsive to rapid shifts in volume momentum, making it more suitable for fast-paced trading environments.
This setting can help traders who prefer early entries but it also introduces more sensitivity, so context and additional confirmation become even more important.
Each setting affects signal frequency and filtering:
Higher EMA → fewer signals, more trend-confirmed setups
Lower EMA → more signals, quicker responses, but with more potential for noise
Choose what fits your approach:
Long-term swing → Stick with 200 EMA
Intraday or scalping → Consider shorter EMAs (50, 25, or 5)
💡 Reminder: EMA filtering is fully adjustable. LiquidEdge doesn’t lock you into one trading style it’s meant to adapt to your process, whether you’re swing trading or scalping short-term moves.
But There’s a Catch…
Using a lower EMA setting (like 5) opens up faster, more frequent signals but it also increases the need for precision and stronger trade management.
❗ More signals = More responsiveness
❗ Faster setups mean quicker decisions
❗ Risk control becomes even more important
💡 Lower Timeframes = More Detail, Less Margin for Error
A short EMA (like 5) can help you:
✅ Identify early momentum shifts
✅ Respond before traditional trend-followers
✅ Highlight short-term divergence and volume changes
But it also comes with tradeoffs:
❌ Greater signal noise
❌ Higher potential for misreads or fakeouts
❌ Requires clear structure and disciplined entries
🚩 Watch Out for Liquidity Grabs
In lower timeframes, a common trap is the liquidity grab where price pushes beyond recent highs or lows, triggers stops, then quickly reverses.
📌 These moves can look like breakouts, but often reverse quickly possibly reflecting institutional order placement or low-liquidity manipulation.
🧭 How to Approach It Smartly
✅ Use structure: Mark support and resistance to frame moves
✅ Confirm volume behavior: Is histogram strength rising or fading?
✅ Avoid chasing: Look for confluence, not just a single signal
✅ Be intentional with stops: Place them with structure in mind to avoid being swept out
NASDAQ Futures Example – Low Timeframe Setups with LiquidEdge
In this example, we look at how LiquidEdge was used to identify both short and long setups on the NASDAQ Futures (NQ) particularly on a low timeframe (5M), where quick decision-making and volume precision matter most.
⚠️ A Note on Futures and Volume
When trading futures, especially on intraday charts, it’s important to separate overnight volume from regular session activity.
🕒 Overnight Volume ≠ Real Volume Context
Overnight price action is informative, but the volume data itself may not reflect true market participation. In LiquidEdge, histogram and pressure calculations emphasize regular session flow helping avoid skewed signals that could come from low-volume overnight moves.
Using the Histogram to Spot Potential Shifts
One of the key cues I use is color transition in the histogram:
🔴 A flip from strong green to red can signal fading buying pressure, sometimes marking the beginning of a potential short setup.
🟢 A shift from red to green may indicate that buyers are returning, suggesting possible accumulation.
These shifts serve as early visual cues of changing pressure especially when confirmed by other tools or context.
🔁 Adding Context with the Line + Structure
After spotting a histogram shift, I look at:
1️⃣ Slope Line – Is it confirming the same directional pressure?
2️⃣ Support/Resistance – Are we near a meaningful zone?
3️⃣ Additional Tools – This includes trendlines, VWAP, EMAs, and overall price structure.
On lower timeframes like 5M, these pieces become even more important. LiquidEdge gives directional insight, but your full setup provides confirmation and execution logic.
⚠️ Disclaimer
LiquidEdge is not a signal tool. It’s a visual representation of market pressure and flow designed to help you make more informed trading and investing decisions. It shows you what’s happening beneath the price action but you are still responsible for your decisions.
Always combine LiquidEdge with your own strategy, research, and supporting tools. That includes trend analysis, support/resistance levels, chart patterns, and fundamentals (like P/E ratios, price-to-sales, debt ratios, etc.).
This tool should never be used alone or treated as financial advice.
Some content may include AI-powered enhancements for clarity or formatting.
Always do your own research. For personal financial guidance, speak with a licensed financial advisor.
