Double Top/Bottom Screener - Today Only v2 //@version=6
indicator("Double Top/Bottom Screener - Today Only", overlay=true, max_lines_count=500)
// Inputs
leftBars = input.int(5, "Left Bars")
rightBars = input.int(5, "Right Bars")
tolerance = input.float(0.02, "Max Difference (e.g., 0.02 for 2 cents)", step=0.01)
atrLength = input.int(14, "ATR Length for Normalized Distance", minval=1)
requiredPeaks = input.int(3, "Required Identical Peaks", minval=2, maxval=5)
// Declarations of persistent variables and arrays
var array resistanceLevels = array.new(0)
var array resistanceCounts = array.new(0)
var array supportLevels = array.new(0)
var array supportCounts = array.new(0)
var array resLines = array.new(0)
var array supLines = array.new(0)
var bool hasDoubleTop = false
var bool hasDoubleBottom = false
var float doubleTopLevel = na
var float doubleBottomLevel = na
var int todayStart = na
// Step 1: Identify Swing Highs/Lows
swingHigh = ta.pivothigh(high, leftBars, rightBars)
swingLow = ta.pivotlow(low, leftBars, rightBars)
// Today's premarket start (04:00 AM ET)
todayStart := timestamp(syminfo.timezone, year, month, dayofmonth, 4, 0, 0)
// Clear arrays and delete lines on the first bar or new day
if barstate.isfirst or (dayofmonth != dayofmonth and time >= todayStart)
// Delete all existing lines only if arrays are not empty
if array.size(resLines) > 0
for i = array.size(resLines) - 1 to 0
line.delete(array.get(resLines, i))
if array.size(supLines) > 0
for i = array.size(supLines) - 1 to 0
line.delete(array.get(supLines, i))
// Clear arrays
array.clear(resistanceLevels)
array.clear(supportLevels)
array.clear(resistanceCounts)
array.clear(supportCounts)
array.clear(resLines)
array.clear(supLines)
// Reset flags
hasDoubleTop := false
hasDoubleBottom := false
doubleTopLevel := na
doubleBottomLevel := na
// Add new swings only if today and after premarket
if not na(swingHigh) and time >= todayStart and dayofmonth == dayofmonth
bool isEqualHigh = false
int peakIndex = -1
float prevLevel = na
if array.size(resistanceLevels) > 0
for i = 0 to array.size(resistanceLevels) - 1
prevLevel := array.get(resistanceLevels, i)
if math.abs(swingHigh - prevLevel) <= tolerance
isEqualHigh := true
peakIndex := i
break
if isEqualHigh and peakIndex >= 0
array.set(resistanceCounts, peakIndex, array.get(resistanceCounts, peakIndex) + 1)
if array.get(resistanceCounts, peakIndex) == requiredPeaks
hasDoubleTop := true
doubleTopLevel := prevLevel
else
array.push(resistanceLevels, swingHigh)
array.push(resistanceCounts, 1)
line newResLine = line.new(bar_index - rightBars, swingHigh, bar_index, swingHigh, color=color.red, width=2, extend=extend.none)
array.push(resLines, newResLine)
if not na(swingLow) and time >= todayStart and dayofmonth == dayofmonth
bool isEqualLow = false
int peakIndex = -1
float prevLevel = na
if array.size(supportLevels) > 0
for i = 0 to array.size(supportLevels) - 1
prevLevel := array.get(supportLevels, i)
if math.abs(swingLow - prevLevel) <= tolerance
isEqualLow := true
peakIndex := i
break
if isEqualLow and peakIndex >= 0
array.set(supportCounts, peakIndex, array.get(supportCounts, peakIndex) + 1)
if array.get(supportCounts, peakIndex) == requiredPeaks
hasDoubleBottom := true
doubleBottomLevel := prevLevel
else
array.push(supportLevels, swingLow)
array.push(supportCounts, 1)
line newSupLine = line.new(bar_index - rightBars, swingLow, bar_index, swingLow, color=color.green, width=2, extend=extend.none)
array.push(supLines, newSupLine)
// Monitor and remove broken levels/lines; reset pattern if the equal level breaks
if array.size(resistanceLevels) > 0
for i = array.size(resistanceLevels) - 1 to 0
float level = array.get(resistanceLevels, i)
if close > level
line.delete(array.get(resLines, i))
array.remove(resLines, i)
array.remove(resistanceLevels, i)
array.remove(resistanceCounts, i)
if level == doubleTopLevel
hasDoubleTop := false
doubleTopLevel := na
if array.size(supportLevels) > 0
for i = array.size(supportLevels) - 1 to 0
float level = array.get(supportLevels, i)
if close < level
line.delete(array.get(supLines, i))
array.remove(supLines, i)
array.remove(supportLevels, i)
array.remove(supportCounts, i)
if level == doubleBottomLevel
hasDoubleBottom := false
doubleBottomLevel := na
// Limit arrays (after removals)
if array.size(resistanceLevels) > 10
line oldLine = array.shift(resLines)
line.delete(oldLine)
array.shift(resistanceLevels)
array.shift(resistanceCounts)
if array.size(supportLevels) > 10
line oldLine = array.shift(supLines)
line.delete(oldLine)
array.shift(supportLevels)
array.shift(supportCounts)
// Pattern Signal: 1 only if the exact required number of peaks is met
patternSignal = (hasDoubleTop or hasDoubleBottom) ? 1 : 0
// New: Nearest Double Level Price
var float nearestDoubleLevel = na
if hasDoubleTop and not na(doubleTopLevel)
nearestDoubleLevel := doubleTopLevel
if hasDoubleBottom and not na(doubleBottomLevel)
nearestDoubleLevel := na(nearestDoubleLevel) ? doubleBottomLevel : (math.abs(close - doubleBottomLevel) < math.abs(close - nearestDoubleLevel) ? doubleBottomLevel : nearestDoubleLevel)
// New: Distance to Nearest Level (using ATR for normalization)
var float atr = ta.atr(atrLength)
var float distanceNormalizedATR = na
if not na(nearestDoubleLevel) and not na(atr) and atr > 0
distanceNormalizedATR := math.abs(close - nearestDoubleLevel) / atr
// Optional Bounce Signal (for reference)
bounceSignal = 0
if array.size(resistanceLevels) > 0
for i = 0 to array.size(resistanceLevels) - 1
float level = array.get(resistanceLevels, i)
if low <= level and high >= level and close < level
bounceSignal := 1
if array.size(supportLevels) > 0
for i = 0 to array.size(supportLevels) - 1
float level = array.get(supportLevels, i)
if high >= level and low <= level and close > level
bounceSignal := 1
// Outputs
plot(patternSignal, title="Pattern Signal", color=patternSignal == 1 ? color.purple : na, style=plot.style_circles)
plot(bounceSignal, title="Bounce Signal", color=bounceSignal == 1 ? color.yellow : na, style=plot.style_circles)
plot(nearestDoubleLevel, title="Nearest Double Level Price", color=color.orange)
plot(distanceNormalizedATR, title="Normalized Distance (ATR)", color=color.green)
bgcolor(patternSignal == 1 ? color.new(color.purple, 80) : na)
if patternSignal == 1 and barstate.isconfirmed
alert("Double Pattern detected on " + syminfo.ticker + " at " + str.tostring(close), alert.freq_once_per_bar_close)
if barstate.islast
var table infoTable = table.new(position.top_right, 1, 4, bgcolor=color.new(color.black, 50))
table.cell(infoTable, 0, 0, "Pattern: " + str.tostring(patternSignal), bgcolor=patternSignal == 1 ? color.purple : color.gray)
table.cell(infoTable, 0, 1, "Bounce: " + str.tostring(bounceSignal), bgcolor=bounceSignal == 1 ? color.yellow : color.gray)
table.cell(infoTable, 0, 2, "Level: " + str.tostring(nearestDoubleLevel, "#.##"), bgcolor=color.orange)
table.cell(infoTable, 0, 3, "ATR Dist: " + str.tostring(distanceNormalizedATR, "#.##"), bgcolor=color.green)
Pesquisar nos scripts por "swing high low"

Double Top/Bottom Screener - Today Only//@version=6
indicator("Double Top/Bottom Screener - Today Only", overlay=true, max_lines_count=500)
// Inputs
leftBars = input.int(5, "Left Bars")
rightBars = input.int(5, "Right Bars")
tolerance = input.float(0.02, "Max Difference (e.g., 0.02 for 2 cents)", step=0.01)
atrLength = input.int(14, "ATR Length for Normalized Distance", minval=1)
requiredPeaks = input.int(3, "Required Identical Peaks", minval=2, maxval=5)
// Declarations of persistent variables and arrays
var array resistanceLevels = array.new(0)
var array resistanceCounts = array.new(0)
var array supportLevels = array.new(0)
var array supportCounts = array.new(0)
var array resLines = array.new(0)
var array supLines = array.new(0)
var bool hasDoubleTop = false
var bool hasDoubleBottom = false
var float doubleTopLevel = na
var float doubleBottomLevel = na
var int todayStart = na
// Step 1: Identify Swing Highs/Lows
swingHigh = ta.pivothigh(high, leftBars, rightBars)
swingLow = ta.pivotlow(low, leftBars, rightBars)
// Today's premarket start (04:00 AM ET)
todayStart := timestamp(syminfo.timezone, year, month, dayofmonth, 4, 0, 0)
// Clear arrays and delete lines on the first bar or new day
if barstate.isfirst or (dayofmonth != dayofmonth and time >= todayStart)
// Delete all existing lines
for i = array.size(resLines) - 1 to 0
line.delete(array.get(resLines, i))
for i = array.size(supLines) - 1 to 0
line.delete(array.get(supLines, i))
// Clear arrays
array.clear(resistanceLevels)
array.clear(supportLevels)
array.clear(resistanceCounts)
array.clear(supportCounts)
array.clear(resLines)
array.clear(supLines)
// Reset flags
hasDoubleTop := false
hasDoubleBottom := false
doubleTopLevel := na
doubleBottomLevel := na
// Add new swings only if today and after premarket
if not na(swingHigh) and time >= todayStart and dayofmonth == dayofmonth
bool isEqualHigh = false
int peakIndex = -1
float prevLevel = na
if array.size(resistanceLevels) > 0
for i = 0 to array.size(resistanceLevels) - 1
prevLevel := array.get(resistanceLevels, i)
if math.abs(swingHigh - prevLevel) <= tolerance
isEqualHigh := true
peakIndex := i
break
if isEqualHigh and peakIndex >= 0
array.set(resistanceCounts, peakIndex, array.get(resistanceCounts, peakIndex) + 1)
if array.get(resistanceCounts, peakIndex) == requiredPeaks
hasDoubleTop := true
doubleTopLevel := prevLevel
else
array.push(resistanceLevels, swingHigh)
array.push(resistanceCounts, 1)
line newResLine = line.new(bar_index - rightBars, swingHigh, bar_index, swingHigh, color=color.red, width=2, extend=extend.none)
array.push(resLines, newResLine)
if not na(swingLow) and time >= todayStart and dayofmonth == dayofmonth
bool isEqualLow = false
int peakIndex = -1
float prevLevel = na
if array.size(supportLevels) > 0
for i = 0 to array.size(supportLevels) - 1
prevLevel := array.get(supportLevels, i)
if math.abs(swingLow - prevLevel) <= tolerance
isEqualLow := true
peakIndex := i
break
if isEqualLow and peakIndex >= 0
array.set(supportCounts, peakIndex, array.get(supportCounts, peakIndex) + 1)
if array.get(supportCounts, peakIndex) == requiredPeaks
hasDoubleBottom := true
doubleBottomLevel := prevLevel
else
array.push(supportLevels, swingLow)
array.push(supportCounts, 1)
line newSupLine = line.new(bar_index - rightBars, swingLow, bar_index, swingLow, color=color.green, width=2, extend=extend.none)
array.push(supLines, newSupLine)
// Monitor and remove broken levels/lines; reset pattern if the equal level breaks
if array.size(resistanceLevels) > 0
for i = array.size(resistanceLevels) - 1 to 0
float level = array.get(resistanceLevels, i)
if close > level
line.delete(array.get(resLines, i))
array.remove(resLines, i)
array.remove(resistanceLevels, i)
array.remove(resistanceCounts, i)
if level == doubleTopLevel
hasDoubleTop := false
doubleTopLevel := na
if array.size(supportLevels) > 0
for i = array.size(supportLevels) - 1 to 0
float level = array.get(supportLevels, i)
if close < level
line.delete(array.get(supLines, i))
array.remove(supLines, i)
array.remove(supportLevels, i)
array.remove(supportCounts, i)
if level == doubleBottomLevel
hasDoubleBottom := false
doubleBottomLevel := na
// Limit arrays (after removals)
if array.size(resistanceLevels) > 10
line oldLine = array.shift(resLines)
line.delete(oldLine)
array.shift(resistanceLevels)
array.shift(resistanceCounts)
if array.size(supportLevels) > 10
line oldLine = array.shift(supLines)
line.delete(oldLine)
array.shift(supportLevels)
array.shift(supportCounts)
// Pattern Signal: 1 only if the exact required number of peaks is met
patternSignal = (hasDoubleTop or hasDoubleBottom) ? 1 : 0
// New: Nearest Double Level Price
var float nearestDoubleLevel = na
if hasDoubleTop and not na(doubleTopLevel)
nearestDoubleLevel := doubleTopLevel
if hasDoubleBottom and not na(doubleBottomLevel)
nearestDoubleLevel := na(nearestDoubleLevel) ? doubleBottomLevel : (math.abs(close - doubleBottomLevel) < math.abs(close - nearestDoubleLevel) ? doubleBottomLevel : nearestDoubleLevel)
// New: Distance to Nearest Level (using ATR for normalization)
var float atr = ta.atr(atrLength)
var float distanceNormalizedATR = na
if not na(nearestDoubleLevel) and not na(atr) and atr > 0
distanceNormalizedATR := math.abs(close - nearestDoubleLevel) / atr
// Optional Bounce Signal (for reference)
bounceSignal = 0
if array.size(resistanceLevels) > 0
for i = 0 to array.size(resistanceLevels) - 1
float level = array.get(resistanceLevels, i)
if low <= level and high >= level and close < level
bounceSignal := 1
if array.size(supportLevels) > 0
for i = 0 to array.size(supportLevels) - 1
float level = array.get(supportLevels, i)
if high >= level and low <= level and close > level
bounceSignal := 1
// Outputs
plot(patternSignal, title="Pattern Signal", color=patternSignal == 1 ? color.purple : na, style=plot.style_circles)
plot(bounceSignal, title="Bounce Signal", color=bounceSignal == 1 ? color.yellow : na, style=plot.style_circles)
plot(nearestDoubleLevel, title="Nearest Double Level Price", color=color.orange)
plot(distanceNormalizedATR, title="Normalized Distance (ATR)", color=color.green)
bgcolor(patternSignal == 1 ? color.new(color.purple, 80) : na)
if patternSignal == 1 and barstate.isconfirmed
alert("Double Pattern detected on " + syminfo.ticker + " at " + str.tostring(close), alert.freq_once_per_bar_close)
if barstate.islast
var table infoTable = table.new(position.top_right, 1, 4, bgcolor=color.new(color.black, 50))
table.cell(infoTable, 0, 0, "Pattern: " + str.tostring(patternSignal), bgcolor=patternSignal == 1 ? color.purple : color.gray)
table.cell(infoTable, 0, 1, "Bounce: " + str.tostring(bounceSignal), bgcolor=bounceSignal == 1 ? color.yellow : color.gray)
table.cell(infoTable, 0, 2, "Level: " + str.tostring(nearestDoubleLevel, "#.##"), bgcolor=color.orange)
table.cell(infoTable, 0, 3, "ATR Dist: " + str.tostring(distanceNormalizedATR, "#.##"), bgcolor=color.green)

Double Top/Bottom Screener V1//@version=6
indicator("Double Top/Bottom Screener", overlay=true, max_lines_count=500)
// Inputs
leftBars = input.int(5, "Left Bars")
rightBars = input.int(5, "Right Bars")
tolerance = input.float(0.02, "Max Difference (e.g., 0.02 for 2 cents)", step=0.01)
atrLength = input.int(14, "ATR Length for Normalized Distance", minval=1)
requiredPeaks = input.int(3, "Required Identical Peaks", minval=2, maxval=5)
// Declarations of persistent variables and arrays
var array resistanceLevels = array.new(0)
var array resistanceCounts = array.new(0)
var array supportLevels = array.new(0)
var array supportCounts = array.new(0)
var array resLines = array.new(0)
var array supLines = array.new(0)
var bool hasDoubleTop = false
var bool hasDoubleBottom = false
var float doubleTopLevel = na
var float doubleBottomLevel = na
var int todayStart = na
var bool isNewDay = false
// Step 1: Identify Swing Highs/Lows
swingHigh = ta.pivothigh(high, leftBars, rightBars)
swingLow = ta.pivotlow(low, leftBars, rightBars)
// Today's premarket start (04:00 AM ET)
if dayofmonth != dayofmonth
todayStart := timestamp(syminfo.timezone, year, month, dayofmonth, 4, 0, 0)
isNewDay := true
else
isNewDay := false
// Clear arrays and reset flags only once at premarket start
if isNewDay and time >= todayStart
array.clear(resistanceLevels)
array.clear(supportLevels)
array.clear(resistanceCounts)
array.clear(supportCounts)
array.clear(resLines)
array.clear(supLines)
hasDoubleTop := false
hasDoubleBottom := false
doubleTopLevel := na
doubleBottomLevel := na
// Add new swings and check for identical peaks
if not na(swingHigh) and time >= todayStart
bool isEqualHigh = false
int peakIndex = -1
float prevLevel = na
if array.size(resistanceLevels) > 0
for i = 0 to array.size(resistanceLevels) - 1
prevLevel := array.get(resistanceLevels, i)
if math.abs(swingHigh - prevLevel) <= tolerance
isEqualHigh := true
peakIndex := i
break
if isEqualHigh and peakIndex >= 0
array.set(resistanceCounts, peakIndex, array.get(resistanceCounts, peakIndex) + 1)
if array.get(resistanceCounts, peakIndex) == requiredPeaks
hasDoubleTop := true
doubleTopLevel := prevLevel
else
array.push(resistanceLevels, swingHigh)
array.push(resistanceCounts, 1)
line newResLine = line.new(bar_index - rightBars, swingHigh, bar_index, swingHigh, color=color.red, width=2, extend=extend.right)
array.push(resLines, newResLine)
if not na(swingLow) and time >= todayStart
bool isEqualLow = false
int peakIndex = -1
float prevLevel = na
if array.size(supportLevels) > 0
for i = 0 to array.size(supportLevels) - 1
prevLevel := array.get(supportLevels, i)
if math.abs(swingLow - prevLevel) <= tolerance
isEqualLow := true
peakIndex := i
break
if isEqualLow and peakIndex >= 0
array.set(supportCounts, peakIndex, array.get(supportCounts, peakIndex) + 1)
if array.get(supportCounts, peakIndex) == requiredPeaks
hasDoubleBottom := true
doubleBottomLevel := prevLevel
else
array.push(supportLevels, swingLow)
array.push(supportCounts, 1)
line newSupLine = line.new(bar_index - rightBars, swingLow, bar_index, swingLow, color=color.green, width=2, extend=extend.right)
array.push(supLines, newSupLine)
// Monitor and remove broken levels/lines; reset pattern if the equal level breaks
if array.size(resistanceLevels) > 0
for i = array.size(resistanceLevels) - 1 to 0
float level = array.get(resistanceLevels, i)
if close > level
line.delete(array.get(resLines, i))
array.remove(resLines, i)
array.remove(resistanceLevels, i)
array.remove(resistanceCounts, i)
if level == doubleTopLevel
hasDoubleTop := false
doubleTopLevel := na
if array.size(supportLevels) > 0
for i = array.size(supportLevels) - 1 to 0
float level = array.get(supportLevels, i)
if close < level
line.delete(array.get(supLines, i))
array.remove(supLines, i)
array.remove(supportLevels, i)
array.remove(supportCounts, i)
if level == doubleBottomLevel
hasDoubleBottom := false
doubleBottomLevel := na
// Limit arrays (after removals)
if array.size(resistanceLevels) > 10
line oldLine = array.shift(resLines)
line.delete(oldLine)
array.shift(resistanceLevels)
array.shift(resistanceCounts)
if array.size(supportLevels) > 10
line oldLine = array.shift(supLines)
line.delete(oldLine)
array.shift(supportLevels)
array.shift(supportCounts)
// Pattern Signal: 1 only if the exact required number of peaks is met
patternSignal = (hasDoubleTop or hasDoubleBottom) and (array.size(resistanceCounts) > 0 and array.get(resistanceCounts, array.size(resistanceCounts) - 1) == requiredPeaks or array.size(supportCounts) > 0 and array.get(supportCounts, array.size(supportCounts) - 1) == requiredPeaks) ? 1 : 0
// New: Nearest Double Level Price
var float nearestDoubleLevel = na
if hasDoubleTop and not na(doubleTopLevel)
nearestDoubleLevel := doubleTopLevel
if hasDoubleBottom and not na(doubleBottomLevel)
nearestDoubleLevel := na(nearestDoubleLevel) ? doubleBottomLevel : (math.abs(close - doubleBottomLevel) < math.abs(close - nearestDoubleLevel) ? doubleBottomLevel : nearestDoubleLevel)
// New: Distance to Nearest Level (using ATR for normalization)
var float atr = ta.atr(atrLength)
var float distanceNormalizedATR = na
if not na(nearestDoubleLevel) and not na(atr) and atr > 0
distanceNormalizedATR := math.abs(close - nearestDoubleLevel) / atr
// Optional Bounce Signal (for reference)
bounceSignal = 0
if array.size(resistanceLevels) > 0
for i = 0 to array.size(resistanceLevels) - 1
float level = array.get(resistanceLevels, i)
if low <= level and high >= level and close < level
bounceSignal := 1
if array.size(supportLevels) > 0
for i = 0 to array.size(supportLevels) - 1
float level = array.get(supportLevels, i)
if high >= level and low <= level and close > level
bounceSignal := 1
// Outputs
plot(patternSignal, title="Pattern Signal", color=patternSignal == 1 ? color.purple : na, style=plot.style_circles)
plot(bounceSignal, title="Bounce Signal", color=bounceSignal == 1 ? color.yellow : na, style=plot.style_circles)
plot(nearestDoubleLevel, title="Nearest Double Level Price", color=color.orange)
plot(distanceNormalizedATR, title="Normalized Distance (ATR)", color=color.green)
bgcolor(patternSignal == 1 ? color.new(color.purple, 80) : na)
if patternSignal == 1 and barstate.isconfirmed
alert("Double Pattern detected on " + syminfo.ticker + " at " + str.tostring(close), alert.freq_once_per_bar_close)
if barstate.islast
var table infoTable = table.new(position.top_right, 1, 4, bgcolor=color.new(color.black, 50))
table.cell(infoTable, 0, 0, "Pattern: " + str.tostring(patternSignal), bgcolor=patternSignal == 1 ? color.purple : color.gray)
table.cell(infoTable, 0, 1, "Bounce: " + str.tostring(bounceSignal), bgcolor=bounceSignal == 1 ? color.yellow : color.gray)
table.cell(infoTable, 0, 2, "Level: " + str.tostring(nearestDoubleLevel, "#.##"), bgcolor=color.orange)
table.cell(infoTable, 0, 3, "ATR Dist: " + str.tostring(distanceNormalizedATR, "#.##"), bgcolor=color.green)

Double Top/Bottom Screener 3-5 peaks //@version=6
indicator("Double Top/Bottom Screener", overlay=true, max_lines_count=500)
// Inputs
leftBars = input.int(5, "Left Bars")
rightBars = input.int(5, "Right Bars")
tolerance = input.float(0.02, "Max Difference (e.g., 0.02 for 2 cents)", step=0.01)
atrLength = input.int(14, "ATR Length for Normalized Distance", minval=1)
maxPeaks = input.int(5, "Max Identical Peaks", minval=2, maxval=5)
// Declarations of persistent variables and arrays
var array resistanceLevels = array.new(0)
var array resistanceCounts = array.new(0)
var array supportLevels = array.new(0)
var array supportCounts = array.new(0)
var array resLines = array.new(0)
var array supLines = array.new(0)
var bool hasDoubleTop = false
var bool hasDoubleBottom = false
var float doubleTopLevel = na
var float doubleBottomLevel = na
var int todayStart = na
var bool isNewDay = false
// Step 1: Identify Swing Highs/Lows
swingHigh = ta.pivothigh(high, leftBars, rightBars)
swingLow = ta.pivotlow(low, leftBars, rightBars)
// Today's premarket start (04:00 AM ET)
if dayofmonth != dayofmonth
todayStart := timestamp(syminfo.timezone, year, month, dayofmonth, 4, 0, 0)
isNewDay := true
else
isNewDay := false
// Clear arrays and reset flags only once at premarket start
if isNewDay and time >= todayStart
array.clear(resistanceLevels)
array.clear(supportLevels)
array.clear(resistanceCounts)
array.clear(supportCounts)
array.clear(resLines)
array.clear(supLines)
hasDoubleTop := false
hasDoubleBottom := false
doubleTopLevel := na
doubleBottomLevel := na
// Add new swings and check for identical peaks
if not na(swingHigh) and time >= todayStart
bool isEqualHigh = false
int peakIndex = -1
float prevLevel = na // Declare prevLevel with initial value
if array.size(resistanceLevels) > 0
for i = 0 to array.size(resistanceLevels) - 1
prevLevel := array.get(resistanceLevels, i)
if math.abs(swingHigh - prevLevel) <= tolerance
isEqualHigh := true
peakIndex := i
break
if isEqualHigh and peakIndex >= 0
array.set(resistanceCounts, peakIndex, array.get(resistanceCounts, peakIndex) + 1)
if array.get(resistanceCounts, peakIndex) >= maxPeaks
hasDoubleTop := true
doubleTopLevel := prevLevel
else
array.push(resistanceLevels, swingHigh)
array.push(resistanceCounts, 1)
line newResLine = line.new(bar_index - rightBars, swingHigh, bar_index, swingHigh, color=color.red, width=2, extend=extend.right)
array.push(resLines, newResLine)
if not na(swingLow) and time >= todayStart
bool isEqualLow = false
int peakIndex = -1
float prevLevel = na // Declare prevLevel with initial value
if array.size(supportLevels) > 0
for i = 0 to array.size(supportLevels) - 1
prevLevel := array.get(supportLevels, i)
if math.abs(swingLow - prevLevel) <= tolerance
isEqualLow := true
peakIndex := i
break
if isEqualLow and peakIndex >= 0
array.set(supportCounts, peakIndex, array.get(supportCounts, peakIndex) + 1)
if array.get(supportCounts, peakIndex) >= maxPeaks
hasDoubleBottom := true
doubleBottomLevel := prevLevel
else
array.push(supportLevels, swingLow)
array.push(supportCounts, 1)
line newSupLine = line.new(bar_index - rightBars, swingLow, bar_index, swingLow, color=color.green, width=2, extend=extend.right)
array.push(supLines, newSupLine)
// Monitor and remove broken levels/lines; reset pattern if the equal level breaks
if array.size(resistanceLevels) > 0
for i = array.size(resistanceLevels) - 1 to 0
float level = array.get(resistanceLevels, i)
if close > level
line.delete(array.get(resLines, i))
array.remove(resLines, i)
array.remove(resistanceLevels, i)
array.remove(resistanceCounts, i)
if level == doubleTopLevel
hasDoubleTop := false
doubleTopLevel := na
if array.size(supportLevels) > 0
for i = array.size(supportLevels) - 1 to 0
float level = array.get(supportLevels, i)
if close < level
line.delete(array.get(supLines, i))
array.remove(supLines, i)
array.remove(supportLevels, i)
array.remove(supportCounts, i)
if level == doubleBottomLevel
hasDoubleBottom := false
doubleBottomLevel := na
// Limit arrays (after removals)
if array.size(resistanceLevels) > 10
line oldLine = array.shift(resLines)
line.delete(oldLine)
array.shift(resistanceLevels)
array.shift(resistanceCounts)
if array.size(supportLevels) > 10
line oldLine = array.shift(supLines)
line.delete(oldLine)
array.shift(supportLevels)
array.shift(supportCounts)
// Pattern Signal: 1 if any pattern with maxPeaks is active and unbroken
patternSignal = (hasDoubleTop or hasDoubleBottom) ? 1 : 0
// New: Nearest Double Level Price
var float nearestDoubleLevel = na
if hasDoubleTop and not na(doubleTopLevel)
nearestDoubleLevel := doubleTopLevel
if hasDoubleBottom and not na(doubleBottomLevel)
nearestDoubleLevel := na(nearestDoubleLevel) ? doubleBottomLevel : (math.abs(close - doubleBottomLevel) < math.abs(close - nearestDoubleLevel) ? doubleBottomLevel : nearestDoubleLevel)
// New: Distance to Nearest Level (using ATR for normalization)
var float atr = ta.atr(atrLength)
var float distanceNormalizedATR = na
if not na(nearestDoubleLevel) and not na(atr) and atr > 0
distanceNormalizedATR := math.abs(close - nearestDoubleLevel) / atr
// Optional Bounce Signal (for reference)
bounceSignal = 0
if array.size(resistanceLevels) > 0
for i = 0 to array.size(resistanceLevels) - 1
float level = array.get(resistanceLevels, i)
if low <= level and high >= level and close < level
bounceSignal := 1
if array.size(supportLevels) > 0
for i = 0 to array.size(supportLevels) - 1
float level = array.get(supportLevels, i)
if high >= level and low <= level and close > level
bounceSignal := 1
// Outputs
plot(patternSignal, title="Pattern Signal", color=patternSignal == 1 ? color.purple : na, style=plot.style_circles)
plot(bounceSignal, title="Bounce Signal", color=bounceSignal == 1 ? color.yellow : na, style=plot.style_circles)
plot(nearestDoubleLevel, title="Nearest Double Level Price", color=color.orange)
plot(distanceNormalizedATR, title="Normalized Distance (ATR)", color=color.green)
bgcolor(patternSignal == 1 ? color.new(color.purple, 80) : na)
if patternSignal == 1 and barstate.isconfirmed
alert("Double Pattern detected on " + syminfo.ticker + " at " + str.tostring(close), alert.freq_once_per_bar_close)
if barstate.islast
var table infoTable = table.new(position.top_right, 1, 4, bgcolor=color.new(color.black, 50))
table.cell(infoTable, 0, 0, "Pattern: " + str.tostring(patternSignal), bgcolor=patternSignal == 1 ? color.purple : color.gray)
table.cell(infoTable, 0, 1, "Bounce: " + str.tostring(bounceSignal), bgcolor=bounceSignal == 1 ? color.yellow : color.gray)
table.cell(infoTable, 0, 2, "Level: " + str.tostring(nearestDoubleLevel, "#.##"), bgcolor=color.orange)
table.cell(infoTable, 0, 3, "ATR Dist: " + str.tostring(distanceNormalizedATR, "#.##"), bgcolor=color.green)

RSI Custom ADX VWAP Swing SignalsRSI Custom ADX VWAP Swing Signals
This Pine Script indicator is designed for the NASDAQ 1-minute timeframe (or any timeframe you use) and combines several technical analysis tools:
RSI (Relative Strength Index): Measures momentum, indicating overbought and oversold conditions.
Custom ADX (Average Directional Index): Quantifies the strength of a trend, regardless of direction.
VWAP (Volume-Weighted Average Price): Represents the average price weighted by volume, indicating central price tendency.
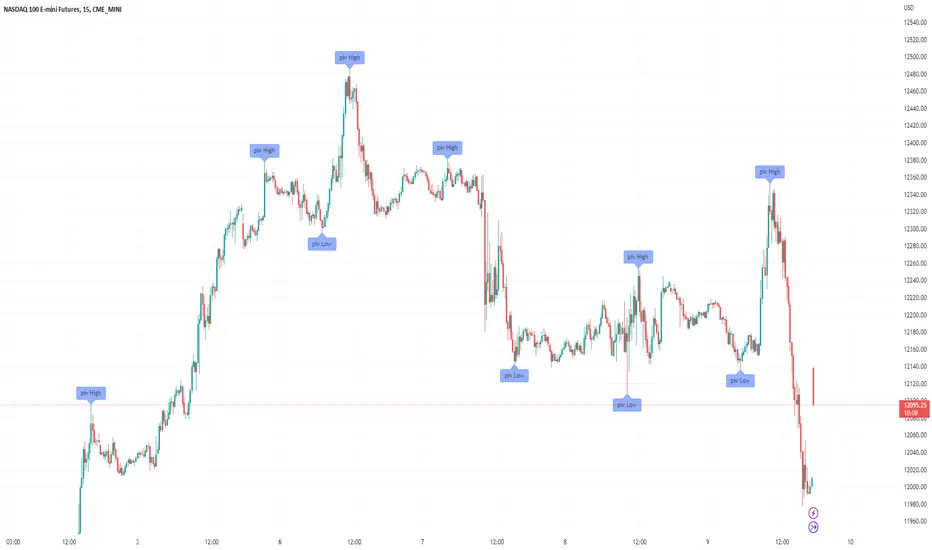
Swing High/Low Detection: Identifies recent high and low points to detect breakout signals.
How it works:
RSI Calculation:
Uses a length of 14 (or your input) to assess whether market momentum is overbought (>60) or oversold (<30).
Custom ADX Calculation:
Computes plusDM and minusDM based on recent high/low price changes.
Smooths these using Wilder’s method (ta.rma) to obtain directional movement.
Derives the ADX value (sig), representing the trend strength.
VWAP Calculation:
Uses the typical price (hlc3) to compute the VWAP, a key level indicating average trading price weighted by

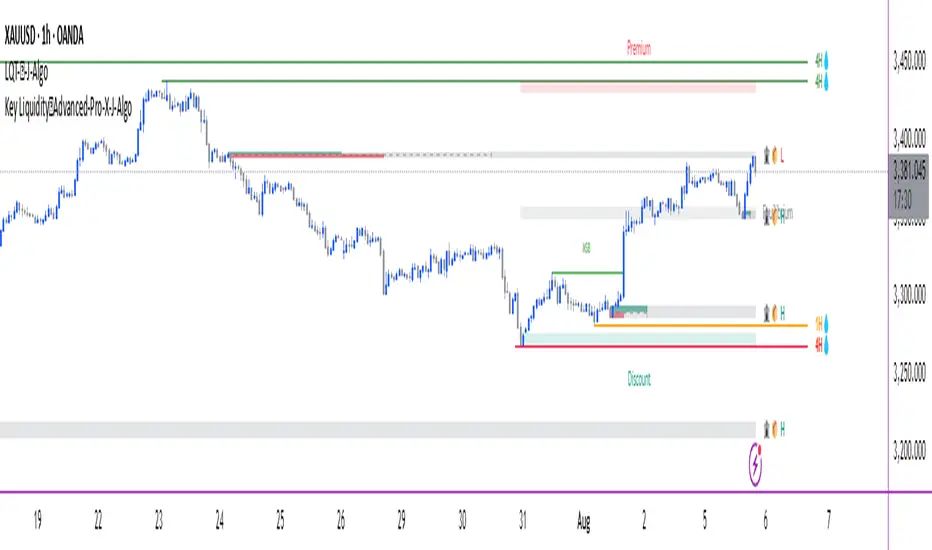
Key Liquidity💧Advanced-Pro-J-Algo# 💧 Key Liquidity Advanced Pro - Multi-Timeframe Institutional Analysis
## 🏆 **Premium Institutional Trading Indicator**
Transform your trading with this comprehensive **multi-timeframe liquidity analysis tool** that combines **Smart Money Concepts (SMC)** and **ICT methodology** into one powerful indicator. Designed for serious traders who demand institutional-grade analysis.
---
## 🔥 **Key Features**
### 💧 **Multi-Timeframe Key Liquidity Levels**
- **HTF (Higher Timeframe)**: Major institutional levels with real-time alerts 🚨
- **LTF (Lower Timeframe)**: Precision entry/exit levels for optimal timing
- **CTF (Current Timeframe)**: Flexible analysis for any chart timeframe
- **Smart Mitigation Detection**: Automatically removes hit liquidity levels
- **Professional Labels**: Clean timeframe identification (4H, 1H, etc.)
### 🏦 **Institutional Order Blocks**
- **📦 Smart Money Order Blocks**: Identify where institutions placed large orders
- **Volume-Weighted Analysis**: Bullish/Bearish strength calculations
- **Professional Labels**: 🏦📦 H (High) and 🏦📦 L (Low) markers
- **Violation Detection**: Automatic cleanup when order blocks are broken
- **Overlap Prevention**: Clean chart presentation without clutter
### 🚨 **Advanced Alert System**
- **HTF Liquidity Hit Alerts**: Never miss major institutional level breaks
- **Detailed Notifications**: Timeframe, price, and timestamp information
- **Smart Frequency Control**: No spam - only meaningful alerts
- **Mobile Ready**: Perfect for Trading View mobile app notifications
### 📊 **Market Structure Analysis**
- **MSB (Market Structure Breaks)**: Current trend direction changes
- **Premium/Discount Zones**: ICT-style institutional price zones
- **Clean Presentation**: Only shows current MSB, removes historical clutter
### 🔄 **Trading Session Analysis**
- **Multi-Session Support**: Asian, London, New York sessions
- **Session Overlaps**: Highlighted with special bar coloring
- **Configurable Display**: Show 0-10 previous days of session data
- **High/Low Tracking**: Session-specific price levels
---
## 🎯 **Perfect For**
### **Trading Styles:**
- ✅ **Forex Trading** (ICT/SMC methodology)
- ✅ **Index Trading** (institutional analysis)
- ✅ **Crypto Trading** (smart money concepts)
- ✅ **Swing Trading** (HTF liquidity levels)
- ✅ **Scalping** (multi-timeframe precision)
### **Methodologies:**
- ✅ **Smart Money Concepts (SMC)**
- ✅ **Inner Circle Trader (ICT)**
- ✅ **Institutional Order Flow**
- ✅ **Liquidity Hunting Strategies**
- ✅ **Market Structure Trading**
---
## ⚙️ **Comprehensive Settings**
### **Master Controls:**
- 💧 Enable/Disable Key Liquidity Levels
- 🏦 Enable/Disable Order Blocks
- 📊 Enable/Disable Market Structure Breaks
- 🎯 Enable/Disable Premium/Discount Zones
- 🔄 Enable/Disable Trading Sessions
### **Customization Options:**
- **Timeframe Selection**: Choose your HTF and LTF periods
- **Color Schemes**: Professional color coding for each timeframe
- **Display Limits**: Control chart clutter with smart limits
- **Text Sizing**: Scalable labels for any screen size
- **Extension Options**: Short, Current, or Max line extensions
### **Alert Configuration:**
- 🚨 HTF High Liquidity Hit Alerts
- 🚨 HTF Low Liquidity Hit Alerts
- Smart frequency control to prevent spam
---
## 🎨 **Visual Excellence**
### **Professional Design:**
- **Clean Interface**: No chart clutter, only relevant information
- **Consistent Labeling**: All elements perfectly aligned and positioned
- **Smart Color Coding**: Visual hierarchy based on timeframe importance
- **Emoji Integration**: Instant visual recognition (💧🏦📦📊)
### **Label System:**
- **Liquidity Levels**: Timeframe labels (4H, 1H, etc.) with tooltips
- **Order Blocks**: 🏦📦 H/L institutional liquidity markers
- **Market Structure**: MSB break notifications
- **Sessions**: Clear session identification and overlaps
---
## 🔬 **Technical Implementation**
### **Performance Optimized:**
- Efficient memory management with `max_bars_back()` settings
- Smart array handling to prevent performance issues
- Clean object deletion to maintain chart responsiveness
### **Advanced Logic:**
- **Pivot Detection**: Sophisticated swing high/low identification
- **Mitigation Algorithms**: Smart detection of liquidity level hits
- **Volume Analysis**: Institutional strength calculations
- **Multi-Timeframe Security**: Proper HTL/LTF data handling
---
## 📈 **How to Use**
### **Setup:**
1. Add indicator to your chart
2. Configure your preferred HTF (default: 4H) and LTF (default: 1H)
3. Enable desired features via Master Controls
4. Set up TradingView alerts for HTF liquidity hits
### **Trading Workflow:**
1. **Identify Bias**: Use HTF liquidity levels for market direction
2. **Find Entries**: Use LTF levels and Order Blocks for precision entries
3. **Confirm Structure**: Check MSB for trend continuation/reversal
4. **Time Entries**: Use session analysis for optimal timing
5. **Get Alerted**: Never miss major HTF liquidity hits
---
## 🏅 **Why Choose This Indicator?**
### **Professional Grade:**
- Combines multiple premium concepts into one comprehensive tool
- Institutional-quality analysis typically found in expensive platforms
- Clean, professional presentation suitable for serious trading
### **Complete Solution:**
- No need for multiple indicators - everything in one package
- Covers all aspects of modern institutional trading methodology
- Suitable for beginners learning SMC/ICT and professionals alike
### **Constantly Updated:**
- Built with modern Pine Script v6
- Performance optimized for all timeframes
- Clean code structure for reliability
---
## 🚨 **Important Notes**
- **Timeframe Compatibility**: Works on all intraday timeframes (not suitable for daily/weekly/monthly)
- **Best Performance**: Recommended for 1m-4H chart timeframes
- **Alert Setup**: Configure TradingView alerts for mobile notifications
- **Education**: Best used with understanding of SMC/ICT concepts
---
## 📞 **Support & Updates**
This indicator represents months of development and testing, combining the best of institutional trading analysis into one comprehensive tool. Perfect for traders who demand professional-grade analysis and real-time alerting.
**🎯 Take your trading to the institutional level with Key Liquidity Advanced Pro!**
---
*Disclaimer: This indicator is for educational and informational purposes. Past performance does not guarantee future results. Always practice proper risk management.*
BOS mark-out (by Lumiere)Advanced BOS Detection with Strict Swing Confirmation
This indicator implements BOS detection with several unique features:
🔹 Dual-Candle Swing Validation - Unlike most BOS indicators that use single candle swings, this uses a two-candle confirmation for swing highs/lows, analyzing both the candle wicks and body transitions.
🔹 Directional Lock System - Implements a state machine that prevents duplicate signals until an opposite-direction BOS occurs, reducing noise.
🔹 Precision Wick Analysis - Compares wicks between the reversal candle and confirmation candle to identify the true swing point.
🔹 Real-Time Update & Live Market Adaptation – The indicator continuously monitors price action and instantly updates BOS signals as new candles form, ensuring you never miss a BOS.
How It Differs From Other BOS Indicators:
Most public BOS indicators use simple HH/HL or LH/LL detection.
Many don't implement the directional locking mechanism.
Few use the two-candle wick comparison approach.
Wick-Based Precision uses the extreme wicks of two candles (not just the body).
Strict Confirmation requires a close beyond the swing point (no "wick breaks" counted).
Usage Examples:
🟦 Bullish BOS:
A green candle closes, followed by a red candle. This will be the new high, and if the next candle closes above the highest wick of those two, it will be a BOS (only if we had a bearish BOS before)
🟥 Bearish BOS:
A red candle closes, followed by a green candle. This will be the new low, and if the next candle closes below the lowest wick of those two, it will be a BOS (only if we had a Bullish BOS before)

Pullback Candle (Bullish & Bearish, No EMA)🔍 Purpose
This indicator detects simple pullback reversal patterns based on price action and swing highs/lows — without any moving average or trend filters.
It highlights:
Bullish pullbacks (potential bounce/long setups)
Bearish pullbacks (potential rejection/short setups)
📈 Bullish Pullback Criteria
Three-bar pattern:
Bar 3: Highest close
Bar 2: Lower close
Bar 1: Even lower close
Current bar closes above previous bar (bullish reversal)
One of the last two candles is the lowest low of the past 6 bars (swing low)
📍 Result: A small green cross is plotted below the bar, and the bar is colored green.
📉 Bearish Pullback Criteria
Three-bar pattern:
Bar 3: Lowest close
Bar 2: Higher close
Bar 1: Even higher close
Current bar closes below previous bar (bearish reversal)
One of the last two candles is the highest high of the past 10 bars (swing high)
📍 Result: A small red cross is plotted above the bar, and the bar is colored red.
🔔 Alerts
One alert condition each for bullish and bearish pullback detection.
Can be used to trigger TradingView alerts.
🛠️ Customization
No inputs — fully automated logic
Clean, minimal, and fast
Can be extended with labels, alert sounds, or signals

Candlestick High/Low Labels📌 Indicator Name:
Candlestick High/Low Labels
🧠 Author:
Precious Life Dynamics (@Precious_Life)
📋 Description:
The Candlestick High/Low Labels indicator highlights recent price extremes by placing labels above highs and below lows of previous candles.
Additionally, it displays a live OHLCV dashboard in the bottom-right corner, offering a quick overview of recent market data.
This tool is especially useful for:
Identifying support/resistance levels
Tracking candle behavior
Visualizing volume trends in context
⚙️ How It Works:
🔸 High/Low Labels:
Each of the most recent candles (based on Candle Lookback) is annotated as follows:
🔹 Red label above each candle’s high
🔹 Green label below each candle’s low
🔹 Price values are rounded (no decimals)
🔹 Labels are dynamically updated; old ones are removed
🔹 Label visibility can be toggled via the Show Labels input
🔸 OHLCV Dashboard:
A real-time data table appears in the bottom-right corner of the chart.
It displays the last N candles (based on Dashboard Lookback) with the following fields:
🔹 Candle Number (1 = most recent)
🔹 Open, High, Low, Close
🔹 Volume
🔹 Values are rounded for readability
🔹 White background with black text ensures high visual clarity
🔧 Customizable Inputs:
✅ Candle Lookback → Number of candles to label (default: 10)
✅ Show Labels → Toggle High/Low label display on/off
✅ Dashboard Lookback → Number of candles shown in the OHLCV table (default: 10)
🎯 Use Cases:
🔹 Identify recent price extremes and reaction zones
🔹 Spot dynamic support and resistance levels
🔹 Observe how candles behave at swing highs/lows
🔹 Monitor volume activity in relation to price
🔹 Use as a clean visual tool for scalping and intraday trading
📝 Notes:
🔹 This indicator is purely visual – it does not generate trade signals
🔹 Best suited for traders who value clear, real-time price structure feedback

Praetor Sentinel V11.2 NOLOOSE BETA📈 Praetor Sentinel V11.2 – "NOLOOSE BETA"
Algorithmic Trading Strategy for Trend Markets with Adaptive Risk Management
Praetor Sentinel V11.2 is an advanced algorithmic trading strategy for TradingView, specifically designed to operate in strong trend conditions. It combines multiple technical systems—including dynamic trend filters, multi-layer EMA structures, ADX-based volatility control, and adaptive trailing stops—into a powerful and automated trading framework.
🔧 Core Features
Multi-EMA Trend Detection: Two EMA pairs (short/long) to identify and confirm directional trends.
XO-EMA Breakout Logic: Fast EMA crossover to detect breakout opportunities.
ADX Trend Filter: Trades only during strong market trends (above custom ADX threshold).
HTF Filter: Optional higher timeframe trend confirmation (e.g. Daily 50 EMA).
VWAP Validation: Ensures entries aren't taken against the volumetric average.
RSI Filter: Adds a momentum filter (e.g. RSI > 50 for long trades).
🎯 Entry Signals
The strategy uses two entry types:
Breakout Entries: Based on XO-EMA cross and multi-EMA trend alignment.
Pullback Entries: Configurable via various methods such as EMA21 reentry, RSI reversal, engulfing candles, or VWAP reclaim.
All entries can be delayed via confirmation candle logic, requiring a bullish or bearish follow-up bar.
🛡️ Risk Management & Exit Logic
Dynamic ATR Trailing Stop: Adjusts stop distance according to market volatility with optional swing high/low protection.
Break-Even Logic: Locks in trades at breakeven once a defined profit is reached.
Hard Stop-Loss: Caps potential loss per trade with a fixed % (e.g. 1%).
Safe Mode ("NOLOOSE"): Exits early if price moves too far against the position — ideal for automated bots that must avoid drawdowns.
🤖 Automation & Alerts
This strategy is fully automatable with services like 3Commas using built-in alert messages for entries and exits.
All parameters are fully configurable to adapt to different assets, timeframes, and trading styles.
⚙️ Additional Features
Configurable leverage & position sizing
Time-based trading window
Built-in Anchored VWAP
Modular design for easy extension
📌 Summary
Praetor Sentinel V11.2 is a professional-grade tool for trend traders who want rule-based entry/exit logic, adaptive stop systems, and robust protection features. When paired with automation tools, it offers a reliable, low-maintenance setup that emphasizes safety, structure, and scalability.
🛠 How to Use Praetor Sentinel V11.2 – NOLOOSE BETA
🔍 1. Basic Configuration (Required)
Setting Description
Enable Long Trades Enables long (buy) positions.
Enable Short Trades Enables short (sell) positions.
Leverage Used for position sizing calculations.
Position Size % Defines % of capital to be used per trade.
⏰ 2. Time Filter (Optional)
Restricts trading to a defined time range.
Setting Description
Start Date Start date for strategy to be active.
End Date End date for strategy to stop.
Time Zone Time zone for above settings.
📊 3. Trend Setup (Essential for Entry Signals)
Setting Description
MA Type Type of moving average: EMA or SMA.
EMA1/2 Short & Long Two EMA-based systems to determine trend.
Fast/Slow EMA (XO) Used for crossover breakout detection.
HTF Filter Uses higher timeframe trend for additional confirmation.
RSI Filter Confirms entries only if momentum (RSI) supports it.
ADX Threshold Ensures trades only occur during strong trends.
🎯 4. Entry Logic
Setting Description
Pullback Entry Type Enables optional entry setups:
"Off"
"EMA21"
"RSI"
"Engulfing"
"VWAP"
| Use Confirmation Candle | Entry is delayed until a confirmation bar appears. |
| VWAP Confirmation | Trade only if price is above/below the VWAP (based on direction). |
Note: You can combine breakout + pullback signals. Only one has to trigger.
🧯 5. Risk Control & Exit Settings
Setting Description
Trailing Stop Mode
"Standard": Classic trailing stop
"Dynamic ATR": Adjusts to current volatility
"Dynamic ATR + Swing": Adds swing high/low buffer
| Enable Break-Even | Moves SL to breakeven once a target % gain is reached. |
| Enable Hard Stop-Loss | Fixed stop-loss (e.g. 1%) to cap trade risk. |
| Enable Safe Mode | Exits trade early if price moves against it beyond defined % (e.g. 0.3%). |
🔔 6. Alerts & Bot Automation
Setting Description
Entry Long/Short Msg Text message sent via alert when a position opens.
Exit Long/Short Msg Alert message for stop-loss/exit logic.
How to automate with 3Commas:
Load the strategy on your chart.
Manually create alerts using "Create Alert" in TradingView.
Use the built-in alert_message values for bot integration.
✅ Recommended Settings (Example for BTC/ETH on 1H)
Long & Short: ✅ Enabled
Leverage: 2.0
Timeframe: 1H
Pullback Entry: "EMA21"
MA Type: EMA
HTF Filter: Enabled (Daily EMA50)
RSI Filter: Enabled
VWAP Filter: Enabled
Break-Even: On at 0.5%
Hard SL: 1.0%
Safe Mode: On at -0.3%
Trailing Stop: "Dynamic ATR + Swing"
📘 Pro Tips for Testing & Customization
Use the Strategy Tester in TradingView to analyze performance over different assets.
Experiment with timeframes and entry modes.
Ideal for trending assets like BTC, ETH, SOL, etc.
You can expand it with take-profit logic, fixed TPs, indicator exits, etc.

Mingo Smart Entry Master 1H-15M - HTF BOS Zones + TP/SL📛 Script Title:
Smart Entry Master 1H–15M – HTF BOS Zones + TP/SL + Dashboard
🧠 What This Script Does:
This script is a higher-timeframe smart entry strategy designed to:
Detect Break of Structure (BOS) on the 1-hour timeframe
Draw Buy/Sell zones automatically on the chart
Provide clear SL & TP lines for trades
Use optional Smart Sell Detection to improve signal quality
Show a dashboard with live signal status
Keep the chart clean by removing old zones and labels
Ideal for intraday swing traders and confirmation-based scalpers looking to trade based on HTF structure + clean zone visualization.
📊 How the Strategy Works:
1. 🧱 Break of Structure (BOS) Detection (1H)
Script uses 1-hour swing highs/lows (swingLen) to define structure
If the 1H candle closes above a swing high → Buy Setup
If the 1H candle closes below a swing low → Sell Setup
🧠 Optional: Smart Sell Detection
Adds a buffer: compares close to lowest low in a lookback window (to reduce fake sells)
🔥 How to Use This Script in Real Trading:
Use on 15M chart to trade, but zones are based on 1H structure
When a Buy or Sell zone appears, check:
Is price tapping into the zone?
Did a clean BOS occur?
SL/TP lines give a ready-made trade plan
Wait for confirmation (price reaction, candle pattern, volume spike)
Set your alert for auto-trading or manual entry

TrendSync Pro (SMC)📊 TrendSync Pro (SMC) – Advanced Trend-Following Strategy with HTF Alignment
Created by Shubham Singh
🔍 Strategy Overview
TrendSync Pro (SMC) is a precision-based smart trend-following strategy inspired by Smart Money Concepts (SMC). It combines: Real-time pivot-based trendline detection
Higher Time Frame (HTF) filtering to align trades with dominant trend
Risk management via adjustable Stop Loss (SL) and Take Profit (TP)
Directional control — trade only bullish, bearish, or both setups
Realistic backtesting using commissions and slippage
Pre-optimized profiles for scalpers, intraday, swing, and long-term traders
🧠 How It Works:
🔧 Strategy Settings Image:
beeimg.com
The strategy dynamically identifies trend direction by using swing high/low pivots. When a new pivot forms: It draws a trendline from the last significant pivot
Detects whether the trend is up (based on pivot lows) or down (based on pivot highs)
Waits for price to break above/below the trendline
Confirms with HTF price direction (HTF close > previous HTF close = bullish)
Only then it triggers a long or short trade
It exits either at TP, SL, or a manual trendline break
🛠️ Adjustable Parameters:
Trend Period: Length for pivot detection (affects sensitivity of trendlines)
HTF Timeframe: Aligns lower timeframe entries with higher timeframe direction
SL% and TP%: Customize your risk-reward profile
Commission & Slippage: Make backtests more realistic
Trade Direction: Choose to trade: Long only, Short only, or Both
🎛️ Trade Direction Control:
In settings, you can choose: Bullish Only: Executes only long entries
Bearish Only: Executes only short entries
Both: Executes both long and short entries when conditions are met
This allows you to align trades with your own market bias or external analysis.
📈 Entry Logic: Long Entry:
• Price crosses above trendline
• HTF is bullish (HTF close > previous close)
• Latest pivot is a low (trend is considered up)
Short Entry:
• Price crosses below trendline
• HTF is bearish (HTF close < previous close)
• Latest pivot is a high (trend is considered down)
📉 Exit Logic: Hit Take Profit or Stop Loss
Manual trendline invalidation: If price crosses opposite of the trend direction
⏰ Best Timeframes & Recommended Settings:
Scalping (1m to 5m):
HTF = 15m | Trend Period = 7
SL = 0.5% | TP = 1% to 2%
Intraday (15m to 30m):
HTF = 1H | Trend Period = 10–14
SL = 0.75% | TP = 2% to 3%
6 Hour Trading (30m to 1H):
HTF = 4H | Trend Period = 20
SL = 1% | TP = 4% to 6%
Swing Trading (4H to 1D):
HTF = 1D | Trend Period = 35
SL = 2% | TP = 8% to 12%
Long-Term Investing (1D+):
HTF = 1W | Trend Period = 50
SL = 3% | TP = 15%+
Note: These are recommended base settings. Adjust based on volatility, asset class, or personal trading style.
📸 Testing Note:
beeimg.com
TradingView limits test length to 20k bars (~40 trades on smaller timeframes). To show long-term results: Test on higher timeframes (e.g., 1H, 4H, 1D)
Share images of backtest result in description
Host longer test result screenshots on Imgur or any public drive
📍 Asset Behavior Insight:
This strategy works on multiple assets, including BTC, ETH, etc.
Performance varies by trend strength:
Sometimes BTC performs better than ETH
Other times ETH gives better results
That’s normal as both assets follow different volatility and trend behavior
It’s a trend-following setup. Longer and clearer the trend → better the results.
✅ Best Practices: Avoid ranging markets
Use proper SL/TP for each timeframe
Use directional filter if you already have a directional bias
Always forward test before going live
⚠️ Trading Disclaimer:
This script is for educational and backtesting purposes only. Trading involves risk. Always use risk management and never invest more than you can afford to lose.

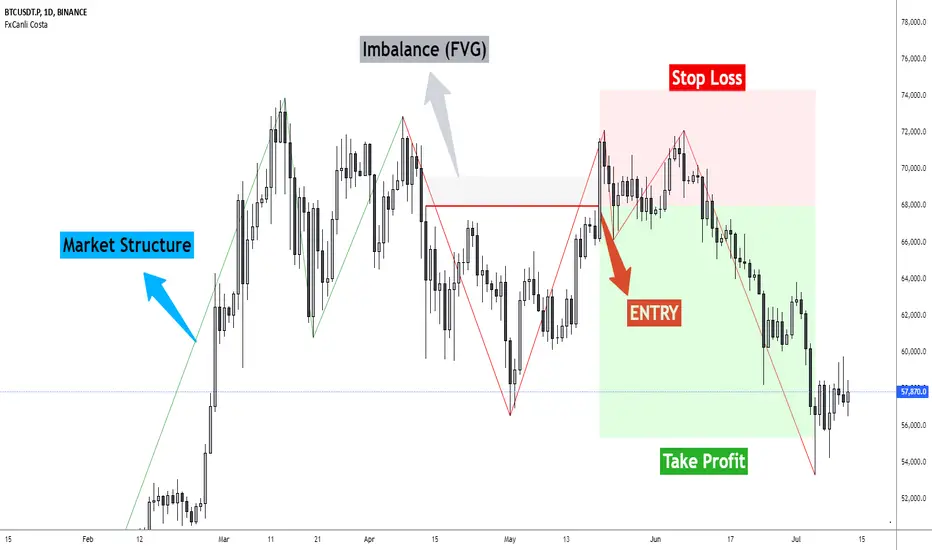
FxCanli CostaFxCanli Costa indicator draws all of the following with FxCanli Costa strategy
▪️ Market Structure
▪️ Up Trend with Green Lines
▪️ Down Trend with Red Lines
▪️ Imbalance(FVG)
▪️ Limit order Level
▪️ Entry Level
▪️ Stop Loss Level
▪️ Take Profit Level
******* Lets first understand about the FxCanli COSTA Strategy *******
Think that, we wait price to reverse from any level -
I call it PRZ (Potential Reversal Zone)
it can reverse in 2 type
Type 1 - it will reverse with 2 wave
Type 2 - it will reverse with 1 wave
⚫ What is PRZ (Potential Reversal Zone)?
Depends on your technical analysis, it can be any Harmonic Pattern level
or it can be Order block at Price action concept.
⚫ What is Imbalance (FVG)?
Fair Value Gaps are price jumps caused by imbalanced buying and selling pressures.
A bullish Fair Value Gap is created when there is a gap between the high of the first candle and the low of the third candle.
A bearish Fair Value Gap is created when there is a gap between the low of the first candle and the high of the third candle.
⚫ FxCanli Costa Strategy is starting now
At my trades, I always wait trend reversal ( Type1 or Type 2 , That I mention above)
for buy trades, I enter the trade below the break out candles
for sell trades, I enter the trade above the break out candles
⚫ Where to put stop loss and take profit?
Stop loss is always above/below swing High/Low
and take profit has to be at least 1/1 Risk/Reward ratio
******* What is FxCanli COSTA Indicator? *******
FxCanli Costa draws all these, depends on FxCanli Costa Strategy
🔴 Market Structure
▪️ Up Trend with Green Lines
▪️ Down Trend with Red Lines
🔴 Trade Levels
FxCanli Costa Indicator first draws Buy Limit level or Sell limit level on the chart
and when Price Reaced to that level it will show Entry / Stop Loss / Take Profit levels
it puts stop loss above/below swing High/Low
and it put Take profit depends on Risk/Reward ratio from inputs.
🔴 FILTERING
FxCanli Costa Indicator's input has got some filtering parts
With these filtering you will not enter all trades
For Example Fibonacci Filtering
it will only give entry signal of impulse's 0.618 and more fibonacci level
🔵 Others Filter are;
RSI Filtering - It will give entry signal, if only RSI is at Overbought or Oversold
EMA Filtering - It will give entry signal with the same direction of Exponential Moving Average
Imbalance Filtering - It will give entry signal, if there is FVG - Imbalance at the entry level
Thanks alot, wish you great trades
Elliott Wave with Supertrend Exit - Strategy [presentTrading]## Introduction and How it is Different
The Elliott Wave with Supertrend Exit provides automated detection and validation of Elliott Wave patterns for algorithmic trading. It is designed to objectively identify high-probability wave formations and signal entries based on confirmed impulsive and corrective patterns.
* The Elliott part is mostly referenced from Elliott Wave by @LuxAlgo
Key advantages compared to discretionary Elliott Wave analysis:
- Wave Labeling and Counting: The strategy programmatically identifies swing pivot highs/lows with the Zigzag indicator and analyzes the waves between them. It labels the potential impulsive and corrective patterns as they form. This removes the subjectivity of manual wave counting.
- Pattern Validation: A rules-based engine confirms valid impulsive and corrective patterns by checking relative size relationships and fib ratios. Only confirmed wave counts are plotted and traded.
- Objective Entry Signals: Trades are entered systematically on the start of new impulsive waves in the direction of the trend. Pattern failures invalidate setups and stop out positions.
- Automated Trade Management: The strategy defines specific rules for profit targets at fib extensions, trailing stops at swing points, and exits on Supertrend reversals. This automates the entire trade lifecycle.
- Adaptability: The waveform recognition engine can be tuned by adjusting parameters like Zigzag depth and Supertrend settings. It adapts to evolving market conditions.
ETH 1hr chart
In summary, the strategy brings automation, objectivity and adaptability to Elliott Wave trading - removing subjective interpretation errors and emotional trading biases. It implements a rules-based, algorithmic approach for systematically trading Elliott Wave patterns across markets and timeframes.
## Trading Logic and Rules
The strategy follows specific trading rules based on the detected and validated Elliott Wave patterns.
Entry Rules
- Long entry when a new impulsive bullish (5-wave) pattern forms
- Short entry when a new impulsive bearish (5-wave) pattern forms
The key is entering on the start of a new potential trend wave rather than chasing.
Exit Rules
- Invalidation of wave pattern stops out the trade
- Close long trades on Supertrend downturn
- Close short trades on Supertrend upturn
- Use a stop loss of 10% of entry price (configurable)
Trade Management
- Scale out partial profits at Fibonacci levels
- Move stop to breakeven when price reaches 1.618 extension
- Trail stops below key swing points
- Target exits at next Fibonacci projection level
Risk Management
- Use stop losses on all trades
- Trade only highest probability setups
- Size positions according to chart timeframe
- Avoid overtrading when no clear patterns emerge
## Strategy - How it Works
The core logic follows these steps:
1. Find swing highs/lows with Zigzag indicator
2. Analyze pivot points to detect impulsive 5-wave patterns:
- Waves 1, 3, and 5 should not overlap
- Waves 3 and 5 must be longer than wave 1
- Confirm relative size relationships between waves
3. Validate corrective 3-wave patterns:
- Look for overlapping, choppy waves that retrace the prior impulsive wave
4. Plot validated waves and Fibonacci retracement levels
5. Signal entries when a new impulsive wave pattern forms
6. Manage exits based on pattern failures and Supertrend reversals
Impulsive Wave Validation
The strategy checks relative size relationships to confirm valid impulsive waves.
For uptrends, it ensures:
```
Copy code- Wave 3 is longer than wave 1
- Wave 5 is longer than wave 2
- Waves do not overlap
```
Corrective Wave Validation
The strategy identifies overlapping corrective patterns that retrace the prior impulsive wave within Fibonacci levels.
Pattern Failure Invalidation
If waves fail validation tests, the strategy invalidates the pattern and stops signaling trades.
## Trade Direction
The strategy detects impulsive and corrective patterns in both uptrends and downtrends. Entries are signaled in the direction of the validated wave pattern.
## Usage
- Use on charts showing clear Elliott Wave patterns
- Start with daily or weekly timeframes to gauge overall trend
- Optimize Zigzag and Supertrend settings as needed
- Consider combining with other indicators for confirmation
## Default Settings
- Zigzag Length: 4 bars
- Supertrend Length: 10 bars
- Supertrend Multiplier: 3
- Stop Loss: 10% of entry price
- Trading Direction: Both

Filter-Out Weak Pivot highs/lows, Swing highs/lows: MethodJust a simple indicator for refining the standard method of finding Pivot highs & Lows; Allowing user to filter-out weak/flat/rounded Pivot highs/lows
-Aim of this is to get pivot highs & pivot lows coded to print more in line with what the eye would naturally be drawn to as an obvious pivot high/low.
-This uses local moving average around the pivot high/low together with user-input ATR multiple, to create a condition for filtering out lacklustre pivot highs/lows.
-Thought i'd publish this separately as a tool that other coders might find useful.
//inputs//
~adjust looback/lookforward for Pivot highs/lows
~adjust 'spikiness' index to filter out less impressive pivot highs/lows (higher number = more selective)
Market Structure MA Based BOS [liwei666]
🎲 Overview
🎯 This BOS(Break Of Structure) indicator build based on different MA such as EMA/RMA/HMA, it's usually earlier than pivothigh() method
when trend beginning, customer your BOS with 2 parameters now.
🎲 Indicator design logic
🎯 The logic is simple and code looks complex, I‘ll explain core logic but not code details.
1. use close-in EMA's highest/lowest value mark as SWING High/Low when EMA crossover/under,
not use func ta.pivothigh()/ta.pivotlow()
2. once price reaching EMA’s SWING High/Low, draw a line link High/Low to current bar, labled as BOS
3. find regular pattern benefit your trading.
🎲 Settings
🎯 there are 4 input properties in script, 2 properties are meaningful in 'GRP1' another 2 are display config in 'GRP2'.
GRP1
MA_Type: MA type you can choose(EMA/RMA/SMA/HMA), default is 'HMA'.
short_ma_len: MA length of your current timeframe on chart
GRP2
show_short_zz: Show short_ma Zigzag
show_ma_cross_signal: Show ma_cross_signal
🎲 Usage
🎯 BOS signal usually worked fine in high volatility market, low volatility is meaningless.
🎯 We can see that it performs well in trending market of different symbols, and BOS is an opportunity to add positions
BINANCE:BTCUSDTPERP
BINANCE:ETHUSDTPERP
🎯 MA Based signal is earlier than pivothigh()/pivotlow() method when trend beginning. it means higher profit-loss rate.
🎯 any questions or suggestion please comment below.
Additionally, I plan to publish 20 profitable strategies in 2023; indicatior not one of them,
let‘s witness it together!
Hope this indicator will be useful for you :)
enjoy! 🚀🚀🚀

Trading BehnamI've read around here various definitions for engulfs along the lines of "an engulf consumes all orders at a level to allow price to easily pass through it." . That doesn't make much sense to me, if the guys with billions of dollars want to break a level, they will break it and price will run off very often. We've seen it time and time again, they don't need to engulf levels to give us a nice opportunity to get into the trade with them, if they want to blast through a level, they will do so and price will run off. If they want an opportunity to accumulate more orders before price runs away, then it doesn't make sense to engulf the level, better to let price bounce from that level and then fill more orders, if the level breaks then they have to deliberately stop the market running away and move it back to the pre-engulf area as the market momentum would naturally make it run off after an engulf. Other ideas about it being a secret signal between the institutions don't make sense to me either. To be honest, I think any secret signals between competing institutions come in the form of them in a heavily encrypted chatroom telling each other what to do. This collusion has been reported on previously as traders align their activities at important moments.
So I think we can all agree something along the lines of:
Fakeout:
Fakeout is an engulf of an obvious swing high/low in order to stop out traders and induce breakout traders to trade in the wrong direction, thus generating liquidity for the move in the opposite direction.
What's not so clear is the definition of the engulf, I'd like to try to give some ideas on the purpose of the engulf and it's definition and see what others think.
Engulf:
An engulf is the consumption of orders at an important level, not necessarily a swing/high low but an area where we expect to see supply or demand. Taking out of the orders tells us that the supply or demand which was or should have been present is now not present and tells us the intent direction of the market. If price runs off as is often the case, this is not tradeable and is effectively just a "breakout", although breakouts are usually considered to be breaks of swing high and lows which are obvious to the average trader. For an engulf to be tradeable there must be a retrace following the engulf back in the original direction. This adds confusion as it initially resembles a fakeout. So the question is, why does price retrace after the engulf? If an engulf to the short side is a genuine engulf and not a fakeout to generate long liquidity, why does it not travel immediately south if market momentum is ultimately south.
A small pocket of demand beneath the engulfed level may make it retrace north as price moves between areas of liquidity, this pocket of demand may give price enough momentum to make it back up to the supply which broke the demand level if key market participants do not favour an immediate market drop.
Alternatively key market participants may step in and drive the market back upwards.
Price moving north back to supply after the engulf may occur or be favourable for various reasons:
1) We often talk about FO generating liquidity because of breakout trading, but an engulf can also generate liquidity from breakout traders. Short breakout traders would place their stop losses a small distance above the engulf (breakout). If key players absorb this selling or allow a demand level to push price back up, they can run price back up to supply taking out the stops of the breakout short traders and make quick profit and/or generate more liquidity for their own shorts.
2) To confuse traders, the ITs don't want the puzzle that is Forex to be easy to solve, if price never retraced after an engulf then engulfs of all levels would be FOs. Price would either break and immediately runoff or it would turn and runoff in the other direction. In order to keep people confused about whether price is faking out or breaking out, sometimes price should whipsaw by breaking out, briefly faking out and then continuing in the direction of the breakout. This whipsaw pattern is to us a tradeable engulf.
3) Market momentum may be mixed, key players are indecisive or inactive or the market is behaving erratically.
4) As previously mentioned there may be a small pocket of supply/demand just past the engulf which is causing a reaction. This could also be viewed as a FO on a different timeframe. If the market engulfs an H1 demand level, then retraces for 30 mins upwards to supply, this engulf would be a valid and very profitable FO for an M1 trader looking to get long.

Sun Ingress ZodiacHi Traders,
Astrological signs of the tropical zodiac remain fixed relative to seasonal markers, such as the equinox and solstice points on the sky’s dome.
The zodiac used for the calculations does not correspond to the astronomical zodiac, but to 12 zones of 30 degrees along the ecliptic, measured from the position of the Sun at the spring equinox. The ecliptic is the plane of the Earth’s orbit around the Sun.
This script allows you see how Sun Ingress Zodiac can affect the Crypto, Stock, Indices & Commodity market.
The objectives of this script are:
1. you can see the Zodiac schedules in certain periods (earthsky.org)
2. you can see the correlation between Sun Ingress Zodiac and market reaction (is it turning or is it a swing high/ low? )
Those Dates are the Zodiac schedule (history & future), so when the Zodiac dates arrived, we can forecast the turning or swing high/low in the market (crypto, stocks, commodities & indices), the turning or swing high/low is +/- 1 day.
Those lines are just a simply vertical lines that can help us backtesting easily, hopefully we can take profit from this..
Here are some examples of the specific Zodiac affect:
Sun Ingress Aries
Sun Ingress Taurus
Sun Ingress Gemini
Sun Ingress Cancer
Sun Ingress Leo
Sun Ingress Virgo
Sun Ingress Libra
Sun Ingress Scorpio
Sun Ingress Sagittarius
Sun Ingress Capricorn
Sun Ingress Aquarius
Sun Ingress Pisces
PS:
when you subscribe, you will get:
1. Planetary Aspects & Transits (9 Planetary Ruler)
2. Retrogrades
3. Moon Phase, Moon Eclipse & 4 seasons
4. Easy Aspects (Trine & Sextile)
5. Hard Aspects (Opposition, Square & Conjunction)
6. Gann Seasonal Dates
7. Sun Ingress Zodiac

Malama's Quantum Swing Modulator# Multi-Indicator Swing Analysis with Probability Scoring
## What Makes This Script Original
This script combines pivot point detection with a **weighted scoring system** that dynamically adjusts indicator weights based on market regime (trending vs. ranging). Unlike standard multi-indicator approaches that use fixed weightings, this implementation uses ADX to detect market conditions and automatically rebalances the influence of RSI, MFI, and price deviation components accordingly.
## Core Methodology
**Dynamic Weight Allocation System:**
- **Trending Markets (ADX > 25):** Prioritizes momentum (50% weight) with reduced oscillator influence (20% each for RSI/MFI)
- **Ranging Markets (ADX < 25):** Emphasizes mean reversion signals (40% each for RSI/MFI) with no momentum bias
- **Price Wave Component:** Uses EMA deviation normalized by ATR to measure distance from central tendency
**Pivot-Based Level Analysis:**
- Detects swing highs/lows using configurable left/right lookback periods
- Maintains the most recent pivot levels as key reference points
- Calculates proximity scores based on current price distance from these levels
**Volume Confirmation Logic:**
- Defines "volume entanglement" when current volume exceeds SMA by user-defined factor
- Integrates volume confirmation into confidence scoring rather than signal generation
## Technical Implementation Details
**Scoring Algorithm:**
The script calculates separate bullish and bearish "superposition" scores using:
```
Bullish Score = (RSI_bull × weight) + (MFI_bull × weight) + (price_wave × weight × position_filter) + (momentum × weight)
```
Where:
- RSI_bull = 100 - RSI (inverted for oversold bias)
- MFI_bull = 100 - MFI (inverted for oversold bias)
- Position_filter = Only applies when price is below EMA for bullish signals
- Momentum component = Only active in trending markets
**Confidence Calculation:**
Base confidence starts at 25% and increases based on:
- Market regime alignment (trending/ranging appropriate conditions)
- Volume confirmation presence
- Oscillator extreme readings (RSI < 30 or > 70 in ranging markets)
- Price position relative to wave function (EMA)
**Probability Output:**
Final probability = (Base Score × 0.6) + (Proximity Score × 0.4)
This balances indicator confluence with proximity to identified levels.
## Key Differentiators
**vs. Standard Multi-Indicator Scripts:** Uses regime-based dynamic weighting instead of fixed combinations
**vs. Simple Pivot Indicators:** Adds quantified probability and confidence scoring to pivot levels
**vs. Basic Oscillator Combinations:** Incorporates market structure analysis through ADX regime detection
## Visual Components
**Wave Function Display:** EMA with ATR-based uncertainty bands for trend context
**Pivot Markers:** Clear visualization of detected swing highs and lows
**Analysis Table:** Real-time probability, confidence, and action recommendations for current pivot levels
## Practical Application
The dynamic weighting system helps avoid common pitfalls of multi-indicator analysis:
- Reduces oscillator noise during strong trends by emphasizing momentum
- Increases mean reversion sensitivity during sideways markets
- Provides quantified probability rather than subjective signal interpretation
## Important Limitations
- Requires sufficient historical data for pivot detection and volume calculations
- Probability scores are based on current market regime and may change as conditions evolve
- The scoring system is designed for confluence analysis, not standalone trading decisions
- Past probability accuracy does not guarantee future performance
## Technical Requirements
- Works on all timeframes but requires adequate lookback history
- Volume data required for entanglement calculations
- Best suited for liquid instruments where volume patterns are meaningful
This approach provides a systematic framework for evaluating swing trading opportunities while acknowledging the probabilistic nature of technical analysis.

Market Structure MTF Trend [Pt]█ Author's Notes
There are numerous market structure indicators in the TradingView library, each offering a unique approach to identifying price action shifts. Market Structure MTF Trend was created with simplicity and flexibility in mind—providing a highly customizable multi-timeframe setup, visually clear trendlines, and straightforward labeling. This combination helps both new and experienced traders easily spot and interpret market structure changes.
█ Overview
Market Structure MTF Trend is a powerful yet user-friendly indicator designed to identify and visualize key turning points in price action. It focuses on two core concepts:
Change of Character (CHoCH): A momentary shift in the market’s behavior, signaling that the current price movement may be losing momentum and could soon reverse.
Break of Structure (BoS): A more definitive event confirming a new price pattern, where the market establishes a fresh trend direction by surpassing previous swing highs or lows.
By combining these signals across up to four different timeframes, even traders unfamiliar with market structure can quickly learn to spot and validate potential trend reversals or continuations.
█ Key Features
Multi-Timeframe Analysis: Monitors CHoCH and BoS events simultaneously on multiple intervals (e.g., 15m, 30m, 60m, 240m), providing a clear, layered understanding of market dynamics.
Straightforward Visual Cues: Labels are placed directly on the chart at swing highs and lows, while colored bars at the bottom give an instant snapshot of whether each timeframe is bullish or bearish.
Configurable Timeframes & Pivot Strength: Easily set up the desired intervals and adjust pivot strength to tune how sensitive the indicator is to minor price fluctuations.
Color-Coded Signals: Different colors help you distinguish between potential early reversals (CHoCH) and confirmed shifts (BoS), ensuring each signal’s importance is immediately clear.
█ Usage & Benefits
Learn Market Structure Basics: For those new to swing highs/lows, CHoCH, and BoS, the script’s on-chart labels and dynamic bar coloring provide a practical, visual way to grasp these concepts.
Spot Reversals Early: CHoCH alerts you to possible shifts in momentum, allowing you to anticipate trend changes before they fully develop.
Confirm Trend Breaks: BoS events confirm that the market has established a new directional bias, reinforcing higher‐probability entry or exit points.
Reduce Noise & Stay Focused: The multi-timeframe setup ensures you won’t overlook larger trends or get lost in smaller fluctuations.
Streamline Decision-Making: Color-coded bars let you gauge overall market sentiment at a glance—ideal for quickly validating trades without juggling multiple charts.
Market Structure MTF Trend is perfect for traders who want to learn or refine their understanding of price action. By integrating multiple timeframes into a single, cohesive interface, this tool highlights both subtle shifts and confirmed breaks in market structure, empowering you to trade with greater insight and confidence.

Half Cup [LuxAlgo]The Half Cup indicator detects and displays patterns with the shape of a Half Cup , initiating a channel. From this channel, breakouts are detected and highlighted with dots.
Users can control the shape of the Half Cup and the channel length through various settings.
Do note that the displayed half cups are displayed retrospectively, making them subject to backpainting.
🔶 USAGE
The idea behind the indicator is derived from the Cup & Handle pattern, which requires waiting for the pattern full completion.
Our Half Cup publication aims to find opportunities when the potential cup is only formed halfway.
In this example, a green dot shows the first breakout of the upper channel extremity. A few bars later, the price went under it, after which it returned above, triggering a second green dot. Both triggers were good opportunities in this case, and the price rose afterward.
The Half Cup pattern can be the start of a potential complete Cup & Handle (As in the example above, a complete Cup pattern (without the Handle ) is shown, manually drawn with dashed lines).
Every green/red dot, whether on a bullish or bearish pattern, points to a breakout respectively above/below the channel.
Besides drawing patterns and the corresponding breakouts, the Half Cup indicator can also provide insights into trends and potential opportunities in the long run.
🔶 DETAILS
🔹 Validation
Several criteria must be fulfilled before a visible pattern on the chart is drawn.
Calculations are done beforehand to know where the Half Cup pattern would be positioned.
The pattern's bottom and top edges are checked for the number of bars whose closing price is outside the half-cup area. When the number of breakouts above/below is equal to or lower than the user-defined settings ( Max % Breaks Top/Bottom ), the pattern is drawn together with a brighter-colored channel next to it.
Dots highlighting the channel's breakout can be drawn from that moment until the end of both channel lines.
🔹 Positioning
Users can adjust the following settings to fit their needs:
% Broadness: Moves the Top/Bottom line (bullish or bearish) diagonally upwards/downwards.
Vertical Shift: Shifts the entire pattern up/down.
Channel Length: Sets the line length of the channel.
Note that adjusting the position of the pattern will change the validation; the script will be rerun to check if patterns are still valid or if new patterns can be drawn. Some patterns may disappear, while new ones may appear.
Before adjusting the position, the user can set Max % Breaks Top/Bottom at 100%. When the positioning is set, Max % Breaks Top/Bottom can be set as desired.
🔹 Updated Drawings
The Half Cup pattern is always drawn retrospectively (that is it is subject to backpainting), the channel is drawn from the bar from where the pattern is detected. Every breakout of the channel will remain visible as dots.
When a new swing high/low is found while the previous swing low/high remains the same, the pattern is updated to minimize clutter. The dots of earlier drawings will remain visible (to ensure no repainting occurs), but the color becomes faded, as such bright dots are associated with patterns that are visible on the chart, while faded dots are from removed/updated patterns.
🔶 SETTINGS
Swing Length: Period used for the swing detection, with higher values returning longer-term Swing Levels.
🔹 Validation
Max % Breaks Bottom: Allowed maximum amount of bars where the closing price is below the bottom of the Half Cup pattern against the total width of the pattern (bars).
Max % Breaks Top: Allowed maximum amount of bars where the closing price is above the top of the Half Cup pattern against the total width of the pattern (bars).
🔹 Positioning
% Broadness: Moves the Top/Bottom line (bullish or bearish) diagonally upwards/downwards.
Vertical Shift: Shifts the entire pattern up/down.
Channel Length: Sets the line length of the channel.

MTF Trend WidgetThis indicator identifies trends in multiple higher timeframes (D, W, M) and shows them in a widget off to the right of the chart.
It's meant to be used as an alternative filter for "trading with the trend." Typically people use moving averages of varying lengths for this (i.e. if over 200 MA it's an uptrend, etc.), but I wanted to see if it might be more effective to see if the higher timeframes were actually trending or not in a certain direction.
For the purposes of this indicator, an uptrend is defined as higher highs and higher lows. So if currently in a downtrend and the highs are broken, the indicator will flip to an uptrend because now we have a higher high. Vice versa for downtrends.
The user can choose the lookback period for defining these highs/lows (the pivot points). A smaller lookback number will give you more frequent pivot points.
The user can toggle on visibility of all historical pivot points to make sure the frequency and placement of the swing highs/lows is to their liking.
The user can show the support/resistance lines of those most recent swing high/low points on the multiple timeframes as well.
When these lines are breached, that is when the trends change, so you can see if you are close to changing any longer term trends.
My hope is that this gives people a quick glance at the overall trend without having to cycle through different timeframes.

RSI ADX Bollinger Analysis High-level purpose and design philosophy
This indicator — RSI-ADX-Bollinger Analysis — is a compact, educational market-analysis toolkit that blends momentum (RSI), trend strength (ADX), volatility structure (Bollinger Bands) and simple volumetrics to provide traders a snapshot of market condition and trade idea quality. The design philosophy is explicit and layered: use each component to answer a different question about price action (momentum, conviction, volatility, participation), then combine answers to form a more robust, explainable signal. The mashup is intended for analysis and learning, not automatic execution: it surfaces the why behind signals so traders can test, learn and apply rules with risk management.
________________________________________
What each indicator contributes (component-by-component)
RSI (Relative Strength Index) — role and behavior: RSI measures short-term momentum by comparing recent gains to recent losses. A high RSI (near or above the overbought threshold) indicates strong recent buying pressure and potential exhaustion if price is extended. A low RSI (near or below the oversold threshold) indicates strong recent selling pressure and potential exhaustion or a value area for mean-reversion. In this dashboard RSI is used as the primary momentum trigger: it helps identify whether price is locally over-extended on the buy or sell side.
ADX (Average Directional Index) — role and behavior: ADX measures trend strength independently of direction. When ADX rises above a chosen threshold (e.g., 25), it signals that the market is trending with conviction; ADX below the threshold suggests range or weak trend. Because patterns and momentum signals perform differently in trending vs. ranging markets, ADX is used here as a filter: only when ADX indicates sufficient directional strength does the system treat RSI+BB breakouts as meaningful trade candidates.
Bollinger Bands — role and behavior: Bollinger Bands (20-period basis ± N standard deviations) show volatility envelope and relative price position vs. a volatility-adjusted mean. Price outside the upper band suggests pronounced extension relative to recent volatility; price outside the lower band suggests extended weakness. A band expansion (increasing width) signals volatility breakout potential; contraction signals range-bound conditions and potential squeeze. In this dashboard, Bollinger Bands provide the volatility/structural context: RSI extremes plus price beyond the band imply a stronger, volatility-backed move.
Volume split & basic MA trend — role and behavior: Buy-like and sell-like volume (simple heuristic using close>open or closeopen) or sell-like (close1.2 for validation and compare win rate and expectancy.
4. TF alignment: Accept signals only when higher timeframe (e.g., 4h) trend agrees — compare results.
5. Parameter sensitivity: Vary RSI threshold (70/30 vs 80/20), Bollinger stddev (2 vs 2.5), and ADX threshold (25 vs 30) and measure stability of results.
These exercises teach both statistical thinking and the specific failure modes of the mashup.
________________________________________
Limitations, failure modes and caveats (explicit & teachable)
• ADX and Bollinger measures lag during fast-moving news events — signals can be late or wrong during earnings, macro shocks, or illiquid sessions.
• Volume classification by open/close is a heuristic; it does not equal TAPEDATA, footprint or signed volume. Use it as supportive evidence, not definitive proof.
• RSI can remain overbought or oversold for extended stretches in persistent trends — relying solely on RSI extremes without ADX or BB context invites large drawdowns.
• Small-cap or low-liquidity instruments yield noisy band behavior and unreliable volume ratios.
Being explicit about these limitations is a strong point in a TradingView description — it demonstrates transparency and educational intent.
________________________________________
Originality & mashup justification (text you can paste)
This script intentionally combines classical momentum (RSI), volatility envelope (Bollinger Bands) and trend-strength (ADX) because each indicator answers a different and complementary question: RSI answers is price locally extreme?, Bollinger answers is price outside normal volatility?, and ADX answers is the market moving with conviction?. Volume participation then acts as a practical check for real market involvement. This combination is not a simple “indicator mashup”; it is a designed ensemble where each element reduces the others’ failure modes and together produce a teachable, testable signal framework. The script’s purpose is educational and analytical — to show traders how to interpret the interplay of momentum, volatility, and trend strength.
________________________________________
TradingView publication guidance & compliance checklist
To satisfy TradingView rules about mashups and descriptions, include the following items in your script description (without exposing source code):
1. Purpose statement: One or two lines describing the script’s objective (educational multi-indicator market overview and idea filter).
2. Component list: Name the major modules (RSI, Bollinger Bands, ADX, volume heuristic, SMA trend checks, signal tracking) and one-sentence reason for each.
3. How they interact: A succinct non-code explanation: “RSI finds momentum extremes; Bollinger confirms volatility expansion; ADX confirms trend strength; all three must align for a BUY/SELL.”
4. Inputs: List adjustable inputs (RSI length and thresholds, BB length & stddev, ADX threshold & smoothing, volume MA, table position/size).
5. Usage instructions: Short workflow (check TF alignment → confirm participation → define stop & R:R → backtest).
6. Limitations & assumptions: Explicitly state volume is approximated, ADX has lag, and avoid promising guaranteed profits.
7. Non-promotional language: No external contact info, ads, claims of exclusivity or guaranteed outcomes.
8. Trademark clause: If you used trademark symbols, remove or provide registration proof.
9. Risk disclaimer: Add the copy-ready disclaimer below.
This matches TradingView’s request for meaningful descriptions that explain originality and inter-component reasoning.
________________________________________
Copy-ready short publication description (paste into TradingView)
Advanced RSI-ADX-Bollinger Market Overview — educational multi-indicator dashboard. This script combines RSI (momentum extremes), Bollinger Bands (volatility envelope and band expansion), ADX (trend strength), simple SMA trend bias and a basic buy/sell volume heuristic to surface high-quality idea candidates. Signals require alignment of momentum, volatility expansion and rising ADX; volume participation is displayed to support signal confidence. Inputs are configurable (RSI length/levels, BB length/stddev, ADX length/threshold, volume MA, display options). This tool is intended for analysis and learning — not for automated execution. Users should back test and apply robust risk management. Limitations: volume classification here is a heuristic (close>open), ADX and BB measures lag in fast news events, and results vary by instrument liquidity.
________________________________________
Copy-ready risk & misuse disclaimer (paste into description or help file)
This script is provided for educational and analytical purposes only and does not constitute financial or investment advice. It does not guarantee profits. Indicators are heuristics and may give false or late signals; always back test and paper-trade before using real capital. The author is not responsible for trading losses resulting from the use or misuse of this indicator. Use proper position sizing and risk controls.
________________________________________
Risk Disclaimer: This tool is provided for education and analysis only. It is not financial advice and does not guarantee returns. Users assume all risk for trades made based on this script. Back test thoroughly and use proper risk management.
