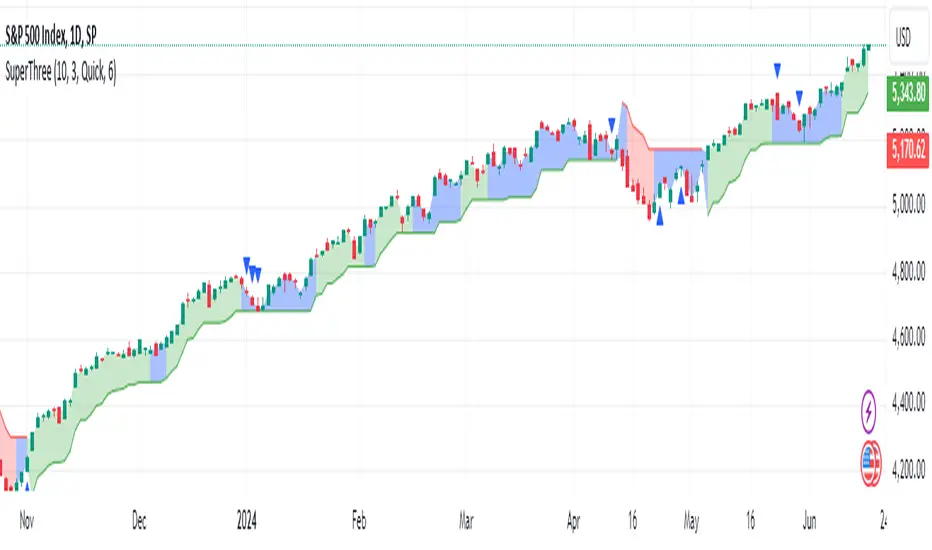
SuperThreeThe SuperThree is a comprehensive technical indicator designed to identify and visualize market trends and counter-trend momentum in trading. It uses a unique color-coding system to represent different market conditions and potential trading opportunities.
Uptrend (Green Fill) : This is indicated by a green fill. An uptrend is a period where prices are increasing overall, suggesting a strong market. It’s an ideal time for traders to consider entering long positions or exiting short positions.
Downtrend (Red Fill) : This is represented by a red fill. A downtrend is a period where prices are decreasing overall, indicating a bearish market. Traders might consider entering short positions or exiting long positions during this phase.
Sideways Trend (Blue Fill) : This is shown by a blue fill. A sideways trend, also known as a horizontal trend, is when the price is relatively stable and not making significant upward or downward movements. It’s often a period of consolidation before the price moves up or down.
Counter-Trend Momentum (Blue Arrows) : Blue arrows indicate counter-trend momentum, which can be a signal to exit trades or look for potential trend reversals. These are crucial points where the market’s momentum is shifting and may be about to move in the opposite direction.
The SuperThree indicator is an enhancement of the Supertrend indicator, providing additional features and visual cues to help traders make informed decisions. However, like all indicators, it should be used in conjunction with other forms of analysis to confirm signals and avoid potential false positives. Always consider your risk tolerance and investment goals before making trading decisions.
Happy trading! 😊
Pesquisar nos scripts por "supertrend"
Backtest Strategy Optimizer Adapter - Supertrend ExampleSample Code
This is a sample code for my Backtest Strategy Optimizer Adapter library.
You can find the library at:
Backtest Strategy Optimizer Tester
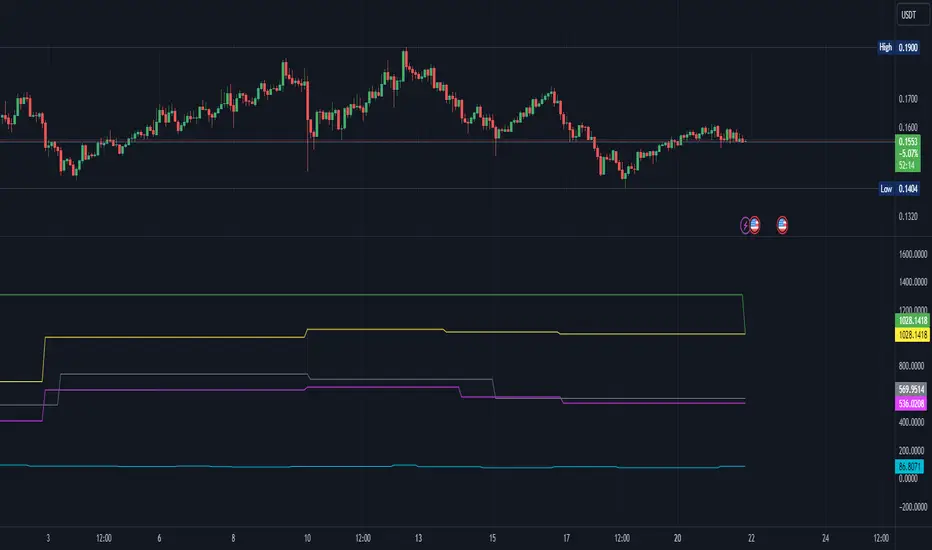
With this indicator, you will be able to run one or multiple backtests with different variables (combinations). For example, you can run dozens of backtests of Supertrend at once with an increment factor of 0.1, or whatever you prefer. This way, you can easily grab the most profitable settings and use them in your strategy. The chart above shows different color plots, each indicating a profit backtest equal to tradingview backtesting system. This code uses my backtest library, available in my profile.
Below the code you should edit yourself
You can use ChatGPT or write a python script to autogenerate code for you.
// #################################################################
// # ENTRIES AND EXITS
// #################################################################
// You can use the link and code in the description to create
// your code for the desired number of entries / exits.
// #################################################################
// AUTO GENERATED CODE
// ▼▼▼▼▼▼▼▼▼▼▼▼▼▼▼▼▼▼▼▼▼▼▼▼▼▼▼▼▼▼▼▼▼▼▼▼▼▼▼▼▼▼▼▼▼▼▼▼▼▼▼▼▼▼▼▼▼▼▼▼▼▼▼▼▼
= ti.supertrend(10, 0.1)
= ti.supertrend(10, 0.2)
= ti.supertrend(10, 0.3)
= ti.supertrend(10, 0.4)
// 005 etc...
pnl_001 = backtest.profit(date_start, date_end, entry_001, exit_001)
pnl_002 = backtest.profit(date_start, date_end, entry_002, exit_002)
pnl_003 = backtest.profit(date_start, date_end, entry_003, exit_003)
pnl_004 = backtest.profit(date_start, date_end, entry_004, exit_004)
plot(pnl_001, title='0.1', color=backtest.color(001))
plot(pnl_002, title='0.2', color=backtest.color(002))
plot(pnl_003, title='0.3', color=backtest.color(003))
plot(pnl_004, title='0.4', color=backtest.color(004))
// Make sure you set the correct array size.
// The amount of tests + 1 (e.g. 4 tests you set it to 5)
var results_list = array.new_string(5)
if (ta.change(pnl_001))
array.set(results_list, 0, str.tostring(pnl_001) + '|0.1')
if (ta.change(pnl_002))
array.set(results_list, 1, str.tostring(pnl_002) + '|0.2')
if (ta.change(pnl_003))
array.set(results_list, 2, str.tostring(pnl_003) + '|0.3')
if (ta.change(pnl_004))
array.set(results_list, 3, str.tostring(pnl_004) + '|0.4')
// ▲▲▲▲▲▲▲▲▲▲▲▲▲▲▲▲▲▲▲▲▲▲▲▲▲▲▲▲▲▲▲▲▲▲▲▲▲▲▲▲▲▲▲▲▲▲▲▲▲▲▲▲▲▲▲▲▲▲▲▲▲▲▲▲▲
// AUTO GENERATED CODE
// #################################################################
Harmonic Trend Fusion [kikfraben]📈 Harmonic Trend Fusion - Your Personal Trading Assistant
This versatile tool combines multiple indicators to provide a holistic view of market trends and potential signals.
🚀 Key Features:
Multi-Indicator Synergy: Benefit from the combined insights of Aroon, DMI, MACD, Parabolic SAR, RSI, Supertrend, and SMI Ergodic Oscillator, all in one powerful indicator.
Customizable Plot Options: Tailor your chart by choosing which signals to visualize. Whether you're interested in trendlines, histograms, or specific indicators, the choice is yours.
Color-Coded Trends: Quickly identify bullish and bearish trends with the color-coded visualizations. Stay ahead of market movements with clear and intuitive signals.
Table Display: Stay informed at a glance with the interactive table. It dynamically updates to reflect the current market sentiment, providing you with key information and trend direction.
Precision Control: Fine-tune your analysis with precision control over indicator parameters. Adjust lengths, colors, and other settings to align with your unique trading strategy.
🛠️ How to Use:
Customize Your View: Select which indicators to display and adjust plot options to suit your preferences.
Table Insights: Monitor the dynamic table for real-time updates on market sentiment and trend direction.
Indicator Parameters: Experiment with different lengths and settings to find the combination that aligns with your trading style.
Whether you're a seasoned trader or just starting, Harmonic Trend Fusion equips you with the tools you need to navigate the markets confidently. Take control of your trading journey and enhance your decision-making process with this comprehensive trading assistant.

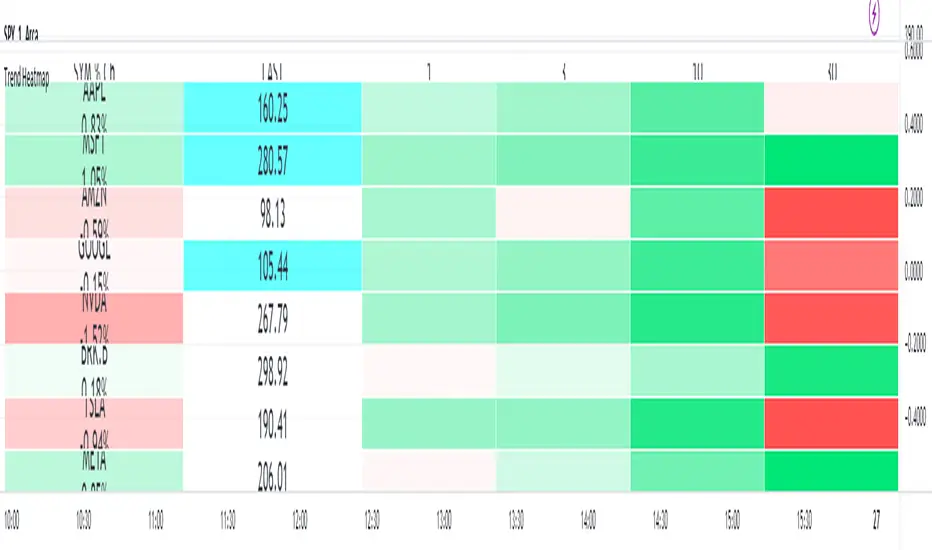
MultiSymbol Multitimeframe Supertrend TableThis is an initial release for four symbols and four timeframes.
Symbols and timeframes are customizable.
There is a gradient heatmap for the daily percentage change as well as another heatmap for each of the timeframe trends.
The two different forms of heatmap have separate settings so can have different colors and scaling if desired.
The trend used is Trading View's built in Supertrend and the gradient for the trend changes based on how far above or below that timeframe's trend the latest price currently is
It is recommended to place this in a separate pane and use it in the top left so it occupies the whole pane.
You can adjust the cell width and height to fit to your own chart window
Triple SuperTrendBased on supertrend by kivancozbilgic this indicator shows 3 lines and consider a valid buy/sell signal the moment when all 3 lines are congruent

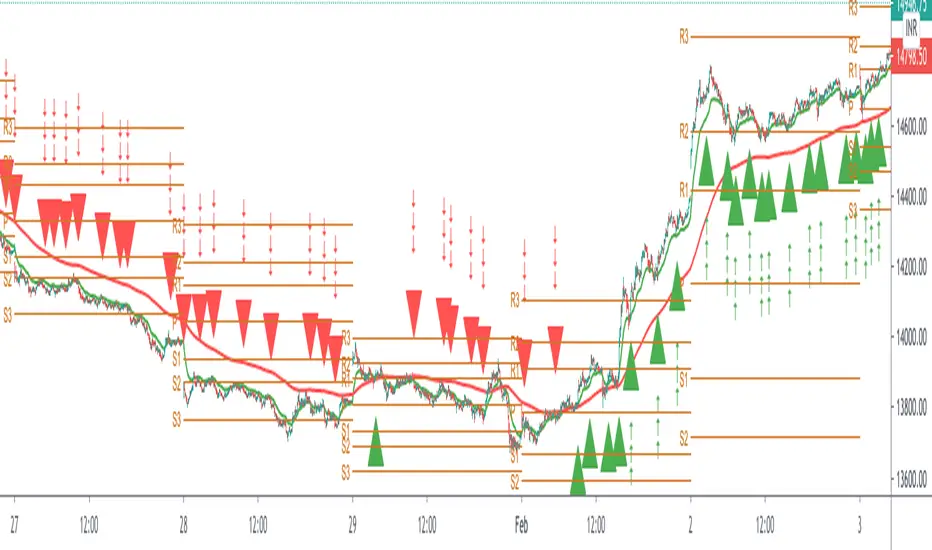
Trend SuggestionsThis brings together a number of variables to produce trend predictions that could be utilized as decision-making tools.
Uses the aforementioned price and volume derivatives
- A moving average and three weighted moving averages (WMA1, WMA2, WMA3)
- Super Trend Line (ST)
- Opening Range Breakout on Five Minutes, Resistance Bands Pocket pivots, support, and price volume
he Direction is determined by the High and Low Bands of WMAs and the Supertrend Line, which are used to determine the Upper and Lower Lines around the Price. When the price passes below the lower boundary of the band, a downtrend is said to have begun.
Similarly, for an uptrend, this continues until the price passes over the upper edge of the band. Teal for an uptrend and fuchsia for a downturn area shared by the band to identify the trend.
The first five minutes of the breakout lines have a tiny buffer augmentation of 11% applied to them.
Based on what has been observed, support and resistance zones have been somewhat changed from the figures that are often utilized (might work other markets as well)
The markings that may be seen are as follows:
- Blue Triangle indicates a pocket pivot with an upward bias;
- Maroon Triangle indicates a pocket pivot with a downward bias;
- Teal colored Diamonds indicate price upthrusts and potential trend confirmation locations, depending on success or failure.
- Similar backdrop color changes that look as vertical shading are also used to identify them.
- Fuchsia-colored diamonds indicate price declines and a potential trend, depending on whether it persists or fails.
- Dark green and maroon square boxes indicate potential price reversals in the support and resistance bands, respectively.
It goes without saying that this work is derived from numerous other open-source community initiatives.
Feel free to adjust anything you'd like, and we appreciate any feedback.

MACD x SuperTrend with trailing stoplossThis trading strategy is based on MACD crossover and crossunder. It uses the supertrend to identify the trend it is trading on and takes trades accordingly. You can use the built in risk to reward ratio parameter through the settings of the indicator for your desired R/R
My goal in creating this indicator was to learn about risk management. This indicator will put up a stop-loss and take profit target according to the entry point it shows.
This indicator showed me the best results on BTC at 5min price chart. I'm new to trading so, do your own due diligence

SR Relative StrengthThis is a relative strength model for Indian Stock Markets where in the price of the stock in the current scenario is compared with the benchmark indices ( NIFTY / BANKNIFTY) over a period of 55 days ( by default).
This indicator also has RSI and Supertrend built-in by default. Hence this indicator can be used in place of 3 indicators.
How to use?
1. When the background is blue, it means that the stock is relatively strong as compared to the bench mark indices over a period of 55 days and the RSI is > 50
When both RS > 0 & RSI > 50 the background will be blue. If either or is true it won't turn blue.
2. Superternd by default setting is 10,3 which can be changed as per one's requirement.
Thanks!!

COSMO TREND👉 What is this indicator ?
This indicator is made up with the help of Multiple SuperTrend and Price Action , In this awesome indicator, The buy and sell entry is taken by comparing the trend using our secret logic.
👉 What is special about this indicator ?
More than Ten Takeprofit price points can be seen in this indicator , The Stoploss price point can be seen as well . You can simply adjust take profit percentage and stop loss percentage in indicator settings
👉 What kind of Take Profit signal is there on this indicator ?
Ten types of take profit signals are displayed on this indicator, each marked as TP1,TP2,TP3,TP4,TP5,TP6,TP7,TP8,TP9 and TP10 respectively. The take profit signals available for both buy and sell entries. The take profit of the buy entry is shown in Green Color and the take profit of the sell entry is shown in Red Color.
👉 What kind of Exit signal is there on this indicator ?
Exit signals can be seen at the end of the trend
👉 How many alarms does this indicator have ?
This indicator has 13 types of alarm for Buy , Sell , Take Profit and Exit signal, and it is best to set the alarm by selecting the Alert Once Bar Close option to avoid repaint.
👉 On which coins can this indicator be used ?
This indicator is best used on all cryptocurrencies, forex markets and stocks , This indicator is very helpful to get high returns on all cryptocurrencies with low price and high voltality
Note : This indicator only works well in all time frames ( 1s,5s,10s,1m,5m,1h etc...) , Use appropriate values when using other coins. If you have difficulty finding the value, you can contact us.
Default Setup Instructions 👇
Time Frame : 1 Minute
Default Coin : C98USDT
The following settings can be found in this indicator
You can simply adjust take profit percentage and stoploss percentage in indicator settings
Orgin Factor : This is the ATR Factor Value for High Time Frame trend. You can change this value according to the volatility , the ATR Factor value is also used to reduce the chance of a fake signal
Mid Factor : This is the ATR Factor Value for Low Time Frame trend. You can change this value according to the volatility , the ATR Factor value is also used to reduce the chance of a fake signal
Low Factor : This is the ATR Factor Value for Second Low Time Frame trend.
Take Profit - TP1 Percentage : Give What percentage for take First TP
Take Profit - TP2 Percentage : Give What percentage for take Second TP
Take Profit - TP3 Percentage : Give What percentage for take Third TP
Take Profit - TP4 Percentage : Give What percentage for take Fourth TP
Take Profit - TP4 Percentage : Give What percentage for take Fifth TP
Take Profit - TP4 Percentage : Give What percentage for take Sixth TP
Take Profit - TP4 Percentage : Give What percentage for take Seventh TP
Take Profit - TP4 Percentage : Give What percentage for take Eighth TP
Take Profit - TP4 Percentage : Give What percentage for take Nineth TP
Take Profit - TP4 Percentage : Give What percentage for take Tenth TP

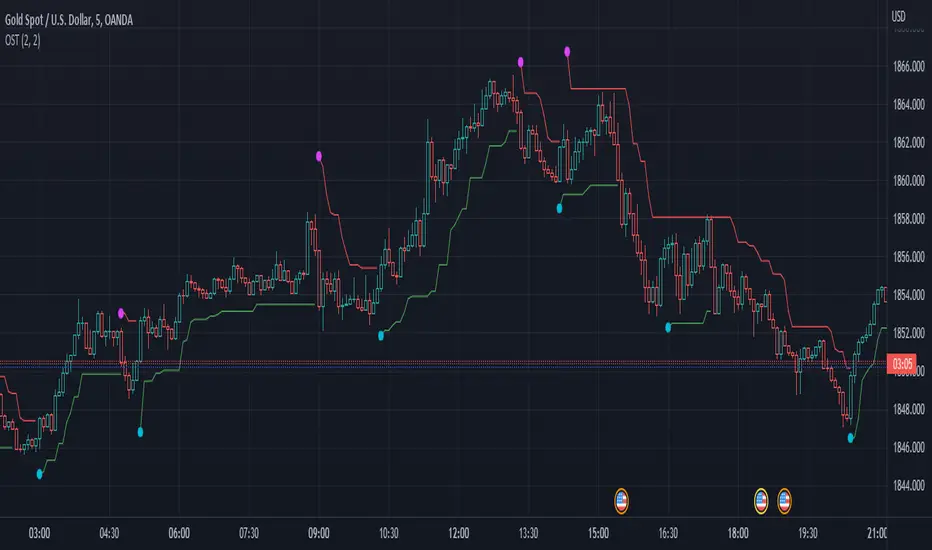
OST - Overlapped Super TrendThis Supertrend indicator uses different source for Uptrend and Downtrend lines.
Uptrend line uses high as its source.
Downtrend line uses low as its source.
Effect: It has faster Uptrend/Downtrend signals.
Triple SupertrendThis script is based on Supertrend Indicator. And added 2 more trends to get better confirmation.
Buy when all 3 lines are Green
Sell when all 3 lines are Red

7 Moving Averages [Plus]Moving Averages are price based, lagging (or reactive) indicators that display the average price of a security over a set period of time. A Moving Average is a good way to gauge momentum as well as to confirm trends, and define areas of support and resistance. Essentially, Moving Averages smooth out the “noise” when trying to interpret charts. Noise is made up of fluctuations of both price and volume. Because a Moving Average is a lagging indicator and reacts to events that have already happened, it is not used as a predictive indicator but as an interpretive one for confirmations and analysis.
Bollinger Bands (BB) are a widely popular technical analysis instrument created by John Bollinger. The BB consist of a band of three lines which are plotted in relation to security prices. The line in the middle is usually a Simple Moving Average (SMA) set to a period of 20 days (the type of trend line and period can be changed by the trader; however a 20 day moving average is by far the most popular). The SMA then serves as a base for the Upper and Lower Bands which are used as a way to measure volatility by observing the relationship between the Bands and price. Typically the Upper and Lower Bands are set to two standard deviations away from the SMA (The Middle Line); however the number of standard deviations can also be adjusted by the trader.
This script shows 6 moving averages and Bollinger Bands.
Features:
- Standard MA inputs.
- MA type.
- MA period.
- MA source.
- MA resolution (time frame).
- MA Offset.
- Forecasting : forcasted prices are calculated using our MAType and MASource for the MAPeriod.
- Trail: Show only candles not included in the MA calculation.
The color of MA1 depends on the chosen strategy, by default this is the 3EMA strategy. You can also select "Pivot Point Supertrend" or "Ichimoku Trend"
Added "Parabolic Stop and Reverse (PSAR)" . The PSAR is a time and price technical analysis tool primarily used to identify points of potential stops and reverses. In fact, the SAR in Parabolic SAR stands for "Stop and Reverse". The indicator's calculations create a parabola which is located below price during a Bullish Trend and above Price during a Bearish Trend.
Added "Linear Regression Channel" which can be correctly plotted on logarithmic charts. A linear regression channel consists of a median line with 2 parallel lines, above and below it, at the same distance. Those lines can be seen as support and resistance. The median line is calculated based on linear regression of the closing prices but the source can also be set to open, high or low. The height of the channel is based on the deviation of price to the median line. Extrapolating the channel forward can help to provide a bias and to find trading opportunities.

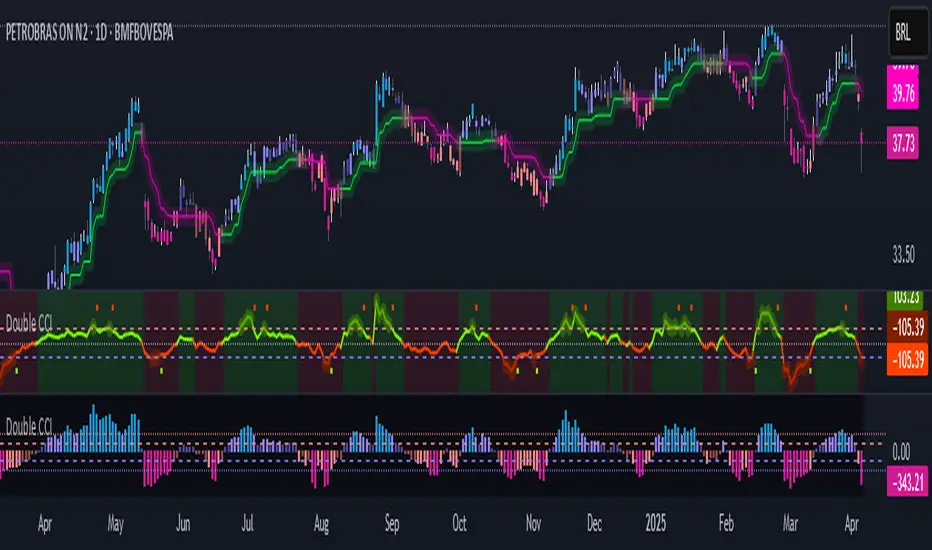
Double CCIThe Commodity Channel Index (CCI) is a momentum oscillator used in technical analysis primarily to identify overbought and oversold levels by measuring an instrument's variations away from its statistical mean. Besides overbought/oversold levels, CCI is often used to find reversals as well as divergences. Originally, the indicator was designed to be used for identifying trends in commodities, however it is now used in a wide range of financial instruments.
There are several steps involved in calculating the CCI. The following example is for a typical 14 Period CCI:
CCI = (Typical Price - 14 Period SMA of TP) / (.015 x Mean Deviation)
Typical Price (TP) = (High + Low + Close)/3
Constant = .015
The Constant is set at .015 for scaling purposes. By including the constant, the majority of CCI values will fall within the 100 to -100 range.
Mean Deviation:
1) Subtract the most recent 14 Period Simple Moving from each typical price (TP) for the Period.
2) Sum these numbers strictly using absolute values.
3) Divide the value generated in step 2 by the total number of Periods (14 in this case).
Overbought and Oversold conditions can be used in their more traditional sense to identify future reversals . Remember true overbought/oversold thresholds values can and often do vary between instruments.
During a Bullish Trend , price crossing above the overbought threshold may indicate strong confidence in the move and price will continue to rise.
During a Bearish Trend , price crossing below the oversold threshold may indicate strong confidence in the move and price will continue to fall.
The first option is a modified CCI indicator that uses the "Arnaud Legoux Moving Average" instead of the SMA, and the source uses the VWAP instead of the HLC3. Added to this version an option to calculate CCI with different types of moving averages:
Green dots mean they are overbought
Orange dots mean they are oversold
Added a "SuperTrend Background" based on the modified CCI indicator:
Bull event = CCI crossing over the 0 line
Bear event = CCI crossing below the 0 line
Added a signal as EMA (modified CCI, signal length)
The second option is a standard CCI indicator that shows a coloured histogram of important levels, giving a good visual of the CCI levels. Added to this version is an extra coloured level +/-200 and an option to use Traditional CCI calculations according to user @JustUncleL
LEVELS:
Aqua: Greater than 200.
Lavender: Greater than 100 and less than 200.
Dark Lavender: Greater than 0 and less than 100.
Dark Coral: Less than 0 and greater than -100.
Coral: Less than -100 and greater than -200.
Light Red: Less than -200.
[blackcat] L1 Tether LineLevel: 1
Background
Omega Research proposed Tether line in June 2000. I utilized it in fast-slow line form to follow trend.
Function
Due it can provides good support and resistance, using it as "moving average" fast-slow line form can provide very stable golden cross and dead cross signal.
You can adjust parameters to fit for your trading pair and use it and compare it with Supertrend indicator.
Key Signal
Tether_fast --> Tether Fast Line.
Tether_slow --> Tether Slow Line.
Remarks
This is a Level 1 free and open source indicator.
Feedbacks are appreciated.

3x SuperTrend IndicatorSimplified version of SuperTrend Indicator which plots up to 3 lines at once. Script is mainly for users of free TradingView version.


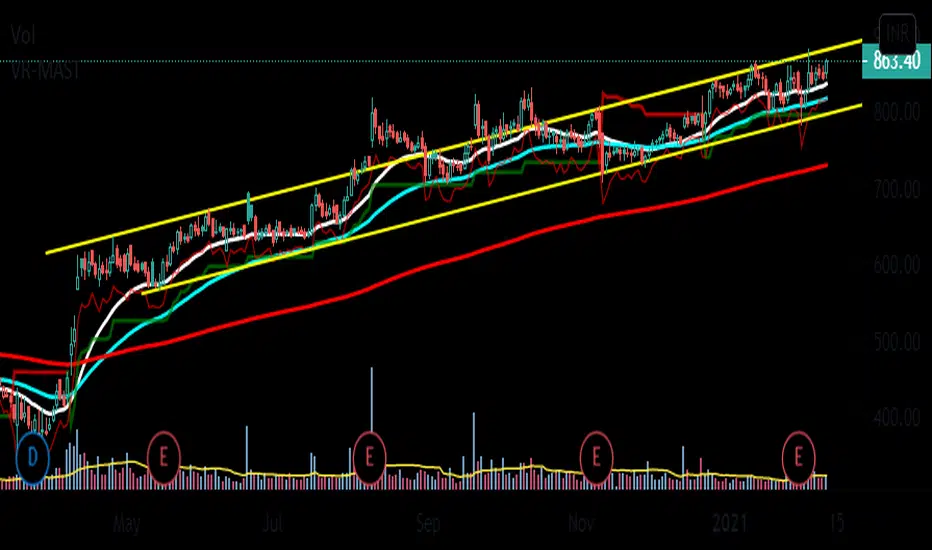
VR-MASTThis is a my script for a super simple trading strategy - ZEST.
Identify Zone of Value, Enter on pullback, place proper Stop Loss and set achievable Targets.
So, to identify Zone of Value, I have EMA in my script.
20EMA generally acts as a dynamic Support/Resistance zone.
For Buy Stop Loss, we have 1ATR below Swing Low.
Then, we have SuperTrend for Trailing Stop Loss.
[THETA] Tema Hema Evwma Trade ActionTHETA
Is an Intraday Strategy Indicator, To be used over 1 minute chart and in conjunction with built in pine indicator Pivot Point Standard, {Fibonacci One}
I came across this Strategy Indicator while reading through the Forex Trading Journals, and thought of sharing you guys
The Indicator Comprises of amalgamation of
TEMA : Triple Exponential Moving Average
HMA : Hulls Moving Average
EVWMA and EMA: Elastic Volume weighted Moving Average and Exponential Moving Average
Filter Action by Rajandran R Supertrend
So
Theta = ( tema(src, length) + hma(src, length) + ema(src, length) + evwma(src, length) )/4
The lengths in use are: 8,21,34,55,89,144,233,610
How to Use
Use on 1 min chart for best results
UsE in Conjuction with Fibonacci Pivot Points, (.which is present in option of built in pine indicator : Pivot Point Standard )
Provision For Alert
Long theta Signal
Short theta Signal
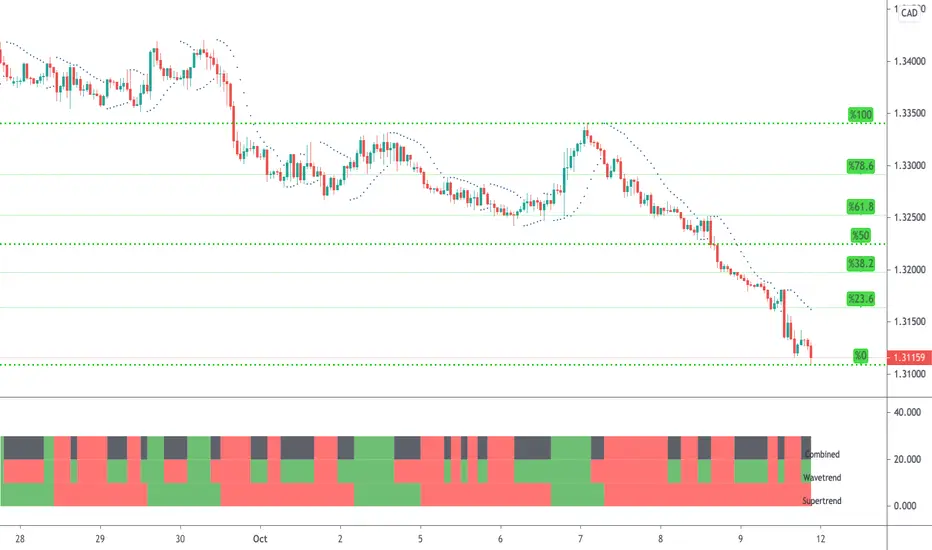
WaveTrend & Supertrend Comparison/CombinedThis compares two reasonably reliable strategies and shows where they are in agreement.
When the top line is GREEN - Then consider BUYing
When the top line is RED - Then consider SELLing
There are also alerts available.
Multi StrategyDuring the course of a trade, we can find ourselves changing strategies depending on the market. Instead of using many different templates, I have a simple indicator that clearly says "Buy", "Sell" or "Stay Out". The great thing about this approach, is we instantly observe the majority are in agreement and that decides which way to place our trade.
This indicator includes the following strategies:
- QQE
- Ichimoku using much faster settings.
- Parabolic SAR
- Supertrend
- TTM Oscillator
- The Squeeze strategy
- The Alligator Strategy
Using this indicator is simple, if the lines are mainly green then buy, if mainly red then sell OR don't trade. So...
Green Line - This strategy is in a buy position
Orange or Black Line - This strategy is undecided
Red Line - This strategy is in a sell position
There are also some green and red circles for reference that appear showing when that bar has broken through the Ichimoku cloud.
The trader's approach is simple, when all indicators are green or red, then take the trade. As soon as one indicator changes, then re-evaluate using your normal process, such as price action, to determine whether to close the trade or continue.
I can customise this further or add other strategies, please message me.

Smoothened SuperTrendHere I have tried to further improve supertrend
Tested on 15 mins charts only
Signals won't repaint but so far, I can't figure out stoploss
so to start with, keep SL as LL of 2-3 candles preceding buy and vice versa for sell

Trends & RangesTrends & Ranges uses EMA ATR bands as a SuperTrend indicator.
How to use:
This indicator can be used to give you a direction bias, with the added function to create ranges which often lead to reversals or flat trading periods. Trade the break-out or wait for pull backs in the direction of the trend.
I'm not great at explaining stuff and will probably make things only more complicated, so I won't bother for now,
but if you have a question on how the script works I will gladly give it a try.
The option "Flexible Trends" will disable the min/max function (trailing or non trailing).
Flexible Trends enabled:
Flexible Trends disabled:
Settings are not optimized for any asset or time frame, you will have to do that for yourself. Feel free to share them in the comments.
Thanks for showing interest, enjoy and good luck! :)

SuperTrailThe SuperTrail indicator is similar to the very popular and widely used SuperTrend but it has been improved to use a percentage value instead that helps users to determine the natural trading range of a stock over a period of time, and set stop losses (especially trailing stops) accordingly.
The best way to use it is to find stocks in a steady trend (upwards if you are going long or downwards if you are going short) and keep changing the indicator percentage levels until you identify a percentage that keeps you in the trade for longer without getting stopped out too often. You can then set this value in your trading program, or set an alert within Trading View to notify you if something changes and you need to take an action.
Some stocks might have little volatility and only require an 8% trail. Some might be more volatile and work better with a wider 20% trail. It also depends on your time frame. Shorter time frames are typically shorter stops. Longer time frames work better with wider stop values. The best thing about this tool is that it helps you identify the best optimised stop loss range to set for each individual stock based on its range.
The indicator works on any time frame - minutes to hours to weeks. If you want to hold stocks for a shorter time you might look at the natural range over the last 7 days, medium term the range over the last 3 months, or if you want to hold a stock for a much longer period of time then perhaps look to identify the range over the last 12 months. If you get stopped out of a stock you like, then set an alert, and when the stock moves back up within its range you can decide on whether or not you re-enter.
It is a super simple indicator. As always it is meant only as a visual guide to assist you with your trading and you will get better results by combining it with another indicator like an OBV or RSI. You can check out my Trading View channel to see how I have used it across different stocks and based it on different time periods.
I have also made and uploaded a video to my Trading View account showing how it works and how I use it.
Message me if you would like access.
