CPR with MAs, Super Trend & VWAP by MackraniThis script will allow to add CPR with Standard Pivots and 4 Indicators.
Standard Pivot has 9 levels of support and 9 levels of resistance lines. It has CPR , 3 levels of Day-wise pivots , 3 levels of Weekly pivots and 3 Levels of Monthly Pivots .
In Addition to the CPR and Pivot , this script will allow user to Add 4 more Indicators - SMA , EMA , VWAP and SuperTrend as well.
All the Support and resistance levels can be enabled / disabled from settings. It will allow to select multiple combinations of support and resistance levels across 3 levels at any of the 3 time-frames individually and combined.
All 4 Indicators can be can be enabled / disabled from settings. This will allow the indicators to be plotted individually and combined along with any combination of CPR & Pivots .
These number of combinations will allow user to visualize the charts with desired indicators, pivot support & resistance levels on all or any of the 3 time frames.
For Ease of access, listed few points on how the script works..
- CPR and day-wise level 1 & 2 (S1 & R1) enabled by default and can be changed from settings
- Day-wise Level 2 & 3 (S2, R2, S3 & L3) can be enabled from settings
- Weekly 3 levels and Monthly 3 levels can be enabled from settings
- CPR & pivot levels colored in blue lines
- All support levels colored in Green
- All resistance levels Colored in Red
- Day-wise pivot , support & resistance are straight lines
- Weekly pivot , support & resistance are cross (+) lines
- Weekly pivot , support & resistance are circle (o) lines
- SMA , EMA , VWAP and SuperTrend Enabled by Default
- SMA Colored in Orange
- EMA Colored in Red
- EMA Colored in Teal
- SuperTrend Colored in standard Red & Green with triangle arrows
- Any combinations can be selected from settings-> Inputs & style
Pesquisar nos scripts por "supertrend"

QuantBot 2: Reverse Supertrend This is the 2nd indicator from QuantBot
This indicator basically checks multi timeframe supertrend and When the smaller timeframe supertrend is bearish while the higher timeframe supertrend is bullish it gives BUY signal and vice versa.
This is good for finding suitable entries in the direction of trend.
To get the access please text me in the chatbox, ACCESS is given for FREE.
This is purely for charting purpose, if you find it useful please let me know in the comment box below.
If you want me to code any particular strategy please mention this in the comment box.

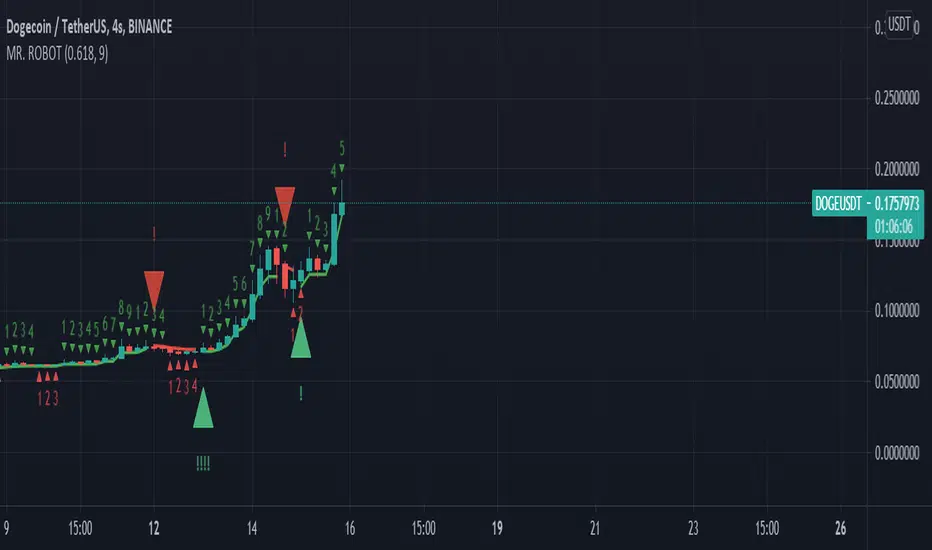
MR. ROBOT v.1.0.0This script consists of a logical blend of TD Sequental, MACD and Stochastic RSI based on the Supertrend function. In addition, these indicators use the golden proportional point of each candle as a source.
The exclamations on the signal indicating signs express the strength of the signal and consist of four levels;
! : Weak level signal
!! : Partial level signal
!!! : Medium signal
!!!! : High level signal
The fact that these interjections refer to four different levels is related to the programmatic consideration of four different indicators and functions. Since the script is based on four different indicators
basically, the exclamation numbers of the signals are related to how many indicators are signaling at the same time. However, it does not always overlap. For example, when 3 indicators signal at the same time, 3 exclamation points may not appear on the signal sign. This is because the script also takes into account special bar algorithms.
The only setting that you can intervene on the script - for now - is the multiplier and length values of the supertrend function. Changing these settings changes the signal strengths and frequencies. The script is based on the supertrend function alone, it is the ability to follow the trend after the signals given by the internal indicators. This situation decreases the rate of false signals and frequent signals in internal indicators.
This script or its author is not responsible in any way for any profits or losses arising from transactions. Does not contain investment advice.
Super SSLSuper SSL Indicator.
SSL + SuperTrend signal filtering.
Signals are delivered by SSL, signals are then filtered out by SuperTrend, in the nnfx way of trading (C1 = SSL, C2 = ST).
SSL deliver signals. Supertrend filter them.
Included 1CR rule option : in the nnfx way, we allow C2 to agree 1 candle later.
Some configuration settings of this tool pass the VP's 5 benchmark (can't be used to pass the private group admission though).

CPR with SMA, EMA, VWAP & Super Trend by GuruprasadMeduriThis script will allow to add CPR with Standard Pivots and 4 Indicators.
Standard Pivot has 9 levels of support and 9 levels of resistance lines. It has CPR , 3 levels of Day-wise pivots , 3 levels of Weekly pivots and 3 Levels of Monthly Pivots .
In Addition to the CPR and Pivot, this script will allow user to Add 4 more Indicators - SMA, EMA, VWAP and SuperTrend as well.
All the Support and resistance levels can be enabled / disabled from settings. It will allow to select multiple combinations of support and resistance levels across 3 levels at any of the 3 time-frames individually and combined.
All 4 Indicators can be can be enabled / disabled from settings. This will allow the indicators to be plotted individually and combined along with any combination of CPR & Pivots.
These number of combinations will allow user to visualize the charts with desired indicators, pivot support & resistance levels on all or any of the 3 time frames.
For Ease of access, listed few points on how the script works..
- CPR and day-wise level 1 & 2 (S1 & R1) enabled by default and can be changed from settings
- Day-wise Level 2 & 3 (S2, R2, S3 & L3) can be enabled from settings
- Weekly 3 levels and Monthly 3 levels can be enabled from settings
- CPR & pivot levels colored in blue lines
- All support levels colored in Green
- All resistance levels Colored in Red
- Day-wise pivot , support & resistance are straight lines
- Weekly pivot , support & resistance are cross (+) lines
- Weekly pivot , support & resistance are circle (o) lines
- SMA, EMA, VWAP and SuperTrend Enabled by Default
- SMA Colored in Orange
- EMA Colored in Red
- EMA Colored in Teal
- SuperTrend Colored in standard Red & Green with triangle arrows
- Any combinations can be selected from settings-> Inputs & style

nTrend ULTIMATEHello traders
With this fabulous script, you can color the candles based on the indicator and timeframe you want
You can only apply one indicator at a given time obviously
The list of indicators are the following:
- Price vs Moving Average : if price is above, bullish color, if price is below, bearish color
- Trend Signal : if the Trend signal is pointing upwards, bullish color, if the Trend signal is point downwards, bearish color
- Supertrend : if supertrend is below the price, bullish color, if supertrend is above the price, bearish color
- MACD : if MACD is positive, bullish color, if MACD is negative, bearish color
- MACD ZERO LAG : if MACD ZERO LAG is positive, bullish color, if MACD ZERO LAG is negative, bearish color
- MM Cross : if MM cross is bullish , bullish color, if MM cross is bearish , bearish color
- Ichimoku: if price is above the cloud, bullish color, if price is below the cloud, bearish color
Hope you'll like it
Please feel free to comment to ask me to add any other indicator you like or simply to say how much you love it.
Positive vibes are always appreciated and will encourage me to give you more free content.
Dave

High Aggregate Supertrend [jwammo12]This script adds an aggregate input to Supertrend to provide a Supertrend that approximates a higher time frame, but updates on the current time frame and therefore is more responsive.
The aggregate input acts as a multiplier on the current time frame, so an aggregate of 4 on a 1h chart would approximate a supertrend with the same parameters on a 4h chart by aggregating the last 4 bars into one bar.

EMA 7/21 + SuperTrend DEFINITIVOhe Ultimate 7/21 Signal: Trend-Filtered by Supertrend 🚀Tired of signals that trade against the main trend? This powerful indicator features the 7/21 EMA Crossover as its core signal, but with a massive upgrade in confirmation:Trend Alignment: Only signals that move in the direction of the Supertrend are confirmed, drastically reducing false entries.Momentum Filter: The ADX DI ensures the move has directional strength.Conviction Check: A Volume Filter validates the signal with market participation.This multi-stage filter provides clean, high-conviction signals for the $7/21$ strategy. The intuitive Informative Panel clearly shows when all conditions are met for a BUY or SELL.Trade with the trend. Trade with conviction.

EMA Crossover with Supertrend + Ribbon + Multi TFThis is a multi indicator all in one, incorporates several indicators in one. Stay on the right side of the trend with this indicator, has customizable everything, a fast and slow ema ribbon, a second ema ribbon for longer ema lengths, a customizable multi time frame trend table, a customizable supertrend, the vwap, 2 background trend color changes , one for the ema's and one for the supertrend, daily support and resistance lines, follow up bearish or bullish signals on every candle. I am sure you will be able to find this multi indicator very useful!

Brahmastra with SMC by PoojaSummary
This indicator provides a structured trend-and-momentum workflow that issues Partial and Confirmed trade signals using a combination of trend filters, momentum confirmation, and structure breaks.
It helps traders identify higher-probability trade locations through multi-timeframe confirmation and automatic alert payloads — while keeping the underlying signal logic private (invite-only).
Core Components (high level overview — no source code revealed)
• Trend Filters: EMA (configurable length), VWAP, and Supertrend are used to define overall trend direction and to gate signals.
• Momentum: RSI (configurable length and upper/lower thresholds) helps confirm momentum and optional divergence blocking.
• Market Structure: BOS / CHoCH (Break of Structure / Change of Character) logic with MTF pivots to detect structure-based opportunities.
• Signal Types: Partial signals appear early as potential setups; Confirmed signals meet stricter multi-factor conditions (EMA/VWAP/Supertrend + RSI + optional MTF).
• Repaint Safety: Non-repaint mode available (triggers only after candle close).
• Alerts: Built-in alert messages with optional JSON webhook format.
• Customization: Flexible inputs for sessions, pivots, labels, colors, lookbacks, and MTF parameters to adapt across multiple timeframes.
How to Interpret Signals
• Treat Partial signals as setups to monitor — not instant entries. Wait for confirmation or confluence from price behavior.
• Treat Confirmed signals as higher-probability opportunities that satisfy trend and momentum alignment.
• Enable MTF confirmation selectively on smaller timeframes (e.g., 5m using 15m/1H confirmation).
• Use Non-repaint mode (trigger only after candle close) for safe alert generation.
Limitations & Risk Notice
This indicator does not guarantee profits or accuracy. It is a technical and educational tool meant to assist analysis.
All trading decisions, entries, and exits are the sole responsibility of the user. Always perform backtesting and paper trading before live use.
This is not financial advice.
Version Note & Support
This is a closed invite-only script. The indicator includes configuration options for labels, alerts, and MTF pivots.
For approved users seeking modifications or usage details, please contact the author (see Author’s Instructions section).

Close vs SuperTrend % DiffOn Every Bar: SuperTrend and percent_diff are recalculated; the line plot updates with coloring.
On Visible Bars Only: High/low extremes and sums/counts accumulate via VC checks.
On Last Bar: Table refreshes with current stats, reflecting the visible view.
User Interaction: Zooming/panning triggers VC.barIsVisible() to recompute aggregates dynamically—no full history scan needed.
Edge Cases:
Empty visible range: High/low default to na; averages guarded against zero counts.
Division by zero in percent_diff: Unlikely, as st is ATR-based and rarely zero, but Pine handles na gracefully.
Performance: Efficient for long histories (e.g., daily charts over years) since stats are view-localized.
This indicator is useful for trend traders: Watch for percent_diff crossing zero for signals, and use the table to gauge visible volatility (e.g., if avg high > avg low in magnitude, bullish bias). Customize SuperTrend params (3,10) for different assets/timeframes. To extend, you could add alerts on threshold crosses or integrate dir for trend filters.

Hello Crypto! Modern Combo Snapshot
Unified long/short analyzer blending EMA structure, SuperTrend, WaveTrend, QQE, and volume pressure.
Background shading flags “watch” and “ready” states; optional long/short modules let you focus on one side.
Alerts fire when every checklist item aligns, while the side-panel table summarizes trend, momentum, liquidity, and overall score in real time.
Indicator → Trend Analysis
Indicator → Momentum Oscillators
Indicator → Volume Indicators
Tags:
cryptocurrency, bitcoin, altcoins, trend-following, momentum, volume, ema, supertrend, intraday, swing-trading, alerts, checklist, trading-strategy, risk-management

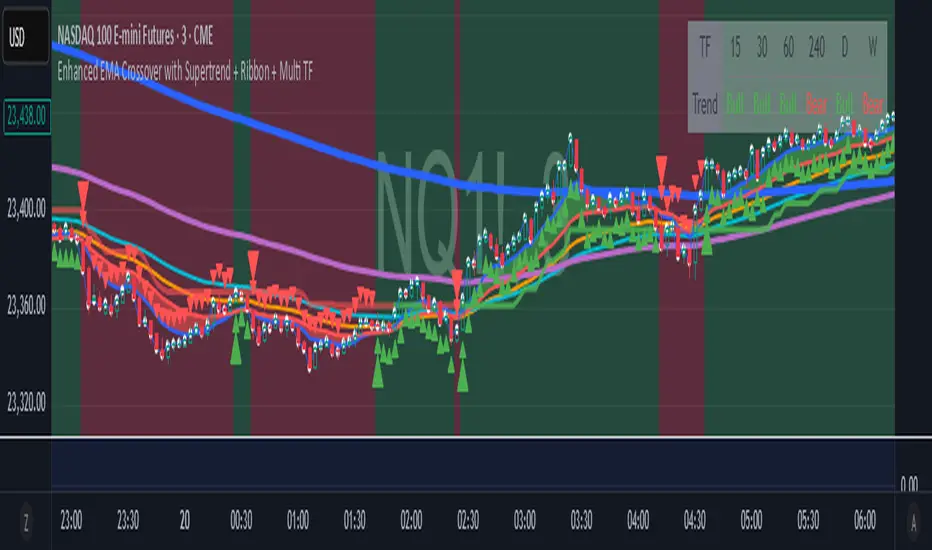
Enhanced EMA Crossover with Supertrend + Ribbon + Multi TFThe indicator has 4 core indicators in 1, the supertrend, the 2ema crossover, the moving average ribbon and a multi-timeframe trend indicator. I have modified the code for better visuals, all the indicators are fully customizable for better visuals and trend identification. Specially the 2 ema crossover indicator ribbon should guide you in the direction of the overall trend in different timeframes. The white dots were added to the real price close on everu candle , it is very usefull visually to see exactly where the price is closing specially when using heiken ashi candles. The small arrows on every candle should guide you in the direction of the overall trend when adjusting the 2 ema crossover lengths, the bigger arrow plots on the first candle only when the 2 ema crossover happens to either direction, using the supertrend indicator with the moving averages will also help you keep in the right trend direction.
FxSika SuperTrend ZoneThe FxSika SuperTrend Zone™ is a dynamic zone-based indicator that enhances the traditional SuperTrend concept by displaying two key structural layers:
Primary Trend Line: The main directional guide, calculated using ATR and a volatility multiplier.
Reaction Band: A secondary buffer area around the trend line, derived from an ATR extension. It helps visualize zones where price is likely to react or pause during pullbacks.
The indicator also includes an optional Long-Term Trend Layer, calculated with higher values for both ATR length and multiplier. This broader trend context can be toggled on or off via the settings.
How it works:
Zones adjust automatically based on trend direction.
Green zones represent bearish conditions (potential buy interest).
Red zones represent bullish conditions (potential sell interest).
Clear lines and shaded areas make key levels easy to spot.
Extra features:
Multiple alert options for zone interactions and trend shifts.
Lightweight, visually clean design for easy chart integration.
Fully adjustable parameters for ATR, multiplier, and zone width.
This indicator helps identify high-probability reaction zones during trending markets, especially when combined with price action or confirmation-based setups.

DIY Custom Strategy Builder [ZP] - v1DISCLAIMER:
This indicator as my first ever Tradingview indicator, has been developed for my personal trading analysis, consolidating various powerful indicators that I frequently use. A number of the embedded indicators within this tool are the creations of esteemed Pine Script developers from the TradingView community. In recognition of their contributions, the names of these developers will be prominently displayed alongside the respective indicator names. My selection of these indicators is rooted in my own experience and reflects those that have proven most effective for me. Please note that the past performance of any trading system or methodology is not necessarily indicative of future results. Always conduct your own research and due diligence before using any indicator or tool.
===========================================================================
Introducing the ultimate all-in-one DIY strategy builder indicator, With over 30+ famous indicators (some with custom configuration/settings) indicators included, you now have the power to mix and match to create your own custom strategy for shorter time or longer time frames depending on your trading style. Say goodbye to cluttered charts and manual/visual confirmation of multiple indicators and hello to endless possibilities with this indicator.
What it does
==================
This indicator basically help users to do 2 things:
1) Strategy Builder
With more than 30 indicators available, you can select any combination you prefer and the indicator will generate buy and sell signals accordingly. Alternative to the time-consuming process of manually confirming signals from multiple indicators! This indicator streamlines the process by automatically printing buy and sell signals based on your chosen combination of indicators. No more staring at the screen for hours on end, simply set up alerts and let the indicator do the work for you.
Available indicators that you can choose to build your strategy, are coded to seamlessly print the BUY and SELL signal upon confirmation of all selected indicators:
EMA Filter
2 EMA Cross
3 EMA Cross
Range Filter (Guikroth)
SuperTrend
Ichimoku Cloud
SuperIchi (LuxAlgo)
B-Xtrender (QuantTherapy)
Bull Bear Power Trend (Dreadblitz)
VWAP
BB Oscillator (Veryfid)
Trend Meter (Lij_MC)
Chandelier Exit (Everget)
CCI
Awesome Oscillator
DMI ( Adx )
Parabolic SAR
Waddah Attar Explosion (Shayankm)
Volatility Oscillator (Veryfid)
Damiani Volatility ( DV ) (RichardoSantos)
Stochastic
RSI
MACD
SSL Channel (ErwinBeckers)
Schaff Trend Cycle ( STC ) (LazyBear)
Chaikin Money Flow
Volume
Wolfpack Id (Darrellfischer1)
QQE Mod (Mihkhel00)
Hull Suite (Insilico)
Vortex Indicator
2) Overlay Indicators
Access the full potential of this indicator using the SWITCH BOARD section! Here, you have the ability to turn on and plot up to 14 of the included indicators on your chart. Simply select from the following options:
EMA
Support/Resistance (HeWhoMustNotBeNamed)
Supply/ Demand Zone ( SMC ) (Pmgjiv)
Parabolic SAR
Ichimoku Cloud
Superichi (LuxAlgo)
SuperTrend
Range Filter (Guikroth)
Average True Range (ATR)
VWAP
Schaff Trend Cycle ( STC ) (LazyBear)
PVSRA (TradersReality)
Liquidity Zone/Vector Candle Zone (TradersReality)
Market Sessions (Aurocks_AIF)
How it does it
==================
To explain how this indictor generate signal or does what it does, its best to put in points.
I have coded the strategy for each of the indicator, for some of the indicator you will see the option to choose strategy variation, these variants are either famous among the traders or its the ones I found more accurate based on my usage. By coding the strategy I will have the BUY and SELL signal generated by each indicator in the backend.
Next, the indicator will identify your selected LEADING INDICATOR and the CONFIRMATION INDICATOR(s).
On each candle close, the indicator will check if the selected LEADING INDICATOR generates signal (long or short).
Once the leading indicator generates the signal, then the indicator will scan each of the selected CONFIRMATION INDICATORS on candle close to check if any of the CONFIRMATION INDICATOR generated signal (long or short).
Until this point, all the process is happening in the backend, the indicator will print LONG or SHORT signal on the chart ONLY if LEADING INDICATOR and all the selected CONFIRMATION INDICATORS generates signal on candle close. example for long signal, the LEADING INDICATOR and all selected CONFIRMATION INDICATORS must print long signal.
The dashboard table will show your selected LEADING and CONFIRMATION INDICATORS and if LEADING or the CONFIRMATION INDICATORS have generated signal. Signal generated by LEADING and CONFIRMATION indicator whether long or short, is indicated by tick icon ✔. and if any of the selected CONFIRMATION or LEADING indicator does not generate signal on candle close, it will be indicated with cross symbol ✖.
how to use this indicator
==============================
Using the indicator is pretty simple, but it depends on your goal, whether you want to use it for overlaying the available indicators or using it to build your strategy or for both.
To use for Building your strategy: Select your LEADING INDICATOR, and then select your CONFIRMATION INDICATOR(s). if on candle close all the indicators generate signal, then this indicator will print SHORT or LONG signal on the chart for your entry. There are plenty of indicators you can use to build your strategy, some indicators are best for longer time frame setups while others are responsive indicators that are best for short time frame.
To use for overlaying the indicators: Open the setting of this indicator and scroll to the SWITCHBOARD section, from there you can select which indicator you want to plot on the chart.
For each of the listed indicators, you have the flexibility to customize the settings and configurations to suit your preferences. simply open indicator setting and scroll down, you will find configuration for each of the indicators used.
I will also release the Strategy Backtester for this indicator soon.

Bearish Market Indicator V2Definition
Have you ever wonder whether if the stock/index/market is "bearish" ? A Bearish Market Indicator (B.M.I) is not a new concept, the definition is simply 20% lower from the recent (term: short-term, recent: usually within a year, a.k.a 1 year) highs (closing price with in the recent period or within in a year or simply a 52-Week High). It is called “bearish” by definition when the closing price is below 20% from the highest price within the year (52-Week high: Green Line). To visualize the “20%” below the recent highs, there is a plot (line: light yellow color in the middle) called a Bearish Market By Definition Value. For example, the SPX 500 has been in a bearish market which is why there is a purple color highlight over the 52-Week High (green line) since September 21, 2022 because the closing price is below the Bearish Market By Definition Value (light yellow color) or “20% below the recent highs”. Finally, there is a red line under in the graph and it is the lowest price within a year. So when you hear, “this ticker is at a 52-Week Low”, you know what it means.
Line Summary:
Green Color Line = 52-Week High
Yellow Color Line = 20% away from the 52-Week High or Bearish Market By Definition Value
Red Color Line = 52-Week Low
Color Summary:
Red Color = Bad
Saturated Red Color = Very Bad
Purple Color = Bearish (It may look pink: red + purple)
White Color = Less Bad (That’s because there is no certainty only probability)
Green Color = Not too Bad (That’s because there is no certainty only probability)
Now to more complicated Metrics
>> If you do not like the technical indicators, go to the indicator settings, uncheck the tables. Otherwise, please continue reading. <<
Pre-requisites
+ Understand that the indicators are lagging indicators.
+ Using it under “D” or “Day” interval
+ Already Understand: Moving Averages, Stochastic-RSI, RSI, Super Trend and MACD.
+ Please be aware that this might not be compatible with traders!
Indicators
This B.M.I is fused (comprised, combined) with multiple indicators:
- Moving Averages
I would not rely just on the Moving Averages (MA) since it is a lagging indicator. The values are derived by finding the differences with respect to the MAs (between the closing price and with the respect MA).
- Stochastic-RSI
Stochastic and RSI combo with RSI-Color coating. The first value is the rsi-stochastic-k followed by the rsi-stochastic-d both are compartmentalized with “|”.
Parameter:
Numbers > 80 Not Good
Numbers < 20 Is it time? (You can manually verify the lines (k, d) or the values from them)
- Relative Strength Index (RSI)
The first value is the rsi followed by the rsi-ma both are compartmentalized with “|”. It is also coated with RSI-color.
Parameter:
Numbers > 70 Overbought | Color Red
If the RSI > RSI’s MA = Green
If the RSI < RSI’s MA = Red
Numbers < 30 Oversold | Color Red
- Moving Averages Convergence Divergence (MACD)
The first value is the MACD-line followed by the signal-line both are compartmentalized with “|”.
Macd-line > signal line = green
Macd-line < signal line = red
- Supertrend (please look up from the documentation; i can not embed the link)
Think of this way, you’re riding a wave. If the wave is climbing, expect the price to follow.
Direction < 0 = Green
Direction > 0 = Red
- Other Trend similar to supertrend
This is similar to the Super Trend according the some. Imagine you’re drawing a trend line manually within 6 months.
Within the period, the line gets smoothed over and over til the n=9.
> If the closing is less than the 9th value, it implies the trend is slowing down.
Usage
Adjustments
+ Since there are different holidays from different countries, you can change the BMI-Period from the indicator settings “BMI-4khansolo”.
+ You can hide Technical Indicator Tables, it is also under the settings (see above).
> This will show red over the 52-Week high if it tests for positive .
Purpose
Do you like eating the same food over and over? No! I love different food! I also love a variety of indicators. Especially, I love having MULTIPLE indicators presented in one canvas at the same time (personalized).
After spending a lot of time, I want to share my “FOOD” which is made of different ingredients (indicators) with someone who appreciates food! This Makes me a chef isn't it? Yes! Chef!
Questions?
If you have questions or spotted errors, please comment them below so that I can improve.
Sources
All the materials (i.e., functions like ta.rsi, etc...) used in here are available in the platform.
All the references or sources materials are commented with the code since the I am not allowed to put them here.

Double RSI TrendThis is my Double RSI Trend Indicator. It issues Buy and Sell signals based on the Supertrend and a double RSI . The RSIs cross near or at the same time as the Supertrend fires. It has the ability to change if you want signals based on the RSI cross on the same candle, one candle before, and two candles before. I find this one extremely good at catching reversals as long as you filter out some of the signals based on trend.

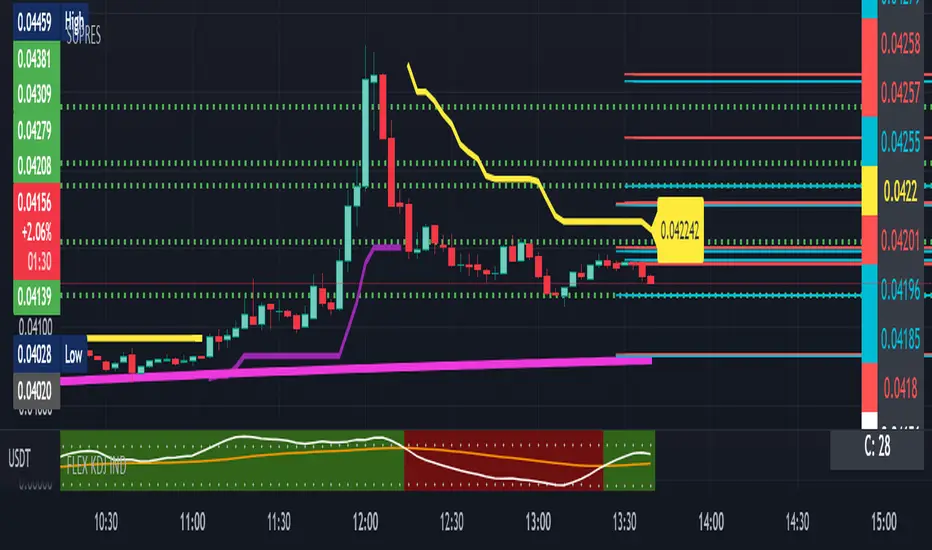
SUPRESHi Dears!
I hope that you enjoyed my "FLEX KDJ IND" till today!
Here, I want to publish one of my other golden indicators for you!
Contents:
+ SUPRES
+ SUPERTREND
+ T.O Line
- SUPRES (SUPPORT/RESISTANCE) is sensitive to trading volumes and with "BACHWARD" you can adjust the length of previous indices in investigation and "MEMORY" is an argument for calling maximum lines that have to be kept for "SUPPORT" and "RESIST".
- SUPERTREND is the normal prepared indicator which is defined in "TRADING VIEW"
-T.O is my suggestion instead of "EMA" to check the phase of session.
I hope that you enjoy this Indicator, please do not forgot to "Warm-It-UP"!
Happy trading,
Shakib
Short Volume Weighted Trend Band VTrendThe Short Volume Weighted Trend band, combined with the custom supertrend and barcolor, which changes according to price going above or below the bollinger band basis line. Is designed for you to identify the high time frame trend, and take short to long term entries.
The short volume band in green, acts as dynamic support and resistance, and price respects this quite well. I find it great for taking entries off and placing stops below or above depending on the position being taken.
It really helps identify when price is actually changing trend. The barcolor change assists in acting as confluence for this.
Included is a custom supertrend, which is better at 1h timeframe an above. And daily open levels only, as i find the daily key to take trades off when i am scalping on an intraday basis.
The reversal calculations are based off candle close types, these are 'R' either in black or red. The difference in black and red is a type only, and means no significance between the two.
Timeframes I like using on this script, 2H, 1H, 30min, 25min, 15min

[Sextan] Supertrend - Ladder ATR BacktestLevel: 1
NOTE: This is a request by @upslidedown to backtest Supertrend - Ladder ATR by HeWhoMustNotBeNamed with my Sextan framework. You can backtest many of my indicators in minutes now! Of course,you can define your own indicator in the highlighted area in compliance with the uniform format, which guarantee when you use "Indicator on Indicator" function, it would not produce any error.
Courtesy of HeWhoMustNotBeNamed for his Supertrend - Ladder ATR indicator
Background
Backtesting of technical indicators and strategies is the most common way to understand a quantitative strategy. However, the complicated configuration and adaptation work of backtesting many quantitative tools makes many traders who do not understand the code daunted. Moreover, although I have written a lot of strategies, I am still not very satisfied with the backtest configuration and writing efficiency. Therefore, I have been thinking about how to build a backtesting framework that can quickly and easily evaluate the backtesting performance of any indicator with a "long/short entry" indicator, that is, a "simple backtesting tool for dummies". The performance requirements should be stable, and the operation should be simple and convenient. It is best to "copy", "paste", and "a few mouse clicks" to complete the quick backtest and evaluation of a new indicator.
Luckily, I recently realized that TradingView provides an "Indicator on Indicator" feature, which is the perfect foundation for doing "hot swap" backtesting. My basic idea is to use a two-layer design. The first layer is the technical indicator signal source that needs to be embedded, which is only used to provide buy and sell signals of custom strategies; the second layer is the trading system, which is used to receive the output signals of the first layer, and filter the signals according to the agreed specifications. , Take Profit, Stop Loss, draw buy and sell signals and cost lines, define and send custom buy and sell alert messages to mobile phones, social software or trading interfaces. In general, this two-layer design is a flexible combination of "death and alive", which can meet the needs of most traders to quickly evaluate the performance of a certain technical indicator. The first layer here is flexible. Users can insert their own strategy codes according to my template, and they can draw buy and sell signals and output them to the second layer. The second layer is fixed, and the overall framework is solidified to ensure the stability and unity of the trading system. It is convenient to compare different or similar strategies under the same conditions. Finally, all trading signals are drawn on the chart, and the output strategy returns. test report.
The main function:
The first layer: "{Sextan} Your Indicator Source", the script provides a template for personalized strategy input, and the signal and definition interfaces ensure full compatibility with the second layer. Backtesting is performed stably in the backtesting framework of the layer. The first layer of this script is also relatively simple: enter your script in the highlighted custom script area, and after ensuring the final buy and sell signals long = bool condition, short = bool condition, the design of the first layer is considered complete. Input it into the PINE script editor of TradingView, save it and add it to the chart, you can see the pulse sequence in yellow (buy) and purple (sell) on the sub-picture, corresponding to the main picture, you can subjectively judge that the quality of the trading point of the strategy is good Bad.
The second layer: "{Sextan} PINEv4 Sextans Backtest Framework". This script is the standardized trading system strategy execution and alarm, used to generate the final report of the strategy backtest and some key indicators that I have customized that I find useful, such as: winning rate , Odds, Winning Surface, Kelly Ratio, Take Profit and Stop Loss Thresholds, Trading Frequency, etc. are evaluated according to the Kelly formula. To use the second layer, first load it into the TrainingView chart, no markers will appear on the chart, since you have not specified any strategy source signals, click on the gear-shaped setting next to the "{Sextan} PINEv4 Sextans BTFW" header button, you can open the backtest settings, the first item is to select your custom strategy source. Because we have added the strategy source to the chart in the previous step, you can easily find an option "{Sextan} Your Indicator Source: Signal" at the bottom of the list, this is the strategy source input we need, select and confirm , you can see various markers on the main graph, and quickly generate a backtesting profit graph and a list of backtesting reports. You can generate files and download the backtesting reports locally. You can also click the gear on the backtest chart interface to customize some conditions of the backtest, including: initial capital amount, currency type, percentage of each order placed, amount of pyramid additions, commission fees, slippage, etc. configuration. Note: The configuration in the interface dialog overrides the same configuration implemented by the code in the backtest script.
How to output charts:
The first layer: "{Sextan} Your Indicator Source", the output of this script is the pulse value of yellow and purple, yellow +1 means buy, purple -1 means sell.
The second layer: PINEv4 Sextans Backtest Framework". The output of this script is a bit complicated. After all, it is the entire trading system with a lot of information:
1. Blue and red arrows. The blue upward arrow indicates long position, the red downward arrow indicates short position, and the horizontal bar at the end of the purple arrow indicates take profit or stop loss exit.
2. Red and green lines. This is the holding cost line of the strategy, green represents the cost of holding a long position, and red represents the cost of holding a short position. The cost line is a continuous solid line and the price action is relatively close.
3. Green and yellow long take profit and stop loss area and green and yellow long take profit and stop loss fork. Once a long position is held, there is a conditional order for take profit and stop loss. The green horizontal line is the long take profit ratio line, and the yellow is the long stop loss ratio line; the green cross indicates the long take profit price, and the yellow cross indicates the long position. Stop loss price. It's worth noting that the prongs and wires don't necessarily go together. Because of the optimization of the algorithm, for a strong market, the take profit will occur after breaking the take profit line, and the profit will not be taken until the price falls.
4. The purple and red short take profit and stop loss area and the purple red short stop loss fork. Once a short position is held, there will be a take profit and stop loss conditional order, the red is the short take profit ratio line, and the purple is the short stop loss ratio line; the red cross indicates the short take profit price, and the purple cross indicates the short stop loss price.
5. In addition to the above signs, there are also text and numbers indicating the profit and loss values of long and short positions. "L" means long; "S" means short; "XL" means close long; "XS" means close short.
TradingView Strategy Tester Panel:
The overview graph is an intuitive graph that plots the blue (gain) and red (loss) curves of all backtest periods together, and notes: the absolute value and percentage of net profit, the number of all closed positions, the winning percentage, the profit factor, The maximum trading loss, the absolute value and ratio of the average trading profit and loss, and the average number of K-lines held in all trades.
Another is the performance summary. This is to display all long and short statistical indicators of backtesting in the form of a list, such as: net profit, gross profit, Sharpe ratio, maximum position, commission, times of profit and loss, etc.
Finally, the transaction list is a table indexed by the transaction serial number, showing the signal direction, date and time, price, profit and loss, accumulated profit and loss, maximum transaction profit, transaction loss and other values.
Remarks
Finally, I will explain that this is just the beginning of this model. I will continue to optimize the trading system of the second layer. Various optimization feedback and suggestions are welcome. For valuable feedback, I am willing to provide some L4/L5 technical indicators as rewards for free subscription rights.

Iceberg Intraday LearningHOW TO USE?
A setup which contains Most Useful 14 indicators, that any Intraday Trader might require.
Below will see one by one-
1) Trend Following Icebergs - (3 Different Indicators to choose from)
--> The trend following indicators optionally.
--> Very simple to understand, yellow indicating sideways, green - going upside, and red - going downside.
--> Trend Indicator - 1st Iceberg is HMA Crossovers
--> Trend Indicator - 2nd Iceberg is SMA (20). It will change its color according to the trend of the market.
--> Trend Indicator - 3rd Iceberg is RSI(14) in EMA, will be plotted at the bottom of the screen.
2) Classic Pivot Points & Floor Pivot Points: - ( 2 Different Indicators to choose from )
--> Classic Pivot Points having 5 Supports & Resistances on the chart.
--> Floor Pivot Points, At the middle, it is pivot point (PP) level and multiple support and resistance levels
--> Floor Pivot Points is a very known indicator that indicates whether that helps in-stock selection.
--> This is a very crucial indicator as it shows the Floor Pivot Points levels for the next day.
--> One can make a learn by looking at next day's Floor Pivot Points that whether the stock is going to be trendy/sideways the next day.
3) Support/Resistance
--> This indicator is used for finding support and resistance levels on charts.
--> Helps in getting pullbacks and exit levels
--> Lines will change color automatically if any candle closes above the support/resistance line. It will change it's to green.
--> Similarly, it will change its color to red if the price is below the support
4) Highs/lows, SuperTrend Up Down ( 2 Different indicators to use )
--> Plots Highs / Lows in the selected time frame.
--> Added SuperTrend indicator with length 10 with source HL/2 and multiplier to be 2.
5) Dynamic ATR - Average True Range (14 Days)
--> It plots 2 important levels at the starting of the day.
--> 2 bands are plotted in the morning when the market opens, resembling strong support/resistance zones.
6) First Candle
--> This will highlight the first candle that is formed of the selected time interval.
7) Bollinger Band
--> Bollinger band is also added for better catching the momentum as seen on chart.
--> The Upper and Lower Bands are used as a way to measure volatility by watching the relationship between the Bands and price
8) VWAP
--> VWAP is useful for learning trend direction in any market conditions.
9) RSI & MACD
--> Plots label indicating the status of RSI and MACD.
This works for Intraday Trades - when the resolution is kept to less than 1 hour ( Say 3 , 5 , 10 , 15 Mins), This works well when the resolution is kept to 1 Day - Good for Swing Trades spanning over a few days, This works well when the resolution is kept to 1 Day or Week - Good for Investments.
Trend Indicator - 3rd Iceberg Is a repainted based on the hybrid RSI Logic
Stop Loss - That should be done by following ones risk appetite , Ideally the open/close of the previous candle should be the stop loss for the buy/sell but everyone has their own Risk Management Strategies based on the capital deployed.
If you like it and find it useful or if you find a defect or bug , Please let us know in the comments .. that would encouraging !! for us to develop it further
Coded for learning INDIAN Markets.
CAUTION:: There could be scenarios when the breakout/breakdown candle is rejected , especially when it is long one
so it is always recommended to have a confirmation candle that open-closes above the breakout candle / open-closes below the breakdown candle.
Disclaimer: No Investment Advice Provided , You should always understand that P AST PERFORMANCE IS NOT NECESSARILY INDICATIVE OF FUTURE RESULTS.
Inspiring to learn the Pine making market learnings easier.
Thanks & Regards,
Iceberg Intraday Learning.

The Trend Oracle - The Ultimate Position ToolThe Trend Oracle is a superadaptive multi-timeframe Indicator
Ideal timeframes are 4H, and 1D
It is based on a combination of several other indicators including:
- The Superstrength Index - An adaptive indicator using volume weighted average of the traditional RSI, MFI and OBV
- The Superfast MACD - An adaptive zero lag MACD
- ADX Trend - A tweaked version of the ADX
- Chop Zones - A combination of 2 Chop indexes to identify trending and non trending conditions.
- The Adaptive Supertrend - An adaptive version of the Supertrend, (switching multipliers based on the market trend)
- Breakout & Breakdown - An algorithm computing volume compression and expansion to indicate breakout & breakdown signals.
- [bBullish and Bearish Divergences - Confirmed Bull and Bear divs shown as green and red dots at the top and bottom of the indicator.
Areas highlighted in Aqua are bullish, red are bearish.
Use this indicator as a tool to position yourself over longer timeframes.
Enjoy!
MM :)
