Supertrend + MACD with Advanced FiltersDetailed Guide
1. Indicator Overview
Purpose:
This enhanced indicator combines Supertrend and MACD to signal potential trend changes. In addition, it now includes several extra filters for more reliable signals:
Multi-Timeframe (MTF) Confirmation: Checks a higher timeframe’s trend.
ADX (Momentum) Filter: Ensures the market is trending strongly.
Dynamic Factor Adjustment: Adapts the Supertrend sensitivity to current volatility.
Volume Filter: Verifies that current volume is above average.
Each filter can be enabled or disabled according to your preference.
How It Works:
The Supertrend calculates dynamic support/resistance levels based on ATR and an adjustable factor, while MACD identifies momentum shifts via its crossovers. The additional filters then confirm whether the conditions meet your criteria for a trend change. If all enabled filters align, the indicator plots a shape and triggers an alert.
2. Supertrend Component with Dynamic Factor
Base Factor & ATR Period:
The Supertrend uses these inputs to compute its dynamic bands.
Dynamic Factor Toggle:
When enabled, the factor is adjusted by comparing the current ATR to its simple moving average. This makes the indicator adapt to higher or lower volatility conditions, helping to reduce false signals.
3. MACD Component
Parameters:
Standard MACD settings (Fast MA, Slow MA, Signal Smoothing) determine the responsiveness of the MACD line. Crossovers between the MACD line and its signal line indicate potential trend reversals.
4. Multi-Timeframe (MTF) Filter
Function:
If enabled, the indicator uses a higher timeframe’s simple moving average (SMA) to confirm the prevailing trend.
Bullish Confirmation: The current close is above the higher timeframe SMA.
Bearish Confirmation: The current close is below the higher timeframe SMA.
5. ADX Filter (Momentum)
Custom Calculation:
Since the built-in ta.adx function may not be available, a custom ADX is calculated. This involves:
Determining positive and negative directional movements (DMs).
Smoothing these values to obtain +DI and -DI.
Calculating the DX and then smoothing it to yield the ADX.
Threshold:
Only signals where the ADX exceeds the set threshold (default 20) are considered valid, ensuring that the market is trending strongly enough.
6. Volume Filter
Function:
Checks if the current volume exceeds the average volume (SMA) multiplied by a specified factor. This helps confirm that a price move is supported by sufficient trading activity.
7. Combined Signal Logic & Alerts
Final Signal:
A bullish signal is generated when:
MACD shows a bullish crossover,
Supertrend indicates an uptrend,
And all enabled filters (MTF, ADX, volume) confirm the signal.
The bearish signal is generated similarly in the opposite direction.
Alerts:
Alert conditions are set so that TradingView can notify you via pop-up, email, or SMS when these combined conditions are met.
8. User Adjustments
Toggle Filters:
Use the on/off switches for MTF, ADX, and Volume filters as needed.
Parameter Tuning:
Adjust the ATR period, base factor, higher timeframe settings, ADX period/threshold, and volume multiplier to match your trading style and market conditions.
Backtesting:
Always backtest your settings to ensure that they perform well with your strategy.
Pesquisar nos scripts por "supertrend"
Supertrend Scanner on ChartThis Indicator is Used to scan 10 stock on chart.
Supertrend is widely used indicator on tradingview. So we have used the originals indicator codes of supertrend by tradingview here. Background color has been changed as per supertrend trrend.
Problem : Sometime trader wants to track multiple stocks supertrend at a time. Mostly those stock are of same sector. To track all the stocks of same sector in one chart , trader has to open multiple charts for that.
Solution : This indicator pointout where other stocks has changed the trend. Like if you see "SBIN" written in GEREEN at bottom of the candle , that means on that particular candle SBIN supertrend has changed to positive. Similarly if you see "KOTAK" written in RED at top of the candle the means supertrend has changed to Negative on that particular candle. Its so easy to trace 10 stock on same chart which stocks labelling.
How to use :
When you trade on any index , then apply all the index constituents stock on this indicator. When Index changes the trend and that change in trend is confirmed by other constituents ( like 7/10 confirmed ) then that is confirmed trend. If all the constituents are on same direction than that's the confirmed trend.
Disclamer : This indicator is for education purpose , for any profit or loss , we are not responsible. Trade on your own risk.

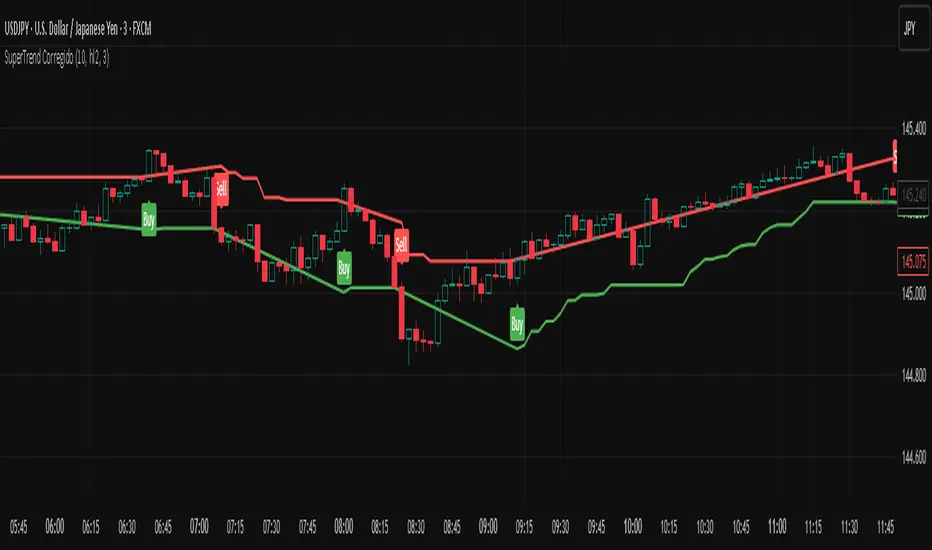
SuperTrend CorregidoThis script implements a SuperTrend indicator based on the Average True Range (ATR). It is designed to help traders identify trend direction and potential buy/sell opportunities with visual signals on the chart.
🔧 Key Features:
ATR-Based Trend Detection: Calculates trend shifts using the ATR and a user-defined multiplier.
Buy/Sell Signals: Displays "Buy" and "Sell" labels directly on the chart when the trend changes direction.
Visual Trend Lines: Plots green (uptrend) and red (downtrend) SuperTrend lines to highlight the current market bias.
Trend Highlighting: Optionally fills the background to emphasize whether the market is in an uptrend or downtrend.
Customizable Settings:
ATR period and multiplier
Option to switch ATR calculation method
Toggle for signal visibility and trend highlighting
🔔 Alerts Included:
SuperTrend Buy Signal
SuperTrend Sell Signal
SuperTrend Direction Change
This indicator is useful for identifying entries and exits based on trend momentum and can be used across various timeframes.
Hikmet SupertrendSuperTrend is one of the most common ATR based trailing stop indicators.
In this version you can change the ATR calculation method from the settings. Default method is RMA, when the alternative method is SMA .
The indicator is easy to use and gives an accurate reading about an ongoing trend. It is constructed with two parameters, namely period and multiplier. The default values used while constructing a superindicator are 10 for average true range or trading period and three for its multiplier.
The average true range (ATR) plays an important role in 'Supertrend' as the indicator uses ATR to calculate its value. The ATR indicator signals the degree of price volatility .
The buy and sell signals are generated when the indicator starts plotting either on top of the closing price or below the closing price. A buy signal is generated when the ‘Supertrend’ closes above the price and a sell signal is generated when it closes below the closing price.
It also suggests that the trend is shifting from descending mode to ascending mode. Contrary to this, when a ‘Supertrend’ closes above the price, it generates a sell signal as the colour of the indicator changes into red.
A ‘Supertrend’ indicator can be used on equities, futures or forex, or even crypto markets and also on daily, weekly and hourly charts as well, but generally, it fails in a sideways-moving market.
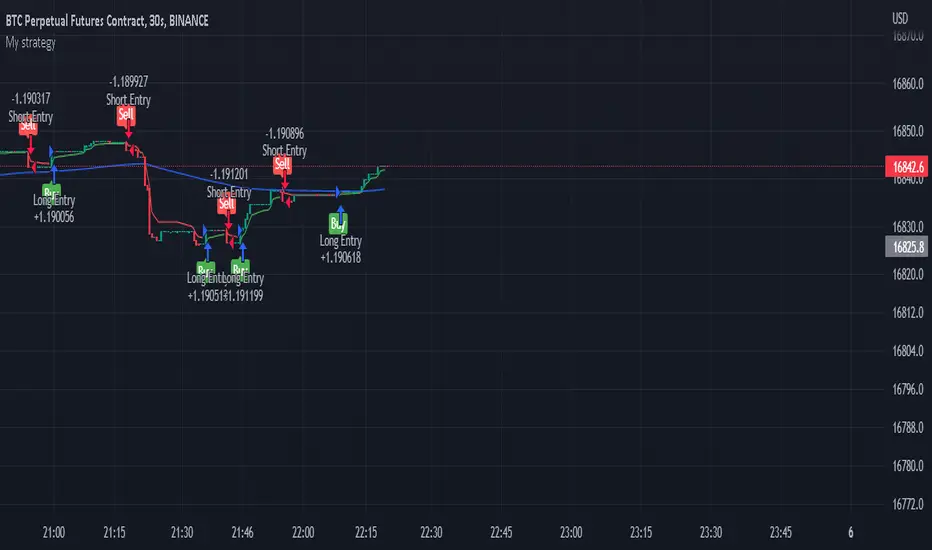
Supertrend Fixed TP Unified with Time Filter (MSK)Trend Strategy Based on the SuperTrend Indicator
This strategy is based on the use of the adaptive SuperTrend indicator, which takes into account the current market volatility and acts as a dynamic trailing stop. The indicator is visualized on the chart with colors that change depending on the direction of the trade: green indicates an uptrend (long), while red indicates a downtrend (short).
How It Works:
A buy signal (long) is generated when a bar closes above the indicator line.
A sell signal (short) is triggered when a bar closes below the indicator line.
Strategy Settings:
Trading Modes :
Long only : Only long positions are allowed.
Short only : Only short positions are allowed.
Both : Both types of trades are permitted.
Take-Profit :
The strategy supports a simple percentage-based take-profit, allowing you to lock in profits during sharp price movements without waiting for a pullback.
The take-profit level and its value are visualized on the chart. Visualization can be disabled in the settings.
Colored Chart Areas :
Long and short areas on the chart are highlighted with background colors for easier analysis.
Price Level :
You can set a price level in the settings to restrict trade execution:
Long trades are executed only above the specified level.
Short trades are executed only below the specified level.
This mode can be enabled or disabled in the parameters.
________________________________________________________________
Описание стратегии (на русском языке)
Трендовая стратегия на основе индикатора SuperTrend
Стратегия основана на использовании адаптивного индикатора SuperTrend , который учитывает текущую волатильность рынка и играет роль динамического трейлинг-стопа. Индикатор визуализируется на графике цветом, который меняется в зависимости от направления сделки: зелёный цвет указывает на восходящий тренд (лонг), а красный — на нисходящий тренд (шорт).
Принцип работы:
Сигнал на покупку (лонг) генерируется при закрытии бара выше линии индикатора.
Сигнал на продажу (шорт) возникает при закрытии бара ниже линии индикатора.
Настройки стратегии:
Режимы торговли :
Long only : только лонговые позиции.
Short only : только шортовые позиции.
Both : разрешены оба типа сделок.
Тейк-профит :
Стратегия поддерживает простой процентный тейк-профит, что позволяет фиксировать прибыль при резком изменении цены без ожидания отката.
Уровень и значение тейк-профита визуализируются на графике. Визуализацию можно отключить в настройках.
Цветные области графика :
Лонговые и шортовые области графика выделяются цветом фона для удобства анализа.
Уровень цены :
В настройках можно задать уровень цены, который будет ограничивать выполнение сделок:
Лонговые сделки выполняются только выше указанного уровня.
Шортовые сделки выполняются только ниже указанного уровня.
Этот режим можно включать или отключать в параметрах.

Supertrend Volume OscillatorThe Supertrend Volume Oscillator is an innovative tool that integrates volume analysis with the established Supertrend indicator to offer a unique perspective on market conditions. By comparing directional volume against the aggregate volume over a designated lookback period, this oscillator adeptly signals overbought and oversold states through a volume-weighted methodology. Key settings such as the lookback period, Supertrend factor, and ATR period are adjustable, allowing traders to tailor the trend detection sensitivity to their preference.
Crucially, the oscillator delineates overbought and oversold zones via a channel parameter, with its value represented as a percentage ratio of directional to total volume, visually enhanced by a color gradient shifting from red to green based on oscillator readings. Background coloring further highlights market extremes for easy identification. A continuous line tracks the oscillator's value, anchored by a horizontal zero line as a neutral benchmark.
Additionally, the oscillator is equipped with alert conditions that notify traders when entering critical zones, facilitating informed trading decisions. This fusion of price trend analysis with volume metrics provides traders with a comprehensive tool for gauging market sentiment and trend strength, making the Supertrend Volume Oscillator a valuable addition to any trader's arsenal.

SuperTrend MAAfter building SuperBands, I kept thinking about what happens at the midpoint between those two volatility-adaptive envelopes. The upper and lower bands are both trailing price based on ATR and EMA smoothing, but they're operating independently in opposite directions. Taking their average seemed like it might produce an interesting centerline that adapts to volatility in a way that regular moving averages don't. Turns out it does, and that's what this indicator is.
The core concept is straightforward. Instead of plotting the upper and lower SuperBands separately, this calculates both of them internally, averages their values, and then applies an additional smoothing pass with EMA to create a single centerline. That centerline sits roughly in the middle of where the bands would be, but because it's derived from ATR-offset trailing stops rather than direct price smoothing, it behaves differently than a standard moving average of the same length. During trending periods, the centerline tracks closer to price because one of the underlying bands is actively trailing while the other is dormant. During consolidation, both bands compress toward price and the centerline tends to oscillate more with shorter-term movements.
What's interesting is that this acts like a supertrend all by itself with directional behavior baked in. When one of the underlying supertrend waves dominates, meaning price is strongly trending in one direction and only one band is active, you get what feels like a "true" supertrend, whatever that means exactly. The centerline locks into trend-following mode and the color gradient reflects that commitment. You get bright bullish colors during sustained uptrends when the upper band is doing all the work, and strong bearish colors during downtrends when the lower band dominates. But when both bands are active and fighting for control, which happens during consolidation or choppy conditions, the centerline settles into more neutral tones that clearly signal you're in a ranging environment. The colors really do emphasize this behavior and make it visually obvious which regime you're in.
The smoothing parameter controls how aggressively the underlying SuperBand trails adapt to price, which indirectly affects how responsive the centerline is. Lower values make the bands tighter and more reactive, so the centerline follows price action more closely. Higher values create wider bands that only respond to sustained moves, which produces a smoother centerline that filters out more noise. The center smoothing parameter applies a second EMA pass specifically to the averaged midpoint, giving you independent control over how much additional lag you want on the final output versus the raw band average.
What makes this different from just slapping an EMA on price is that the underlying bands are already volatility-aware through their ATR calculations. When volatility spikes, the bands widen and the centerline adjusts its position relative to price based on where those bands settle. A traditional moving average would just smooth over the volatility spike without adjusting its distance from price. This approach incorporates volatility information into the centerline's positioning, which can help it stay relevant during regime changes where fixed-period moving averages tend to lag badly or whipsaw.
The color gradient adds a momentum overlay using the same angle-based calculation from SuperBands. The centerline's rate of change gets normalized by an RMS estimate of its historical movement range, converted to an angle through arctangent scaling, and then mapped to a color gradient. When the centerline is rising, it gradients from neutral toward your chosen bullish color, with brightness increasing as the rate of ascent steepens. When falling, it shifts toward the bearish color with intensity tied to the descent rate. This gives you an immediate visual sense of whether the centerline is accelerating, decelerating, or moving at a stable pace.
Configuration is simpler than SuperBands since you're only dealing with a single output line instead of separate bull and bear envelopes. The length parameter controls the underlying band behavior. ATR period and multiplier determine how much space the bands allocate around price before they trail. Center smoothing adds the extra EMA pass on the averaged midpoint. You can tune these independently to get different characteristics. A tight ATR multiplier with heavy center smoothing creates a smooth line that stays close to price. A wide multiplier with light center smoothing produces a line that swings more freely and adapts faster to directional changes.
From a practical standpoint, this works well as a trend filter or dynamic support and resistance reference. Price above the centerline with bullish coloring suggests a favorable environment for long positions. Price below with bearish coloring indicates the opposite. Crossovers can signal trend changes, though like any moving average system, you'll get whipsaws in choppy conditions. The advantage over traditional MAs is that the volatility adaptation tends to reduce false signals during transitional periods where volatility is expanding but direction hasn't fully committed.
The implementation reuses the entire SuperBands logic, which means all the smoothing and state management for the trailing stops is identical. The only addition is averaging the two band outputs and applying the final EMA pass. The color calculation follows the same RMS-normalized angle approach but applies it to the centerline's delta rather than the individual band deltas. This keeps the coloring consistent with how SuperBands handles momentum visualization while adapting it to a single line instead of dual envelopes.
What this really highlights is that you can derive moving averages from mechanisms other than direct price smoothing. By building the centerline from volatility-adjusted trailing stops, you get adaptive behavior that responds to both price movement and volatility regime without needing separate inputs or complex multi-stage calculations. Whether that adaptation provides a meaningful edge depends on your strategy and market, but it's a fundamentally different approach than the typical fixed-period or adaptive MAs that adjust length based on volatility or momentum indicators.

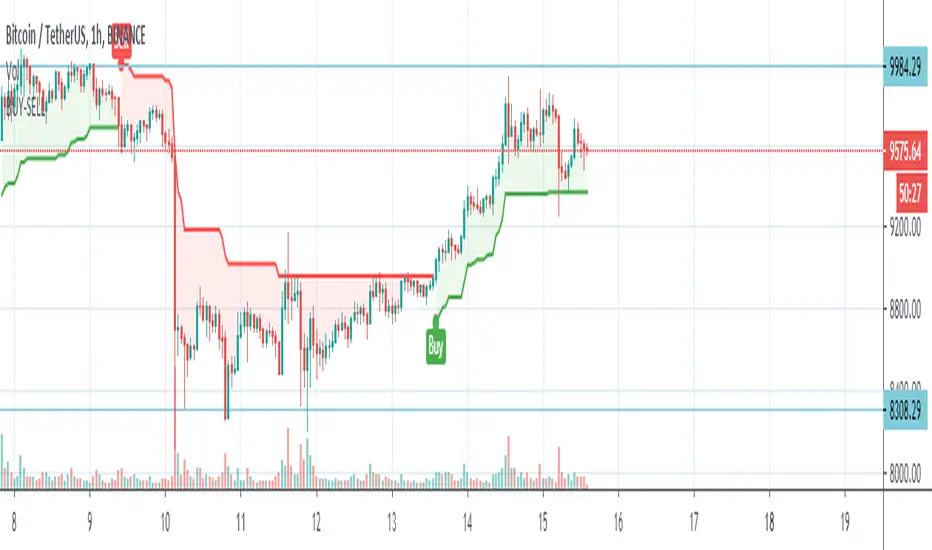
Supertrend with Buy/Sell SignalsThis simple Supertrend with Buy/Sell Signals is a trend-following indicator that helps identify market direction and potential entry/exit points. It uses the Average True Range (ATR) to calculate a dynamic support and resistance line:
Buy Signal: A green "BUY" label appears when the price crosses above the Supertrend line, indicating a possible bullish trend.
Sell Signal: A red "SELL" label appears when the price crosses below the Supertrend line, signaling a potential bearish trend.
The indicator also adapts to market volatility and displays the trend line in green for uptrends and red for downtrends. It is best used in trending markets.

SuperTrend With EMA100First of all, SuperTrend Indicator is an indicator developed by KivancOzbilgic and I would like to thank him for sharing this indicator with open source code.
In this version of Supertrend, I wanted to determine the best reaction point for upcoming dips in uptrends.
The indicator is easy to use and gives an accurate reading about an ongoing trend. EMA was determined as the source.
There are 3 parameters that you can edit. These are the EMA length, ATR period and ATR Multiplier.
The average true range (ATR) plays an important role in 'Supertrend' as the indicator uses ATR to calculate its value. The ATR indicator signals the degree of price volatility .
I've found it's a bestreaction point when these values are set to 100, 10 and 0.5 respectively. I tried to show them in the graph.

SuperTrend BFThe SuperTrend overlay by Olivier Seban provides an excellent 'trailing stop' that can be used with any bar length for bullish or bearish moves. My preferred timeframe is weekly for capturing huge (Super) moves. For instance applying it to AAPL, this baby would have us reeling in a fivebagger over the course of three years. Patience and holding your nerve are key to trend following and I like to think of SuperTrend as a great big visual 'crutch' right there on the chart.
Essentially this is an average true range trailing stop, of which there are several versions available (eg see the Sylvain Vervoort version programmed by H Potter). SuperTrend differs by referring the stop back from the middle of the bar (High+Low)/2. This is similar to using the Vervoort with a tweak to the number of ATR's considered. At the end of the day its a matter of preference and what works best for you.

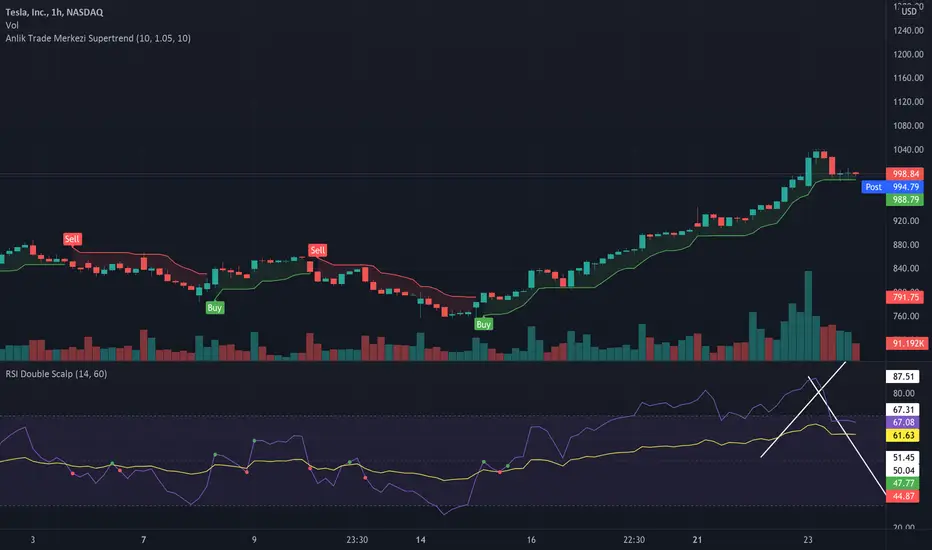
Anlik Trade Merkezi SupertrendSupertrend modified with vwma. In addition to the supertrend settings in the settings section, determine the vwma length and set it according to the chart timeframe.
Supertrend LSMA long StrategyThis is a long strategy which combines Super trend indicator with LSMA moving average.
In general it tends to works better with long trending markets such as stocks and cryptos using a big timeframe.
The rules are simple
Long entry:
Supertrend is telling us to go long and close of a candle is above moving average
Long exit:
Supertrend is telling us to go short
IF you have any questions, let me know !


Supertrend Buy or Sell Signal - oringan fixI fixed SuperTrend little (origin if from LazyBear)
I love SuperTrend !!!!! so nice script!!!
and
I like alt-coin and 4hour candle.
That is why i fixed it.
Recommand 4hour and 4factor, 1pd.
and 1 trade per day.
It loose often but the loss ratio is about -8~15%
But when it win, it could earn much money!
If i have better idea, i will update this script
Korean : 4시간 봉 추천합니다. 하루에 한번정도의 매매를 목표로 설정했습니다. 더 좋은 설정값을 찾으면 업데이트할게요.
지표 추가 방법 간단 설명 (나중에 자세한 글 써서 스팀잇 할 예정)
아래 하단에 add to favorite 누르고, 차트 보는 중에 우클릭 - 지표넣기 - 즐겨찾기 - 지표이름찾아서 클릭.

Supertrend 1.0 with AlertsThe same as the original Supertrend 1.0 indicator except I have added alerts and set the bar colour based on the trend.
Original code is here:

Supertrend + EMA + RSI Algo (Low Risk High Accuracy)This is a trend-following + momentum confirmation strategy designed to reduce false signals and control loss.
Supertrend (10,3) → Identifies overall market direction (Buy in uptrend, Sell in downtrend)
EMA 50 & EMA 200 → Confirms strong trend and avoids sideways market
Buy only when EMA 50 is above EMA 200
Sell only when EMA 50 is below EMA 200
RSI (14) → Confirms momentum
Buy when RSI > 55 (strong bullish momentum)
Sell when RSI < 45 (strong bearish momentum)
---
🔹 Entry Logic
BUY: Market is in uptrend + strong momentum
SELL: Market is in downtrend + strong bearish pressure
---
🔹 Risk Management (Most Important)
Stop Loss: Based on ATR (adapts to volatility)
Target: Fixed Risk-Reward ratio (example: 1 : 2.5)
This keeps loss small and profits larger
---
🔹 Best Use Case
Works best in trending markets
Ideal timeframes: 15m, 1h, 4h
Suitable for crypto futures & swing trading
Beginner-friendly if used with low leverage


Supertrend + MACD + EMA200 (Pro) V2 — Strict & TrailingThis strategy uses Supertrend, MACD and EMA 200 as indicators. When all three indicators shows the sema direction, you enter the trade.

Supertrend Long-Only Strategy for QQQThis strategy is meant to use Micro Momentum to give good Buy and Sell signals in trending markets

Supertrend and Fast and Slow EMA StrategyThis strategy combines Exponential Moving Averages (EMAs) and Average True Range (ATR) to create a simple, yet effective, trend-following approach. The strategy filters out fake or sideways signals by incorporating the ATR as a volatility filter, ensuring that trades are only taken during trending conditions. The key idea is to buy when the short-term trend (Fast EMA) aligns with the long-term trend (Slow EMA), and to avoid trades during low volatility periods.
How It Works:
EMA Crossover:
1). Buy Signal: When the Fast EMA (shorter-term, e.g., 20-period) crosses above the Slow EMA (longer-term, e.g., 50-period), this indicates a potential uptrend.
2). Sell Signal: When the Fast EMA crosses below the Slow EMA, this indicates a potential downtrend.
ATR Filter:
1). The ATR (Average True Range) is used to measure market volatility.
2). Trending Market: If the ATR is above a certain threshold, it indicates high volatility and a trending market. Only when ATR is above the threshold will the strategy generate buy/sell signals.
3). Sideways Market: If ATR is low (sideways or choppy market), the strategy will suppress signals to avoid entering during non-trending conditions.
When to Buy:
1). Condition 1: The Fast EMA crosses above the Slow EMA.
2). Condition 2: The ATR is above the defined threshold, indicating that the market is trending (not sideways or choppy).
When to Sell:
1). Condition 1: The Fast EMA crosses below the Slow EMA.
2). Condition 2: The ATR is above the defined threshold, confirming that the market is in a downtrend.
When Not to Enter the Trade:
1). Sideways Market: If the ATR is below the threshold, signaling low volatility and sideways or choppy market conditions, the strategy will not trigger any buy or sell signals.
2). False Crossovers: In low volatility conditions, price action tends to be noisy, which could lead to false signals. Therefore, avoiding trades during these periods reduces the risk of false breakouts.
Additional Factors to Consider Adding:
=> RSI (Relative Strength Index): Adding an RSI filter can help confirm overbought or oversold conditions to avoid buying into overextended moves or selling too low.
1). RSI Buy Filter: Only take buy signals when RSI is below 70 (avoiding overbought conditions).
2). RSI Sell Filter: Only take sell signals when RSI is above 30 (avoiding oversold conditions).
=> MACD (Moving Average Convergence Divergence): Using MACD can help validate the strength of the trend.
1). Buy when the MACD histogram is above the zero line and the Fast EMA crosses above the Slow EMA.
2). Sell when the MACD histogram is below the zero line and the Fast EMA crosses below the Slow EMA.
=> Support/Resistance Levels: Adding support and resistance levels can help you understand market structure and decide whether to enter or exit a trade.
1). Buy when price breaks above a significant resistance level (after a valid buy signal).
2). Sell when price breaks below a major support level (after a valid sell signal).
=> Volume: Consider adding a volume filter to ensure that buy/sell signals are supported by strong market participation. You could only take signals if the volume is above the moving average of volume over a certain period.
=> Trailing Stop Loss: Instead of a fixed stop loss, use a trailing stop based on a percentage or ATR to lock in profits as the trade moves in your favor.
=> Exit Signals: Besides the EMA crossover, consider adding Take Profit or Stop Loss levels, or even using a secondary indicator like RSI to signal an overbought/oversold condition and exit the trade.
Example Usage:
=> Buy Example:
1). Fast EMA (20-period) crosses above the Slow EMA (50-period).
2). The ATR is above the threshold, confirming that the market is trending.
3). Optionally, if RSI is below 70, the buy signal is further confirmed as not being overbought.
=> Sell Example:
1). Fast EMA (20-period) crosses below the Slow EMA (50-period).
2). The ATR is above the threshold, confirming that the market is trending.
3). Optionally, if RSI is above 30, the sell signal is further confirmed as not being oversold.
Conclusion:
This strategy helps to identify trending markets and filters out sideways or choppy market conditions. By using Fast and Slow EMAs combined with the ATR volatility filter, it provides a reliable approach to catching trending moves while avoiding false signals during low-volatility, sideways markets.

SuperTrend with Chebyshev FilterModified Super Trend with Chebyshev Filter
The Modified Super Trend is an innovative take on the classic Super Trend indicator. This advanced version incorporates a Chebyshev filter, which significantly enhances its capabilities by reducing false signals and improving overall signal quality. In this post, we'll dive deep into the Modified Super Trend, exploring its history, the benefits of the Chebyshev filter, and how it effectively addresses the challenges associated with smoothing, delay, and noise.
History of the Super Trend
The Super Trend indicator, developed by Olivier Seban, has been a popular tool among traders since its inception. It helps traders identify market trends and potential entry and exit points. The Super Trend uses average true range (ATR) and a multiplier to create a volatility-based trailing stop, providing traders with a dynamic tool that adapts to changing market conditions. However, the original Super Trend has its limitations, such as the tendency to produce false signals during periods of low volatility or sideways trading.
The Chebyshev Filter
The Chebyshev filter is a powerful mathematical tool that makes an excellent addition to the Super Trend indicator. It effectively addresses the issues of smoothing, delay, and noise associated with traditional moving averages. Chebyshev filters are named after Pafnuty Chebyshev, a renowned Russian mathematician who made significant contributions to the field of approximation theory.
The Chebyshev filter is capable of producing smoother, more responsive moving averages without introducing additional lag. This is possible because the filter minimizes the worst-case error between the ideal and the actual frequency response. There are two types of Chebyshev filters: Type I and Type II. Type I Chebyshev filters are designed to have an equiripple response in the passband, while Type II Chebyshev filters have an equiripple response in the stopband. The Modified Super Trend allows users to choose between these two types based on their preferences.
Overcoming the Challenges
The Modified Super Trend addresses several challenges associated with the original Super Trend:
Smoothing: The Chebyshev filter produces a smoother moving average without introducing additional lag. This feature is particularly beneficial during periods of low volatility or sideways trading, as it reduces the number of false signals.
Delay: The Chebyshev filter helps minimize the delay between price action and the generated signal, allowing traders to make timely decisions based on more accurate information.
Noise Reduction: The Chebyshev filter's ability to minimize the worst-case error between the ideal and actual frequency response reduces the impact of noise on the generated signals. This feature is especially useful when using the true range as an offset for the price, as it helps generate more reliable signals within a reasonable time frame.
The Great Replacement
The Modified Super Trend with Chebyshev filter is an excellent replacement for the original Super Trend indicator. It offers significant improvements in terms of signal quality, responsiveness, and accuracy. By incorporating the Chebyshev filter, the Modified Super Trend effectively reduces the number of false signals during low volatility or sideways trading, making it a more reliable tool for identifying market trends and potential entry and exit points.
In-Depth Guide to the Modified Super Trend Settings
The Modified Super Trend with Chebyshev filter offers a wide range of settings that allow traders to fine-tune the indicator to suit their specific trading styles and objectives. In this section, we will discuss each setting in detail, explaining its purpose and how to use it effectively.
Source
The source setting determines the price data used for calculations. The default setting is hl2, which calculates the average of the high and low prices. You can choose other price data sources such as close, open, or ohlc4 (average of open, high, low, and close prices) based on your preference.
Up Color and Down Color
These settings control the color of the trend line when the market is in an uptrend (up_color) and a downtrend (down_color). You can customize these colors to your liking, making it easier to visually identify the current market trend.
Text Color
This setting controls the color of the text displayed on the chart when using labels to indicate trend changes. You can choose any color that contrasts well with your chart background for better readability.
Mean Length
The mean_length setting determines the length (number of bars) used for the Chebyshev moving average calculation. A shorter length will make the moving average more responsive to price changes, while a longer length will produce a smoother moving average. It is crucial to find the right balance between responsiveness and smoothness, as a too-short length may generate false signals, while a too-long length might produce lagging signals. The default value is 64, but you can experiment with different values to find the optimal setting for your trading strategy.
Mean Ripple
The mean_ripple setting influences the Chebyshev filter's ripple effect in the passband (Type I) or stopband (Type II). The ripple effect represents small oscillations in the frequency response, which can impact the moving average's smoothness. The default value is 0.01, but you can experiment with different values to find the best balance between smoothness and responsiveness.
Chebyshev Type: Type I or Type II
The style setting allows you to choose between Type I and Type II Chebyshev filters. Type I filters have an equiripple response in the passband, while Type II filters have an equiripple response in the stopband. Depending on your preference for smoothness and responsiveness, you can choose the type that best fits your trading style.
ATR Style
The atr_style setting determines the method used for calculating the Average True Range (ATR). By default (false), it uses the traditional high-low range. When set to true, it uses the absolute difference between the open and close prices. You can choose the method that works best for your trading strategy and the market you are trading.
ATR Length
The atr_length setting controls the length (number of bars) used for calculating the ATR. Similar to the mean_length, a shorter length will make the ATR more responsive to price changes, while a longer length will produce a smoother ATR. The default value is 64, but you can experiment with different values to find the optimal setting for your trading strategy.
ATR Ripple
The atr_ripple setting, like the mean_ripple, influences the ripple effect of the Chebyshev filter used in the ATR calculation. The default value is 0.05, but you can experiment with different values to find the best balance between smoothness and responsiveness.
Multiplier
The multiplier setting determines the factor by which the ATR is multiplied before being added
Super Trend Logic and Signal Optimization
The Modified Super Trend with Chebyshev filter is designed to minimize false signals and provide a clear indication of market trends. It does so by using a combination of moving averages, Average True Range (ATR), and a multiplier. In this section, we will discuss the Super Trend's logic, its ability to prevent false signals, and the early warning crosses added to the indicator.
Super Trend Logic
The Super Trend's logic is based on a combination of the Chebyshev moving average and ATR. The Chebyshev moving average is a smooth moving average that effectively filters out market noise, while the ATR is a measure of market volatility.
The Super Trend is calculated by adding or subtracting a multiple of the ATR from the Chebyshev moving average. The multiplier is a user-defined value that determines the distance between the trend line and the price action. A larger multiplier results in a wider channel, reducing the likelihood of false signals but potentially missing out on valid trend changes.
Preventing False Signals
The Super Trend is designed to minimize false signals by maintaining its trend direction until a significant change in the market occurs. In a downtrend, the trend line will only decrease in value, and in an uptrend, it will only increase. This helps prevent false signals caused by temporary price fluctuations or market noise.
When the price crosses the trend line, the Super Trend does not immediately change its direction. Instead, it employs a safety logic to ensure that the trend change is genuine. The safety logic checks if the new trend line (calculated using the updated moving average and ATR) is more extreme than the previous one. If it is, the trend line is updated; otherwise, the previous trend line is maintained. This mechanism further reduces the likelihood of false signals by ensuring that the trend line only changes when there is a significant shift in the market.
Early Warning Crosses
To provide traders with additional insight, the Modified Super Trend with Chebyshev filter includes early warning crosses. These crosses are plotted on the chart when the price crosses the trend line without the safety logic. Although these crosses do not necessarily indicate a trend change, they can serve as a valuable heads-up for traders to monitor the market closely and prepare for potential trend reversals.
In conclusion, the Modified Super Trend with Chebyshev filter offers a significant improvement over the original Super Trend indicator. By incorporating the Chebyshev filter, this modified version effectively addresses the challenges of smoothing, delay, and noise reduction while minimizing false signals. The wide range of customizable settings allows traders to tailor the indicator to their specific needs, while the inclusion of early warning crosses provides valuable insight into potential trend reversals.
Ultimately, the Modified Super Trend with Chebyshev filter is an excellent tool for traders looking to enhance their trend identification and decision-making abilities. With its advanced features, this indicator can help traders navigate volatile markets with confidence, making more informed decisions based on accurate, timely information.

supertrend with multiple filter strategythis indicator filters buy and sell signal from the supertrend base on various condition that the user can manually select.
as of now the following filter are included
buy and sell filter;
-Macd
-CCI
-EMA200
-LUX TRAMA
-Stochastic rsi
-MFI
EXIT SIGNAL CAN BE CHOSE BETWEEN ATR BAND OR BOLLINGER BAND
i am planning on keeping to add filters so if you have suggestion fell free to message me.