Directional Momentum Flux StrategyDirectional Momentum Flux (DMF) is a compound indicator designed to surface signals of projected change in directional momentum. The primary goal is to identify possible momentum inflection points and signal them before they happen, which is reached by applying a set of well-known high-level indicators (e.g. DEMA, RSIs, CCIs and VWAP), lower-level indicators (e.g. BOP, PPO and RMOMO), and some special sauce brewed in-house by yours truly.
This strategy is invite-only. Invitations are offered for a one-time fee of $250 payable in several cryptocurrencies (ETH, BTC, DASH, XMR or ZEC). Once you've got an invitation, you will automatically receive updates forever*.
DMF was designed to work across multiple asset classes. Extensive backtesting has been performed over multiple sample series (not just during the bull runs, for example) and against a randomized pool of assets. But don't take my word for it, I've included some time-based backtesting support tools to make it easy-peasy for you to validate the results yourself!
Under the hood, DMF is powered by numerous indicators, including:
✓ Double EMA & Composite SMA;
✓ Double RSI (fast & slow, variable);
✓ Composite StochRSI & VWAP (StochRSI+, two series);
✓ Composite Commodity Channel Index (CCI+, two series);
✓ Volume-Weighted Balance of Power (BOP itself was adapted from BOP_LB, kudos to LazyBear);
✓ Percentage Price Oscillator (PPO, split, two series);
✓ Range-adjusted Momentum Oscillator (RMOMO, my fancy MOM variant);
It crunches all that data and generates signals which are issued in two ways:
✓ Vertical Bands (or VBs) - Entry/Exit windows as vertical bands that remain "lit" (e.g. the background of a series of candles is semi-opaque white) while the top-level signals are showing sufficiently strong BUY signals. These windows are the primary entry/exit targets and can be relied upon with sufficient risk mitigation (e.g. a reasonable stop-loss or other scale-out exit mechanism). A VB followed immediately by an egg is as good as gold.
✓ Eggs - Entry/Exit validation signals that confirm the condition indicated by VBs. A lit VB without an egg in the same or next candle session is considered to be valid , but not safe (see above warning). Waiting for an egg can improve performance at the risk of missing the best possible entry point. Consider your risk tolerance and act accordingly.
Basic Instructions:
✓ Configure The Settings! The defaults are pretty good, but don't be scared to try variations. For example, by default SHORT positions are disabled. You might want to enable them if your risk tolerance allows them. (IMO there's gold on both ends of the rainbow. 🌈)
✓ Pay attention to the VBs. If you see a lit band being placed in an otherwise dark area, it's a projected inflection point. This is expected to be validated and confirmed in the same or immediately following period with an egg. You can enter a LONG position at this time.
✓ Pay attention to the eggs. If you see an egg, it's a confirmation that the VB changes in the same or immediately preceding candle period is valid. If you did not enter or exit your position at the point of the VB shift, now is the time to do so.
✓ Watch for the end of a VB period and be prepared to exit your position quickly as the next egg may be accompanied by a large directional momentum inflection.
Things to Note:
📉 - DMF is designed for day trading with aggressive position TTLs (15m was the upper bound during development and strategy testing). It appears to issue valid signals for other intervals, but it was not designed for >15m and YMMV. Don't go manually opening a LONG with no exit strategy and go to sleep... it probably won't work out to your benefit. You should be prepared to exit positions at any time. (Pro tip: automation is your friend!)
💸 - DMF indicator is not free from risk. As with all investment strategies, it is crucial to exercise caution and only trade with funds you are comfortable losing. DMF does not offer any form of guarantee or warranty, implied or otherwise. If you lose money, your house, your 401K... that's on you. (Pro tip: don't risk anything you're not ready to lose, because losses are part of the game and you WILL have them.)
🤔 - By using this indicator, you understand that any and all risks are the sole and complete responsibility of the end user (yeah, that's you). Don't use it if you're not 100% clear that you know exactly what you're doing. (Pro tip: always ask questions if you're feeling confused.)
⏱ - * Forever in this context means that, where room for improvement exists, I will improve it over time and you'll get all updates until I stop making them. (Pro tip: nobody lives forever.)
Pesquisar nos scripts por "stop loss"

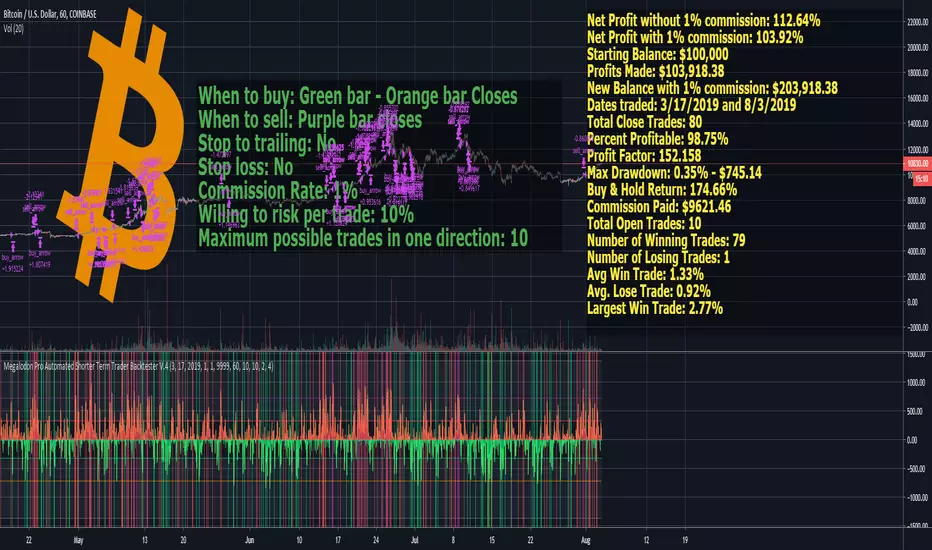
Megalodon Pro Automated Shorter Term Trader BacktesterSTRATEGY
When to buy: Green bar - Orange bar Closes
When to sell: Purple bar closes
Stop to trailing: No
Stop loss: No
Commission Rate: 1%
Willing to risk per trade: 10%
Maximum possible trades in one direction: 10
RESULTS
Net Profit without 1% commission: 112.64%
Net Profit with 1% commission: 103.92%
Starting Balance: $100,000
Profits Made: $103,918.38
New Balance with 1% commission: $203,918.38
Dates traded: 3/17/2019 and 8/3/2019
Total Close Trades: 80
Percent Profitable: 98.75%
Profit Factor: 152.158
Max Drawdown: 0.35% - $745.14
Buy & Hold Return: 174.66%
Commission Paid: $9621.46
Total Open Trades: 10
Number of Winning Trades: 79
Number of Losing Trades: 1
Avg Win Trade: 1.33%
Avg. Lose Trade: 0.92%
Largest Win Trade: 2.77%
Let me know what you guys think about the results?
Due to the tradingview's limitations on providing the shorter time frame price data, we had to provide a 60 minute time frame backtesting results.
The shorter time frames including 1 minute and 15 minutes backtesting results are way more accurate and precise than 60 minutes time frame results.
Megalodon Trading
Enlightening the Modern Investors
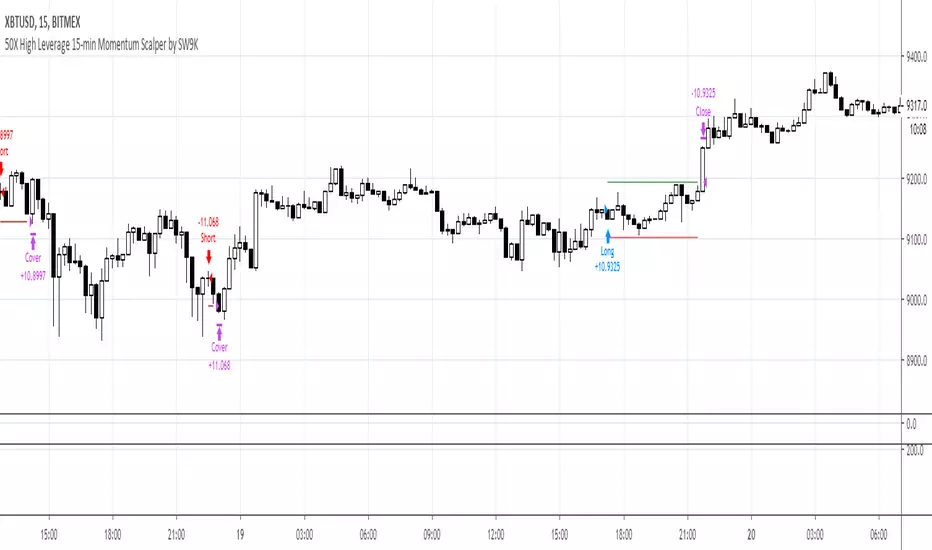
15MEX Momentum ScalperAlpha product project in development. Uses a combination of MACD and T3-CCI with tweaked settings to catch directional momentum and scalp a small move. Strategy is quantity of trades over quality of trades to build profits.
Use this strategy for 15-min Bitmex scalping on XBT contracts only. Recommend 100k contract size or less; backtested with 100k contracts.
Market enter, then use post-only limit exits and stop losses.
Setting is pre-optimized for 0.5% tp target and 0.5% sl of entry price. Recommend default 3 bars as basis for confirming recent MACD crossover as well as default 0.618 Fibonacci ratio as the T3-CCI basis.
Default risk level setting is approximately 2-3 trades a day. You can double the amount to 4-5 trades a day by enabling Aggressive mode. This may lead to larger profits and more entries, but with more frequent stop losses.
Future version will include trailing TPs/stops. Still undergoing optimization and refinement.
RePaNoCHa [Backtest]This is a very long script and adjusting the settings can be a bit slow so I share some settings. (these may be even better)
It has no security() and no Heikin Ashi so no repaint and Backtest is real.
It's important to adjust correctly the tics/pips correction.
All timeframes but good results at 2H
Default settings for ETHUSD (BITMEX) 2H
Alerts version coming soon...
Enjoy!!!
"Este script es la repanocha"
XBTUSD (BITMEX)
Timeframe = 2H
Position Side = BOTH
Source = hlc3
T3 == true
T3 Length = 8
T3 Volume Factor = 0.9
Range Filter+ADX == true
Sampling Period = 16
Range Multiplier = 1.3
Flat Market Trades == true
ADX lenght = 10
ADX Threshold = 20
Parabolic SAR == true
SAR start = 0.03
SAR inc = 0.02
SAR max = 0.3
Pyramiding = 15
Trailing Stop Activation % = 0.5
Trailing Stop Offset % (when profit=0.5 %) = 0.2
Trailing Stop Offset % (when profit=10 %) = 1.2
Stop Loss = 3.2
Tics/Pips Correction = 10
Initial Capital = 1000
Quantity = 100 %
Commission value = 0.075 %
ETHUSD (BITMEX)
Timeframe = 2H
Position Side = BOTH
Source = hlc3
T3 == true
T3 Length = 6
T3 Volume Factor = 0.7
Range Filter+ADX == true
Sampling Period = 10
Range Multiplier = 0.9
Flat Market Trades == true
ADX lenght = 11
ADX Threshold = 19
Parabolic SAR == true
SAR start = 0.06
SAR inc = 0.07
SAR max = 0.15
Pyramiding = 15
Trailing Stop Activation % = 0.5
Trailing Stop Offset % (when profit=0.5 %) = 0.25
Trailing Stop Offset % (when profit=10 %) = 1.5
Stop Loss = 3.2
Tics/Pips Correction = 100
Initial Capital = 1000
Quantity = 100 %
Commission value = 0.075 %
BNBUSDT (BINANCE)
Timeframe = 2H
Position Side = LONG
Source = hlc3
T3 == true
T3 Length = 6
T3 Volume Factor = 0.7
Range Filter+ADX == true
Sampling Period = 17
Range Multiplier = 1.3
Flat Market Trades == true
ADX lenght = 5
ADX Threshold = 18
Parabolic SAR == true
SAR start = 0.04
SAR inc = 0.03
SAR max = 0.25
Pyramiding = 15
Trailing Stop Activation % = 0.5
Trailing Stop Offset % (when profit=0.5 %) = 0.25
Trailing Stop Offset % (when profit=10 %) = 1.5
Stop Loss == false
Tics/Pips Correction = 10000
Initial Capital = 1000
Quantity = 100 %
Commission value = 0.075 %
LTCUSDT (BINANCE)
Timeframe = 2H
Position Side = LONG
Source = hlc3
T3 == true
T3 Length = 3
T3 Volume Factor = 1
Range Filter+ADX == true
Sampling Period = 11
Range Multiplier = 1.1
Flat Market Trades == true
ADX lenght = 6
ADX Threshold = 22
Parabolic SAR == true
SAR start = 0.07
SAR inc = 0.04
SAR max = 0.15
Pyramiding = 15
Trailing Stop Activation % = 0.5
Trailing Stop Offset % (when profit=0.5 %) = 0.25
Trailing Stop Offset % (when profit=10 %) = 1.5
Stop Loss == false
Tics/Pips Correction = 100
Initial Capital = 1000
Quantity = 100 %
Commission value = 0.075 %
TRXUSDT (BINANCE)
Timeframe = 2H
Position Side = LONG
Source = hlc3
T3 == true
T3 Length = 7
T3 Volume Factor = 1
Range Filter+ADX == true
Sampling Period = 8
Range Multiplier = 1.1
Flat Market Trades == true
ADX lenght = 4
ADX Threshold = 22
Parabolic SAR == true
SAR start = 0.07
SAR inc = 0.04
SAR max = 0.15
Pyramiding = 15
Trailing Stop Activation % = 0.5
Trailing Stop Offset % (when profit=0.5 %) = 0.25
Trailing Stop Offset % (when profit=10 %) = 1.5
Stop Loss == false
Tics/Pips Correction = 100000
Initial Capital = 1000
Quantity = 100 %
Commission value = 0.075 %
NAS100 (OANDA)
Timeframe = 2H
Position Side = BOTH
Source = hlc3
T3 == true
T3 Length = 3
T3 Volume Factor = 1
Range Filter+ADX == true
Sampling Period = 12
Range Multiplier = 1.3
Flat Market Trades == true
ADX lenght = 18
ADX Threshold = 21
Parabolic SAR == true
SAR start = 0.08
SAR inc = 0.06
SAR max = 0.25
Pyramiding = 15
Trailing Stop Activation % = 0.2
Trailing Stop Offset % (when profit=0.5 %) = 0.15
Trailing Stop Offset % (when profit=10 %) = 1
Stop Loss == false
Tics/Pips Correction = 10
Initial Capital = 1000
Quantity = 3 contracts
Commission value = 0.2 USD per contract
NATGAS(OANDA)
Timeframe = 2H
Position Side = BOTH
Source = hlc3
T3 == true
T3 Length = 3
T3 Volume Factor = 1
Range Filter+ADX == true
Sampling Period = 15
Range Multiplier = 1.3
Flat Market Trades == true
ADX lenght = 12
ADX Threshold = 21
Parabolic SAR == true
SAR start = 0.08
SAR inc = 0.06
SAR max = 0.4
Pyramiding = 15
Trailing Stop Activation % = 0.2
Trailing Stop Offset % (when profit=0.5 %) = 0.15
Trailing Stop Offset % (when profit=10 %) = 1
Stop Loss == false
Tics/Pips Correction = 1000
Initial Capital = 1000
Quantity = 4500 contracts
Commission value = 0.002 USD per contract
SPX500 (OANDA)
Timeframe = 2H
Position Side = BOTH
Source = hlc3
T3 == true
T3 Length = 4
T3 Volume Factor = 0.8
Range Filter+ADX == true
Sampling Period = 14
Range Multiplier = 1.3
Flat Market Trades == true
ADX lenght = 12
ADX Threshold = 17
Parabolic SAR == true
SAR start = 0.09
SAR inc = 0.04
SAR max = 0.2
Pyramiding = 15
Trailing Stop Activation % = 0.15
Trailing Stop Offset % (when profit=0.5 %) = 0.1
Trailing Stop Offset % (when profit=10 %) = 0.5
Stop Loss = 1.5
Tics/Pips Correction = 10
Initial Capital = 1000
Quantity = 8 contracts
Commission value = 0.2 USD per contract
US30 (OANDA)
Timeframe = 2H
Position Side = BOTH
Source = hlc3
T3 == true
T3 Length = 4
T3 Volume Factor = 0.9
Range Filter+ADX == true
Sampling Period = 11
Range Multiplier = 1.1
Flat Market Trades == true
ADX lenght = 16
ADX Threshold = 24
Parabolic SAR == true
SAR start = 0.08
SAR inc = 0.03
SAR max = 0.05
Pyramiding = 15
Trailing Stop Activation % = 0.15
Trailing Stop Offset % (when profit=0.5 %) = 0.075
Trailing Stop Offset % (when profit=10 %) = 0.5
Stop Loss = 1.5
Tics/Pips Correction = 10
Initial Capital = 1000
Quantity = 1 contracts
Commission value = 1.5 USD per contract
WHEAT (OANDA)
Timeframe = 2H
Position Side = BOTH
Source = hlc3
T3 == true
T3 Length = 3
T3 Volume Factor = 1.1
Range Filter+ADX == true
Sampling Period = 12
Range Multiplier = 0.9
Flat Market Trades == true
ADX lenght = 13
ADX Threshold = 21
Parabolic SAR == true
SAR start = 0.1
SAR inc = 0.05
SAR max = 0.15
Pyramiding = 15
Trailing Stop Activation % = 0.2
Trailing Stop Offset % (when profit=0.5 %) = 0.1
Trailing Stop Offset % (when profit=10 %) = 1
Stop Loss = 2.5
Tics/Pips Correction = 1000
Initial Capital = 1000
Quantity = 2500 contracts
Commission value = 0.003 USD per contract

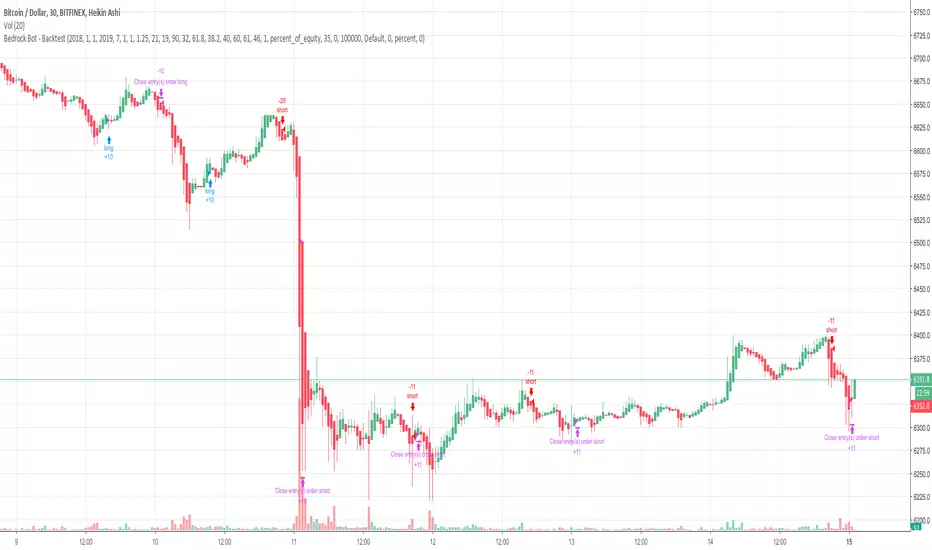
Bedrock Bot - BTCUSD 30m Scalper BotBedrock Bot trades on BTCUSD charts and is a high frequency scalper bot - for those that like a little more action.
The strategy was developed for use on more recent market conditions - smaller trends within larger sideways ranges. It will work in trends as well. It is made for quick take profits and tight stop losses to maximize overall profit and minimize losses (check out the win ratio and downdraw results). It does not trade on the weekends as much of the volume is now weekday based.
Backtest results look great and we have been running this bot on live markets as well in forward testing with profit results.
These live tests were done exclusively on BitMex and by using automation on Crypto Bots Hub . Monthly returns have been around 8% - you may think this doesn't sound amazing but understand compound interest and do check out the win percentage and downdraw. In these sideways markets, this can keep building your profits slow and steady with minimal risk.
The bot controls entries, stop losses, and take profits as part of the code.
Message me on information to get free access.
cryptomars 1.0 signal Concussion trend
Description:
1. In the indicator, there is an orange signal that fluctuates linearly. It is a buy signal when it goes from bottom to top. When the signal line remains in the upper position, it indicates a multi-party trend.
2. When it goes from top to bottom, it indicates a sell signal. When the signal line remains below, it indicates a sales trend.
3. Depending on the time level, when the position of the signal line changes, determine whether the current candle is completed or not according to the time level of the chart you selected to determine the signal. For example, if you select a chart level of 5 meters, then when the signal line changes, for example, it will send a sell signal from top to bottom. At this time, please do not rush to sell. You should wait for this 5 meter candlestick to complete. When the candle is over and the next candle is started, if the signal line remains in the top-down form, the sell signal is normal and you can sell it.
Because the position of the signal appears, it is the location of the sale. During the completion of the candlestick , the signal may disappear after disappearing. We only have to wait for a while to get a more stable deal.
4. The alarm setting is very simple. There are two lines in the indicator. One is the orange signal line that fluctuates up and down, and the other is the fixed zero line of “zero”.
We set it in the alarm. When the signal line passes "zero" from the top, the short signal is sent only when the candle map is completed. When the signal line passes "zero" from "up" below, the signal is sent for a long time when the candlestick is completed.
One trick, the appearance of the signal, is that the price runs in one direction for a while, so it appears at or near the bottom. Because, when we have already made a profit in the transaction, we can make a profit in advance, and we do not need to wait for the opposite signal to stop the profit and reduce the risk of profit retracement.
Because in this market, the fluctuations are very large, and the people who compete are also very fierce. What we need to do is to make every transaction as possible, and we are all profitable. If we sell and find that the price is still rising, please don't feel sorry, don't consider eating all the profits.
6. When the signal appears, in most cases, even in the impact trend, it will still run a distance in the direction of the signal, that is, you will profit, so please close the position and make a profit in time. Otherwise, when the price volatility is too small, you miss the profit point, the price starts to run in the opposite direction, and you may change from profit to loss.
BITMEX's trailing stop loss is a great feature, please use it flexibly.
7, if it is a shock trend, please try not to trade.
8. We recommend that you turn on the “cryptomars 3.0” and “cryptomars 2.0” indicators. No matter who signs the trade first, you can trade, which can help you get more profit.
9. Remember, I hope this indicator will be your powerful assistant, but please don't rely on it completely. Learning more trading knowledge and skills is even more important. Therefore, when we consider the profitable position, you can use your trading skills, MACD , KDJ, etc. to assist and profit in a more suitable position.

cryptomars signal short 2.0Description:
1. In the indicator, there is an orange signal that fluctuates linearly. It is a buy signal when it goes from bottom to top. When the signal line remains in the upper position, it indicates a multi-party trend.
2. When it goes from top to bottom, it indicates a sell signal. When the signal line remains below, it indicates a sales trend.
3. Depending on the time level, when the position of the signal line changes, determine whether the current candle is completed or not according to the time level of the chart you selected to determine the signal. For example, if you select a chart level of 5 meters, then when the signal line changes, for example, it will send a sell signal from top to bottom. At this time, please do not rush to sell. You should wait for this 5 meter candlestick to complete. When the candle is over and the next candle is started, if the signal line remains in the top-down form, the sell signal is normal and you can sell it.
Because the position of the signal appears, it is the location of the sale. During the completion of the candlestick , the signal may disappear after disappearing. We only have to wait for a while to get a more stable deal.
4. The alarm setting is very simple. There are two lines in the indicator. One is the orange signal line that fluctuates up and down, and the other is the fixed zero line of “zero”.
We set it in the alarm. When the signal line passes "zero" from the top, the short signal is sent only when the candle map is completed. When the signal line passes "zero" from "up" below, the signal is sent for a long time when the candlestick is completed.
One trick, the appearance of the signal, is that the price runs in one direction for a while, so it appears at or near the bottom. Because, when we have already made a profit in the transaction, we can make a profit in advance, and we do not need to wait for the opposite signal to stop the profit and reduce the risk of profit retracement.
Because in this market, the fluctuations are very large, and the people who compete are also very fierce. What we need to do is to make every transaction as possible, and we are all profitable. If we sell and find that the price is still rising, please don't feel sorry, don't consider eating all the profits.
6. When the signal appears, in most cases, even in the impact trend, it will still run a distance in the direction of the signal, that is, you will profit, so please close the position and make a profit in time. Otherwise, when the price volatility is too small, you miss the profit point, the price starts to run in the opposite direction, and you may change from profit to loss.
BITMEX's trailing stop loss is a great feature, please use it flexibly.
7, if it is a shock trend, please try not to trade.
8. We recommend that you turn on the “cryptomars 3.0” and “cryptomars 1.0” indicators. No matter who signs the trade first, you can trade, which can help you get more profit.
9. Remember, I hope this indicator will be your powerful assistant, but please don't rely on it completely. Learning more trading knowledge and skills is even more important. Therefore, when we consider the profitable position, you can use your trading skills, MACD , KDJ, etc. to assist and profit in a more suitable position.

cryptomars signal 3.0Description:
1. In the indicator, there is an orange signal that fluctuates linearly. It is a buy signal when it goes from bottom to top. When the signal line remains in the upper position, it indicates a multi-party trend.
2. When it goes from top to bottom, it indicates a sell signal. When the signal line remains below, it indicates a sales trend.
3. Depending on the time level, when the position of the signal line changes, determine whether the current candle is completed or not according to the time level of the chart you selected to determine the signal. For example, if you select a chart level of 5 meters, then when the signal line changes, for example, it will send a sell signal from top to bottom. At this time, please do not rush to sell. You should wait for this 5 meter candlestick to complete. When the candle is over and the next candle is started, if the signal line remains in the top-down form, the sell signal is normal and you can sell it.
Because the position of the signal appears, it is the location of the sale. During the completion of the candlestick , the signal may disappear after disappearing. We only have to wait for a while to get a more stable deal.
4. The alarm setting is very simple. There are two lines in the indicator. One is the orange signal line that fluctuates up and down, and the other is the fixed zero line of “zero”.
We set it in the alarm. When the signal line passes "zero" from the top, the short signal is sent only when the candle map is completed. When the signal line passes "zero" from "up" below, the signal is sent for a long time when the candlestick is completed.
One trick, the appearance of the signal, is that the price runs in one direction for a while, so it appears at or near the bottom. Because, when we have already made a profit in the transaction, we can make a profit in advance, and we do not need to wait for the opposite signal to stop the profit and reduce the risk of profit retracement.
Because in this market, the fluctuations are very large, and the people who compete are also very fierce. What we need to do is to make every transaction as possible, and we are all profitable. If we sell and find that the price is still rising, please don't feel sorry, don't consider eating all the profits.
6. When the signal appears, in most cases, even in the impact trend, it will still run a distance in the direction of the signal, that is, you will profit, so please close the position and make a profit in time. Otherwise, when the price volatility is too small, you miss the profit point, the price starts to run in the opposite direction, and you may change from profit to loss.
BITMEX's trailing stop loss is a great feature, please use it flexibly.
7, if it is a shock trend, please try not to trade.
8. We recommend that you turn on the “cryptomars 2.0” and “cryptomars 1.0” indicators. No matter who signs the trade first, you can trade, which can help you get more profit.
9. Remember, I hope this indicator will be your powerful assistant, but please don't rely on it completely. Learning more trading knowledge and skills is even more important. Therefore, when we consider the profitable position, you can use your trading skills, MACD , KDJ, etc. to assist and profit in a more suitable position.

Bollinger + RSI, Double Strategy (by ChartArt)Bollinger Bands + RSI, Double Strategy
This strategy uses a slower RSI with period 16 to sell when the RSI increases over the value of 55 (or to buy when the value falls below 45), with the classic Bollinger Bands strategy to sell when the price is above the upper Bollinger Band and falls below it (and to buy when the price is below the lower band and rises above it). This strategy only triggers when both the RSI and the Bollinger Bands indicators are at the same time in the described overbought or oversold condition. In addition there are color alerts which can be deactivated.
This basic strategy is based upon the "RSI Strategy" and "Bollinger Bands Strategy" which were created by Tradingview and uses no money management like a trailing stop loss and no scalping methods. Every win/loss trade is simply counted from the last overbought/oversold condition to the next one.
This strategy does not use close prices from higher-time frame and should not repaint after the current candle has closed. It might repaint like every Tradingview indicator while the current candle hasn't closed.
All trading involves high risk; past performance is not necessarily indicative of future results. Hypothetical or simulated performance results have certain inherent limitations. Unlike an actual performance record, simulated results do not represent actual trading. Also, since the trades have not actually been executed, the results may have under- or over-compensated for the impact, if any, of certain market factors, such as lack of liquidity. Simulated trading programs in general are also subject to the fact that they are designed with the benefit of hindsight. No representation is being made that any account will or is likely to achieve profits or losses similar to those shown.

Improved Candle Strategy (without daily squared)# Candle Pattern Trading Strategy
## Core Logic
Analyzes the last 5 candlesticks to identify "close at high" and "close at low" patterns, generating long/short signals.
## Trading Conditions
- **Long**: ≥2 bars closed at high in past 5 bars + current bar closes at high → Open long
- **Short**: ≥2 bars closed at low in past 5 bars + current bar closes at low → Open short
- **Filter**: If ≥3 doji patterns detected, skip trading
## Risk Management
- Stop Loss: Based on entry bar's high/low
- Take Profit: Risk × 2x multiplier
- Cooldown: No trading for 2 bars after entry
- Session Filter: No trading for first 5 bars after market open
## Configurable Parameters
- Lookback period, doji threshold, close proximity ratio, TP/SL ratio, cooldown bars, etc.
**Use Cases**: 1-minute and higher timeframes on stocks/futures

Daily Dynamic Grid StrategyHi everyone,
This strategy is built around a dynamic daily grid concept, using an upper and lower daily range that is automatically divided into multiple grid levels.
The idea is to take advantage of daily volatility by executing DCA entries on specific grid levels, based on predefined conditions.
Key points of the strategy & feature:
I recommend using 1H or 2H timeframe for this strategy
Take profit by grid
When DCA is active (>1 entry), the exit condition switches to close above the average price
A hard stop loss is applied
Includes an optional Trailing TP / SL to help maximize profit during strong moves
Like most DCA-based strategies, it tends to have a high win rate, but during strong market dumps, losses can become relatively large
Can also be used for backtest on Forex markets such as Gold, where using the trailing option is generally more effective
And still trial for the webhook, may continue to improve and update this strategy in future versions.

Scalping EMA + Pinbar Strategy (London & NY only, BE @ 1R)The scalping trading system uses two types of indicators:
EMA 10, EMA 21, EMA 50
Pinbar Indicator
Rules for entering a buy order:
If the closing price is above the EMA 50, the trend is uptrend and only buy orders should be considered.
The EMA 10 and EMA 21 lines must simultaneously be above the EMA 50.
The price must correct down at least 50% of the area created by the EMA 10 and EMA 21, or correct further down.
A Type 1 Pinbar candle (marked by the Pinbar indicator) must appear; this Pinbar candle must react to at least one of the three EMA lines (EMA 10, EMA 21, EMA 50) and close above the EMA 50.
This Pinbar candle must have a Pinbar strength value (marked by the Pinbar indicator) less than 2 to be considered valid. Check if the closing price of this pinbar candle is higher than the 50-day EMA and if the 10-day and 21-day EMAs are also higher than the 50-day EMA. If so, the conditions have been met and you can begin trading.
Place a buy stop order 0.1 pip higher than the highest price of the pinbar candle, and a stop loss order 0.1 pip lower than the lowest price of the pinbar candle. Set the take profit at 3R.
If the price moves past the previously set stop loss, cancel the pending order.
When the price moves 1R, move the stop loss back to the entry point.
The next trade can only be executed after the previous trade has moved the stop loss back to the entry point.
Rules for placing sell orders:
If the closing price is below the 50-day EMA, the trend is bearish, and only sell orders should be considered. The 10-day and 21-day EMAs must both be below the 50-day EMA.
The price must correct downwards by at least 50% of the area formed by the 10-day and 21-day EMAs, or even further.
A Type 1 pinbar candle (marked by the Pinbar indicator) must appear. This pinbar candle must react to at least one of the three EMAs (EMA 10, EMA 21, EMA 50) and close below the EMA 50.
This pinbar is valid if its strength (indicated by the Pinbar indicator) is less than 2. Verify that the closing price of this pinbar candle is below the EMA 50 and that both the EMA 10 and EMA 21 are below the EMA 50. If all conditions are met, the trade can be executed.
(This appears to be a separate entry rule and not part of the previous text.) Place a sell stop order 0.1 pip below the lowest point of the pinbar candle, and a stop loss order 0.1 pip above the highest point of the pinbar candle. Set the take profit point at 3R.
If the price moves past the previously set stop-loss point, cancel the pending order.
When the price moves 1R, move the stop-loss point back to the entry point.
The next trade can only be executed after the previous trade has moved the stop-loss point back to the entry point.

DR/IDR Break .5 TPDR/IDR Extension Breakout with Custom Stop
This strategy is a systematic, counter-trend, and momentum-based system designed for intraday trading. It operates on the principle of an Opening Range Breakout (ORB), utilizing the initial market consolidation to project high-probability targets, while offering multiple methods for managing risk.
1. Market Identification (The Opening Range)
The strategy begins by defining the market's initial boundaries and volatility:
Session Window: The strategy calculates the Opening Range (OR) over a user-defined time period (default: 9:30 AM to 10:30 AM New York Time).
ORB Levels: Two key price levels are established and locked once the time window closes:
Wick High/Low: The absolute highest and lowest prices of the session. These serve as the entry trigger lines.
Body High/Low (Shaded Range): The highest and lowest open/close prices of the session. The height of this range is used to calculate the Take Profit and Stop Loss levels.
2. Entry Rule (The Breakout)
The strategy is passive until the range is violated, looking for a strong move out of the consolidation area.
Trigger Condition: A trade is signaled when a candle closes either:
Above the Wick High (for a Long entry).
Below the Wick Low (for a Short entry).
Execution: The entry is a Market Order executed on the candle that meets the trigger condition, subject to a user-defined Entry Delay (default 0 bars, meaning the entry is taken immediately upon the breakout candle's close).
Direction Control: The user can select to trade Long Only, Short Only, or Both.
3. Exit and Risk Management
All trades are placed with simultaneous Take Profit and Stop Loss orders (a bracket order) once the entry is filled.
A. Take Profit (TP)
The Take Profit is set at the 0.5 Extension of the Shaded Range (Body Range).
Calculation: The distance from the Body High/Low to the TP level is exactly 50% of the total height of the Shaded Range.
B. Stop Loss (SL)
The Stop Loss is dynamically calculated based on a user-selected method for risk control:
Range 0.5 (Body Range): The Stop Loss is placed an equal distance (0.5 times the Body Range height) outside the opposite side of the Body Range.
Example (Long): If entry is above the Wick High, the SL is set 0.5 times the Body Range height below the Body Low.
ATR Multiple: The Stop Loss distance is determined by the asset's recent volatility.
Calculation: The distance is calculated as a user-defined Multiplier (default 2.0) times the Average True Range (ATR).
Recent Swing Low/High: The Stop Loss is placed based on a structural level defined by recent price action.
Long Entry: SL is placed at the Lowest Swing Low within a user-defined lookback period.
Short Entry: SL is placed at the Highest Swing High within a user-defined lookback period.
Summary of Workflow
The market sets the Wick and Body boundaries (e.g., 9:30–10:30 AM).
Price breaks and closes beyond a Wick boundary, triggering a signal.
The trade enters after the specified delay.
A bracket order is placed: TP is fixed at the 0.5 Extension, and SL is set based on the user's chosen risk method.
The trade is closed upon reaching either the TP or the SL level.

OLPF - Octavio Low-Pass Filter StrategyOCTAVIO LOW-PASS FILTER (OLPF) v1.0
---
DESCRIPTION
The Octavio Low-Pass Filter (OLPF) is an advanced Finite Impulse Response (FIR) low-pass filter designed for financial time series analysis. It builds upon the foundational work of the New Low-Pass Filter (NLF) by Alex Pierrefeu, introducing three key enhancements that significantly improve signal quality and reduce common filtering artifacts.
---
KEY INNOVATIONS
1. HERMITE SMOOTHING POLYNOMIAL
Replaces the simple quadratic base (x²) with the cubic Hermite interpolation polynomial . This mathematical refinement provides C¹ continuity at kernel boundaries, ensuring smoother transitions and eliminating edge discontinuities that can introduce artificial noise into the filtered signal.
2. LANCZOS SIGMA FACTOR WINDOWING
Applies a Lanczos-type attenuation factor to each harmonic component in the sine series. This windowing technique dramatically reduces the Gibbs phenomenon - the characteristic overshooting and ringing that occurs near sharp price transitions. The result is a cleaner signal with minimized false crossover signals.
3. ADAPTIVE WEIGHT NORMALIZATION
Implements dynamic normalization of kernel weights, guaranteeing that the sum of all filter coefficients equals unity. This ensures proper amplitude preservation across all market conditions and prevents signal drift or scaling artifacts.
---
MATHEMATICAL FOUNDATION
The OLPF kernel function is defined as:
K(x, N) = x²(3-2x) + Σ (1/i) × σ(i) × sin(πxi)
Where:
- x ∈ is the normalized position within the filter window
- N is the filter order (degree of the sine series)
- σ(i) = sin(πi/(N+1)) / (πi/(N+1)) is the Lanczos sigma factor
The filter output is computed via discrete convolution:
F(M, N) = Σ src × / W
Where W is the sum of all weights for normalization.
---
APPLICATIONS
- Trend identification with reduced lag compared to traditional MAs
- Noise reduction in volatile market conditions
- Generation of trading signals via fast/slow filter crossovers
- Foundation for more complex indicator development
---
STRATEGY IMPLEMENTATION
This script implements a dual-filter crossover strategy with:
- Fast OLPF for responsive signal generation
- Slow OLPF for trend confirmation
- EMA filter for additional trend validation
- ATR-based dynamic stop-loss positioning
- Risk-based position sizing (percentage of equity)
---
AUTHOR
Name: Hector Octavio Piccone Pacheco
Filter: Octavio Low-Pass Filter (OLPF)
Version: 1.0
Based on: New Low-Pass Filter (NLF) by Alex Pierrefeu
Date: 2025
Original Contributions:
- Hermite smoothing polynomial kernel base
- Lanczos sigma factor windowing for Gibbs reduction
- Adaptive weight normalization system
- Integrated risk management framework
---
LICENSE
This work is licensed under the Mozilla Public License 2.0. You are free to use, modify, and distribute this code with attribution.
---
DISCLAIMER
Trading involves substantial risk of loss. This indicator is provided for educational and research purposes only. Past performance does not guarantee future results. Always conduct your own analysis and risk assessment.

DOGE Stochastic RSI Pro System📌 Strategy Overview
The DOGE Stochastic RSI Pro System is a high-precision algorithm designed specifically for DOGEUSDT on the 1-hour timeframe.
It combines the power of Stochastic RSI momentum, EMA trend direction, and VWAP price positioning to generate high-probability long and short entries.
This system was optimized through multi-year backtesting and short-term adaptive tuning, showing strong performance during trending and volatility-rich periods.
📌 Technical Logic
✔ 1. Stochastic RSI Core
Entry when %K crosses %D
Detects momentum reversals early
Works effectively on DOGE volatility cycles
✔ 2. EMA Trend Filter
EMA50 above EMA150 → long-bias signals allowed
EMA50 below EMA150 → short-bias signals allowed
Prevents trading against the dominant trend
Improves signal accuracy
✔ 3. VWAP Institutional Filter
Price above VWAP → only long entries
Price below VWAP → only short entries
Avoids low-quality trades in mean-reversion zones
📌 Money Management
✔ Starting Amount: 5 USDT
✔ Take Profit: 3%
✔ Stop Loss: 3%
✔ Both Long & Short
✔ No Martingale — Clean, stable system
The strategy opens one position at a time to avoid overexposure.
📌 Recommended Settings
Pair: DOGEUSDT
Timeframe: 1H
Leverage (Bybit): 5–10× (optional, system does not enforce leverage)
Broker Execution: Bybit derivatives or spot with position sizing
📌 Backtesting Results (User Verified)
1 Year Backtest: ~57–58% win rate
2 Year Backtest: ~56% win rate
Last 3 Months: ~61% win rate
Last 30 Days: ~64% win rate
Profit Factor Range: 1.32 – 1.70
This system performs best in moderate trending + volatility expansion cycles.
📌 Notes for Users
Strategy does not repaint.
Behavior may vary depending on exchange price feeds.
Use proper risk management and test before going live.
Performance may change over time as markets shift.
📌 Access
This is an Invite-Only script.
Access is granted only to approved users.
If you'd like access, send a private request.
📌 Disclaimer
This script is for educational and research purposes only.
Not financial advice. Trading involves risk.
Past performance does not guarantee future results.

Dynamic SMA Trend System [Multi-Stage Risk Engine]Description:
This script implements a robust Trend Following strategy based on a multiple Simple Moving Average (SMA) crossover logic (25, 50, 100, 200). What sets this strategy apart is its advanced "4-Stage Risk Engine" and a smart "High-Water Mark" Re-Entry system, designed to protect profits during parabolic moves while filtering out chop during sideways markets.
How it works:
The strategy operates on three core pillars: Trend Identification, Dynamic Risk Management, and Momentum Re-Entry.
1. Entry Logic (Trend Identification) The script looks for crossovers at different trend stages to capture early reversals as well as established trends:
Short-Term: SMA 25 crosses over SMA 50.
Mid-Term: SMA 50 crosses over SMA 100.
Macro-Trend: SMA 100 crosses over SMA 200.
2. The 4-Stage Risk Engine (Dynamic Stop Loss) Instead of a static Stop Loss, this strategy uses a progressive system that adapts as the price increases:
Stage 1 (Protection): Starts with a fixed Stop Loss (default -10%) to give the trade room to breathe.
Stage 2 (Break-Even): Once the price rises by 12%, the Stop is moved to trailing mode (10% distance), effectively securing a near break-even state.
Stage 3 (Profit Locking): At 25% profit, the trailing stop tightens to 8% to lock in gains.
Stage 4 (Parabolic Mode): At 40% profit, the trailing stop tightens further to 5% to capture the peak of parabolic moves.
3. Dual Exit Mechanism The strategy exits a position if EITHER of the following happens:
Stop Loss Hit: Price falls below the dynamic red line (Risk Engine).
Dead Cross: The trend structure breaks (e.g., SMA 25 crosses under SMA 50), signaling a momentum loss even if the Stop Loss wasn't hit.
4. "High-Water Mark" Re-Entry To avoid "whipsaws" in choppy markets, the script does not re-enter immediately after a stop-out.
It marks the highest price of the previous trade (Green Dotted Line).
A Re-Entry only occurs if the price breaks above this previous high (showing renewed strength) AND the long-term trend is bullish (Price > SMA 200).
Visuals:
SMAs: 25 (Yellow), 50 (Orange), 100 (Blue), 200 (White).
Red Line: Visualizes the dynamic Stop Loss level.
Green Dots: Visualizes the target price needed for a valid re-entry.
Settings: All parameters (SMA lengths, Stop Loss percentages, Staging triggers) are fully customizable in the settings menu to fit different assets (Crypto, Stocks, Forex) and timeframes.

Superior-Range Bound Renko - Strategy - 11-29-25 - SignalLynxSuperior-Range Bound Renko Strategy with Advanced Risk Management Template
Signal Lynx | Free Scripts supporting Automation for the Night-Shift Nation 🌙
1. Overview
Welcome to Superior-Range Bound Renko (RBR) — a volatility-aware, structure-respecting swing-trading system built on top of a full Risk Management (RM) Template from Signal Lynx.
Instead of relying on static lookbacks (like “14-period RSI”) or plain MA crosses, Superior RBR:
Adapts its range definition to market volatility in real time
Emulates Renko Bricks on a standard, time-based chart (no Renko chart type required)
Uses a stack of Laguerre Filters to detect genuine impulse vs. noise
Adds an Adaptive SuperTrend powered by a small k-means-style clustering routine on volatility
Under the hood, this script also includes the full Signal Lynx Risk Management Engine:
A state machine that separates “Signal” from “Execution”
Layered exit tools: Stop Loss, Trailing Stop, Staged Take Profit, Advanced Adaptive Trailing Stop (AATS), and an RSI-style stop (RSIS)
Designed for non-repainting behavior on closed candles by basing execution-critical logic on previous-bar data
We are publishing this as an open-source template so traders and developers can leverage a professional-grade RM engine while integrating their own signal logic if they wish.
2. Quick Action Guide (TL;DR)
Best Timeframe:
4 Hours (H4) and above. This is a high-conviction swing-trading system, not a scalper.
Best Assets:
Volatile instruments that still respect market structure:
Bitcoin, Ethereum, Gold (XAUUSD), high-volatility Forex pairs (e.g., GBPJPY), indices with clean ranges.
Strategy Type:
Volatility-Adaptive Trend Following + Impulse Detection.
It hunts for genuine expansion out of ranges, not tiny mean-reversion nibbles.
Key Feature:
Renko Emulation on time-based candles.
We mathematically model Renko Bricks and overlay them on your standard chart to define:
“Equilibrium” zones (inside the brick structure)
“Breakout / impulse” zones (when price AND the impulse line depart from the bricks)
Repainting:
Designed to be non-repainting on closed candles.
All RM execution logic uses confirmed historical data (no future bars, no security() lookahead). Intrabar flicker during formation is allowed, but once a bar closes the engine’s decisions are stable.
Core Toggles & Filters:
Enable Longs and Shorts independently
Optional Weekend filter (block trades on Saturday/Sunday)
Per-module toggles: Stop Loss, Trailing Stop, Staged Take Profits, AATS, RSIS
3. Detailed Report: How It Works
A. The Strategy Logic: Superior RBR
Superior RBR builds its entry signal from multiple mathematical layers working together.
1) Adaptive Lookback (Volatility Normalization)
Instead of a fixed 100-bar or 200-bar range, the script:
Computes ATR-based volatility over a user-defined period.
Normalizes that volatility relative to its recent min/max.
Maps the normalized value into a dynamic lookback window between a minimum and maximum (e.g., 4 to 100 bars).
High Volatility:
The lookback shrinks, so the system reacts faster to explosive moves.
Low Volatility:
The lookback expands, so the system sees a “bigger picture” and filters out chop.
All the core “Range High/Low” and “Range Close High/Low” boundaries are built on top of this adaptive window.
2) Range Construction & Quick Ranges
The engine constructs several nested ranges:
Outer Range:
rangeHighFinal – dynamic highest high
rangeLowFinal – dynamic lowest low
Inner Close Range:
rangeCloseHighFinal – highest close
rangeCloseLowFinal – lowest close
Quick Ranges:
“Half-length” variants of those, used to detect more responsive changes in structure and volatility.
These ranges define:
The macro box price is trading inside
Shorter-term “pressure zones” where price is coiling before expansion
3) Renko Emulation (The Bricks)
Rather than using the Renko chart type (which discards time), this script emulates Renko behavior on your normal candles:
A “brick size” is defined either:
As a standard percentage move, or
As a volatility-driven (ATR) brick, optionally inhibited by a minimum standard size
The engine tracks a base value and derives:
brickUpper – top of the emulated brick
brickLower – bottom of the emulated brick
When price moves sufficiently beyond those levels, the brick “shifts”, and the directional memory (renkoDir) updates:
renkoDir = +2 when bricks are advancing upward
renkoDir = -2 when bricks are stepping downward
You can think of this as a synthetic Renko tape overlaid on time-based candles:
Inside the brick: equilibrium / consolidation
Breaking away from the brick: momentum / expansion
4) Impulse Tracking with Laguerre Filters
The script uses multiple Laguerre Filters to smooth price and brick-derived data without traditional lag.
Key filters include:
LagF_1 / LagF_W: Based on brick upper/lower baselines
LagF_Q: Based on HLCC4 (high + low + 2×close)/4
LagF_Y / LagF_P: Complex averages combining brick structures and range averages
LagF_V (Primary Impulse Line):
A smooth, high-level impulse line derived from a blend of the above plus the outer ranges
Conceptually:
When the impulse line pushes away from the brick structure and continues in one direction, an impulse move is underway.
When its direction flips and begins to roll over, the impulse is fading, hinting at mean reversion back into the range.
5) Fib-Based Structure & Swaps
The system also layers in Fib levels derived from the adaptive ranges:
Standard levels (12%, 23.6%, 38.2%, 50%, 61%, 76.8%, 88%) from the main range
A secondary “swap” set derived from close-range dynamics (fib12Swap, fib23Swap, etc.)
These Fibs are used to:
Bucket price into structural zones (below 12, between 23–38, etc.)
Detect breakouts when price and Laguerre move beyond key Fib thresholds
Drive zSwap logic (where a secondary Fib set becomes the active structure once certain conditions are met)
6) Adaptive SuperTrend with K-Means-Style Volatility Clustering
Under the hood, the script uses a small k-means-style clustering routine on ATR:
ATR is measured over a fixed period
The range of ATR values is split into Low, Medium, High volatility centroids
Current ATR is assigned to the nearest centroid (cluster)
From that, a SuperTrend variant (STK) is computed with dynamic sensitivity:
In quiet markets, SuperTrend can afford to be tighter
In wild markets, it widens appropriately to avoid constant whipsaw
This SuperTrend-based oscillator (LagF_K and its signals) is then combined with the brick and Laguerre stack to confirm valid trend regimes.
7) Final Baseline Signals (+2 / -2)
The “brain” of Superior RBR lives in the Baseline & Signal Generation block:
Two composite signals are built: B1 and B2:
They combine:
Fib breakouts
Renko direction (renkoDir)
Expansion direction (expansionQuickDir)
Multiple Laguerre alignments (LagF_Q, LagF_W, LagF_Y, LagF_Z, LagF_P, LagF_V)
They also factor in whether Fib structures are expanding or contracting.
A user toggle selects the “Baseline” signal:
finalSig = B2 (default) or B1 (alternate baseline)
finalSig is then filtered through the RM state machine and only when everything aligns, we emit:
+2 = Long / Buy signal
-2 = Short / Sell signal
0 = No new trade
Those +2 / -2 values are what feed the Risk Management Engine.
B. The Risk Management (RM) Engine
This script features the Signal Lynx Risk Management Engine, a proprietary state machine built to separate Signal from Execution.
Instead of firing orders directly on indicator conditions, we:
Convert the raw signal into a clean integer (Fin = +2 / -2 / 0)
Feed it into a Trade State Machine that understands:
Are we flat?
Are we in a long or short?
Are we in a closing sequence?
Should we permit re-entry now or wait?
Logic Injection / Template Concept:
The RM engine expects a simple integer:
+2 → Buy
-2 → Sell
Everything else (0) is “no new trade”
This makes the script a template:
You can remove the Superior RBR block
Drop in your own logic (RSI, MACD, price action, etc.)
As long as you output +2 or -2 into the same signal channel, the RM engine can drive all exits and state transitions.
Aggressive vs Conservative Modes:
The input AgressiveRM (Aggressive RM) governs how we interpret signals:
Conservative Mode (Aggressive RM = false):
Uses a more filtered internal signal (AF) to open trades
Effectively waits for a clean trend flip / confirmation before new entries
Minimizes whipsaw at the cost of fewer trades
Aggressive Mode (Aggressive RM = true):
Reacts directly to the fresh alert (AO) pulses
Allows faster re-entries in the same direction after RM-based exits
Still respects your pyramiding setting; this script ships with pyramiding = 0 by default, so it will not stack multiple positions unless you change that parameter in the strategy() call.
The state machine enforces discipline on top of your signal logic, reducing double-fires and signal spam.
C. Advanced Exit Protocols (Layered Defense)
The exit side is where this template really shines. Instead of a single “take profit or stop loss,” it uses multiple, cooperating layers.
1) Hard Stop Loss
A classic percentage-based Stop Loss (SL) relative to the entry price.
Acts as a final “catastrophic protection” layer for unexpected moves.
2) Standard Trailing Stop
A percentage-based Trailing Stop (TS) that:
Activates only after price has moved a certain percentage in your favor (tsActivation)
Then trails price by a configurable percentage (ts)
This is a straightforward, battle-tested trailing mechanism.
3) Staged Take Profits (Three Levels)
The script supports three staged Take Profit levels (TP1, TP2, TP3):
Each stage has:
Activation percentage (how far price must move in your favor)
Trailing amount for that stage
Position percentage to close
Example setup:
TP1:
Activate at +10%
Trailing 5%
Close 10% of the position
TP2:
Activate at +20%
Trailing 10%
Close another 10%
TP3:
Activate at +30%
Trailing 5%
Close the remaining 80% (“runner”)
You can tailor these quantities for partial scaling out vs. letting a core position ride.
4) Advanced Adaptive Trailing Stop (AATS)
AATS is a sophisticated volatility- and structure-aware stop:
Uses Hirashima Sugita style levels (HSRS) to model “floors” and “ceilings” of price:
Dungeon → Lower floors → Mid → Upper floors → Penthouse
These levels classify where current price sits within a long-term distribution.
Combines HSRS with Bollinger-style envelopes and EMAs to determine:
Is price extended far into the upper structure?
Is it compressed near the lower ranges?
From this, it computes an adaptive factor that controls how tight or loose the trailing level (aATS / bATS) should be:
High Volatility / Penthouse areas:
Stop loosens to avoid getting wicked out by inevitable spikes.
Low Volatility / compressed structure:
Stop tightens to lock in and protect profit.
AATS is designed to be the “smart last line” that responds to context instead of a single fixed percentage.
5) RSI-Style Stop (RSIS)
On top of AATS, the script includes a RSI-like regime filter:
A McGinley Dynamic mean of price plus ATR bands creates a dynamic channel.
Crosses above the top band and below the lower band change a directional state.
When enabled (UseRSIS):
RSIS can confirm or veto AATS closes:
For longs: A shift to bearish RSIS can force exits sooner.
For shorts: A shift to bullish RSIS can do the same.
This extra layer helps avoid over-reactive stops in strong trends while still respecting a regime change when it happens.
D. Repainting Protection
Many strategies look incredible in the Strategy Tester but fail in live trading because they rely on intrabar values or future-knowledge functions.
This template is built with closed-candle realism in mind:
The Risk Management logic explicitly uses previous bar data (open , high , low , close ) for the key decisions on:
Trailing stop updates
TP triggers
SL hits
RM state transitions
No security() lookahead or future-bar access is used.
This means:
Backtest behavior is designed to match what you can actually get with TradingView alerts and live automation.
Signals may “flicker” intrabar while the candle is forming (as with any strategy), but on closed candles, the RM decisions are stable and non-repainting.
4. For Developers & Modders
We strongly encourage you to mod this script.
To plug your own strategy into the RM engine:
Look for the section titled:
// BASELINE & SIGNAL GENERATION
You will see composite logic building B1 and B2, and then selecting:
baseSig = B2
altSig = B1
finalSig = sigSwap ? baseSig : altSig
You can replace the content used to generate baseSig / altSig with your own logic, for example:
RSI crosses
MACD histogram flips
Candle pattern detectors
External condition flags
Requirements are simple:
Your final logic must output:
2 → Buy signal
-2 → Sell signal
0 → No new trade
That output flows into the RM engine via finalSig → AlertOpen → state machine → Fin.
Once you wire your signals into finalSig, the entire Risk Management system (Stops, TPs, AATS, RSIS, re-entry logic, weekend filters, long/short toggles) becomes available for your custom strategy without re-inventing the wheel.
This makes Superior RBR not just a strategy, but a reference architecture for serious Pine dev work.
5. About Signal Lynx
Automation for the Night-Shift Nation 🌙
Signal Lynx focuses on helping traders and developers bridge the gap between indicator logic and real-world automation. The same RM engine you see here powers multiple internal systems and templates, including other public scripts like the Super-AO Strategy with Advanced Risk Management.
We provide this code open source under the Mozilla Public License 2.0 (MPL-2.0) to:
Demonstrate how Adaptive Logic and structured Risk Management can outperform static, one-layer indicators
Give Pine Script users a battle-tested RM backbone they can reuse, remix, and extend
If you are looking to automate your TradingView strategies, route signals to exchanges, or simply want safer, smarter strategy structures, please keep Signal Lynx in your search.
License: Mozilla Public License 2.0 (Open Source).
If you make beneficial modifications, please consider releasing them back to the community so everyone can benefit.

Retracement Strategy [OmegaTools]Retracement Strategy is a systematic trend–retracement framework designed to identify directional opportunities after a confirmed momentum shift, and to manage exits using either trend reversals or overextension conditions. It is built around a smoothed RSI regime filter and a simple, price-based retracement trigger, making it applicable across a wide range of markets and timeframes while remaining transparent and easy to interpret.
The strategy begins by defining the underlying trend through a two-stage RSI signal. A standard RSI is computed over the user-defined Length input, then smoothed with a short moving average to reduce noise. Two symmetric thresholds are derived from the Threshold parameter: an upper band at 100 minus the threshold and a lower band at the threshold itself. When the smoothed RSI crosses above the upper band, the environment is classified as bullish and the internal trend state is set to uptrend. When the smoothed RSI crosses below the lower band, the environment is classified as bearish and the trend state becomes downtrend. When RSI moves back into the central zone between the two bands, the trend is considered neutral. In addition to the current trend, the strategy tracks the last non-neutral trend direction, which is used to detect genuine trend changes rather than transient oscillations.
Once a trend is established, the strategy looks for retracement entries in the direction of that trend. For long setups in an uptrend, it computes the lowest low over the previous Length minus one bars, excluding the current bar. A long signal is generated when price dips below this recent low while the trend state remains bullish. Symmetrically, for short setups in a downtrend, it computes the highest high over the previous Length minus one bars and enters short when price spikes above this recent high while the trend state remains bearish. This logic is designed to capture pullbacks against the prevailing RSI-defined trend, entering when the market tests or slightly violates recent extremes, rather than chasing breakouts. The candles are visually coloured to reflect the detected trend, highlighting bullish and bearish environments while keeping neutral phases distinguishable on the chart. An ATR-based measure is used solely to position the “UP” and “DN” labels on the chart for clearer visualisation of entry points; it does not directly influence position sizing or stop calculation in this implementation.
Take profit and stop loss behaviour are fully parameterized through the “Take Profit” and “Stop Loss” inputs, each offering three modes: None, Trend Change and Extension. When “Trend Change” is selected for the take profit, the strategy will only exit profitable positions when a confirmed trend reversal occurs. For a long position, this means that the strategy will close the trade when the trend state flips from uptrend to downtrend, and the last recorded trend direction validates that this is a genuine reversal rather than a neutral fluctuation; the same logic applies symmetrically for short positions. When “Extension” is selected as the take profit mode, the strategy closes profitable long trades when the smoothed RSI reaches or exceeds the upper threshold, interpreted as an overbought extension within the bullish regime, and closes profitable short trades when the smoothed RSI falls to or below the lower threshold, interpreted as an oversold extension within the bearish regime. When “None” is chosen, the strategy does not apply any explicit take profit logic, leaving trades to be managed by the stop loss settings or by user discretion in backtesting.
The stop loss parameter works in a parallel way. With “Trend Change” selected as stop loss, any open long position is closed when the trend flips from uptrend to downtrend, regardless of whether the trade is currently in profit or loss, and any open short is closed when the trend flips from downtrend to uptrend. This turns the RSI trend regime into a hard invalidation rule: once the underlying momentum structure reverses, the position is exited. With “Extension” selected for stop loss, long positions are closed when RSI falls back below the upper band and moves towards the opposite side of the range, while short positions are closed when RSI rises above the lower band and moves towards the upper side. In practice, this acts as a dynamic exit based on the oscillator moving out of a favourable context for the existing trade. Selecting “None” for stop loss disables these automatic exits, leaving only the take profit logic, if any, to manage the position. Because take profit and stop loss configuration are independent, the user can construct different profiles, such as pure trend-change exits on both sides, pure overextension exits, or a mix (for example, take profit on overextension and stop loss on trend reversal).
This strategy is designed as an analytical and backtesting framework rather than a finished plug-and-play trading system. It does not include position sizing, risk-per-trade controls, multi-timeframe confirmation, volatility filters or instrument-specific fine-tuning. Its primary purpose is to provide a clear, rule-based structure for testing retracement logic within RSI-defined trends, and to allow users to explore how different exit regimes (trend-change based versus extension based) affect performance on their instruments and timeframes of interest.
Nothing in this script or its description should be interpreted as financial advice, investment recommendation or solicitation to buy or sell any financial instrument. Past performance on backtests does not guarantee future results. The behaviour of this strategy can vary significantly across symbols, timeframes and market conditions, and correlations, volatility and liquidity can change without warning. Before considering any live application, users should thoroughly backtest and forward test the strategy on their own data, adjust parameters to their risk profile and instrument characteristics, and integrate proper money management and trade management rules. Use of this script is entirely at the user’s own risk.

Semi-Martingala Sicura 1.20x PROIncrements or a maximum amount of 200. If the previous trade is profitable, the count is reset and the initial amount is resumed. Exit management uses fixed percentage stop loss and take profit, set relative to the entry price. In summary, this strategy aims to capitalize on trend and momentum signals, using a semi-martingale system to increase positions in case of losses, but with precise limits to contain risk. Note: This method aims to be "safer" than a classic martingale, respecting increment limits and a maximum amount.
Comment by saying what you think and what I could change.

TSI.LTA | Base BTC 1DTSI.LTA | Base BTC 1D is a closed‑source trend‑following strategy designed for BTC on the 1D timeframe .
It focuses on participating in the main directional moves of the market while avoiding as much short‑term noise as possible.
📊 The script:
Uses a combination of moving‑average–based filters and volatility bands to define the active trend.
Applies optional volume filters to avoid low‑participation or exhausted moves.
Includes risk‑management controls (Stop Loss, Take Profit, Trailing Stop) that work on a per‑trade basis.
All entries and exits are confirmed at bar close and the script does not repaint .
This makes it suitable for backtesting, alerts and external automation.
█ 💡 CONCEPTS
This strategy is built around a few simple ideas:
1 — Trend first.
Positions are only taken when a group of smoothed trend filters agree on direction.
The goal is to ride larger swings, not to scalp each fluctuation.
2 — Volatility awareness.
Standard‑deviation–based bands help avoid entries in abnormal spikes or during very compressed ranges.
3 — Participation filter.
Optional volume‑based conditions (VWMA, OBV slope, MFI, volume Z‑score) try to ensure that entries occur when the market shows enough activity, not during dead phases.
4 — Risk defined in advance.
Stop‑loss and trailing‑stop inputs are expressed as percentages relative to entry price, so users can align them with their own risk tolerance.
The logic is purposely conservative: it is expected to stay flat during parts of the market where the trend is unclear or participation is weak.
█ ⚙️ FEATURES & INPUTS
This section follows approximately the order of the script’s inputs, so users can read here and then match what they see in the “Inputs” tab.
1 — 📐 Trend filters
These inputs control how the strategy detects the underlying trend:
DEMA / Gaussian / SMMA lengths
Control how fast or slow the trend reacts to price changes.
Shorter lengths → more responsive, more trades, more noise.
Longer lengths → slower reaction, fewer trades, more filtering.
Volatility Bands (SD length & multipliers)
Standard‑deviation bands around the smoothed price series.
They are used to avoid entries during extreme moves or very narrow ranges where a breakout is not yet confirmed.
In practice, these settings let the user choose between a more “aggressive” trend follower (shorter lengths, smaller bands) or a more “patient” one.
2 — 📊 Volume filters (optional)
These filters are meant to restrict trades to periods where the market shows meaningful participation:
VWMA filter
Requires price to be aligned with a Volume‑Weighted Moving Average, which de‑emphasizes moves on very low volume.
OBV slope filter
Uses the slope of On‑Balance Volume to check that net volume flow supports the direction of the trade.
MFI band filter
Uses the Money Flow Index to avoid taking new entries in zones that often correspond to exhaustion (extreme values defined by the user).
Volume Z‑Score
Compares current volume to its recent history. Trades can be restricted when volume is unusually low or out of character for that period.
When any of these filters are turned off, the strategy relies only on price‑based trend and volatility logic.
When they are on, trades are more selective and may be fewer.
3 — 🛡️ Risk management
These inputs define how individual trades are managed once entered.
They do not change the trend logic itself:
Stop Loss (%)
A percentage move against the entry price that will close the position.
Typical values on BTC 1D remain in the single‑digit range so that no single trade risks an unrealistic portion of equity.
Take Profit (%)
An optional fixed target that closes the trade when price has moved a chosen percentage in favor.
This can be disabled if the user prefers to let the trend filters perform the exit.
Trailing Stop (%)
A stop that follows the most favorable price reached since entry.
When the “use lower timeframe peak” option is enabled, peaks can be detected on a lower timeframe for more granular trailing, while decisions still occur at the close of the 1D bar.
Fixed SL/TP Price and Activation Date
Allow defining absolute price levels and a date from which they start applying.
This is useful when the user wants structural protection around known price zones.
The combination of these controls determines how deep a pullback the user is willing to tolerate and how much profit they are prepared to give back in order to stay in trends.
4 — 🚫 Filter failure & cooldown
To avoid over‑trading in difficult environments, the script can:
Automatically exit when filters remain unfavorable for a configurable number of bars.
Enter a cooldown period, during which no new trades are taken, even if some conditions improve.
These mechanisms are intended to protect capital during choppy or low‑quality phases rather than force constant exposure.
█ 📚 HOW TO USE
A suggested process for using this strategy as a study tool:
1 — Start on BTC 1D.
Apply the script to BTCUSD or BTC/USDT on the 1D timeframe, with default inputs.
2 — Open the Strategy Tester.
Choose a time window (for example a full halving cycle, a crash + recovery period, or just the most recent bull leg).
3 — Compare with Buy & Hold.
For the same window, look at:
Net profit of the strategy vs Buy & Hold.
Max drawdown of the strategy vs Buy & Hold.
The goal is not to hit a particular number, but to see whether, in that window, the strategy manages to:
Provide a smoother equity curve (lower drawdown),
While still performing at least as well as, or better than, simply holding the asset.
4 — Experiment with risk inputs.
Vary Stop Loss, Trailing Stop and the volume filters.
After each change, re‑check the same two questions above. This should make clear how each input affects the trade‑off between participation and risk.
5 — Forward‑test.
Before using any configuration with real capital, let it run for a while in paper‑trading or demo conditions.
█ 🚧 LIMITATIONS
The strategy is built and tuned primarily for BTC on 1D.
It can be used on other symbols and timeframes, but behavior may differ and requires new testing.
In very tight ranges or during event‑driven gaps, trend logic may enter later than discretionary trading would. This is expected for a conservative trend‑following approach.
Results from historical backtests depend on data quality, broker settings, fees and slippage configured in the Strategy Tester.
█ 📝 NOTES
Signals are generated on bar close.
The script is closed‑source, but the description explains the main ideas so users and moderators can understand what it does and how to use it.
The HUD on the chart is meant as a compact summary of the same statistics available in the Strategy Tester; it simply makes comparisons quicker.
█ ⚠️ DISCLAIMER
This strategy is provided for educational and research purposes only .
It is not financial advice and does not recommend any specific trades, assets, position sizes, or risk levels.
Users are fully responsible for:
Choosing their own risk parameters (Stop Loss, Take Profit, Trailing Stop, position sizing, etc.).
Testing the script on the markets and timeframes they intend to trade.
Verifying that any configuration is appropriate for their capital, risk tolerance and jurisdiction.
Past performance in backtests or examples does not guarantee future results.
Always test carefully before considering any live deployment.

週一普跌策略 Monday shit Strategy Strategy Description / 策略敘述
EN
This strategy takes a short position at the start of each Monday, based on the hypothesis that cryptocurrency markets tend to experience post-weekend risk-off behavior.
The system enters a full-equity short position at the Tokyo open (Taipei 08:00), aiming to capture Monday downside pressure resulting from accumulated weekend information and macro sentiment adjustments when traditional financial markets reopen.
Risk management uses fixed percentage take-profit and stop-loss levels, emphasizing asymmetric reward-to-risk (large occasional gains, small frequent losses).
The model reflects the increasing alignment between crypto price behavior and traditional financial market cycles.
ZH-TW
本策略於每週一開盤時做空,基於假設加密資產在週末後具有風險釋放與補跌傾向。
系統會在台北時間早上 08:00 以全倉做空,目標捕捉因週末累積消息與傳統金融市場重新開盤所造成的下跌壓力。
風控採固定止盈、止損百分比,強調高報酬/低風險的不對稱結構(小虧多次、偶爾大賺)。
此模型反映加密貨幣市場行為與華爾街週期愈趨一致的市場現象。

ATR BuySideATR Buyside Strategy
This is a simple buy-only trading plan. It uses ATR (a tool to measure price swings) to spot when prices are rising strongly.
How it works:
Buy signal: Enter a long trade when the price moves above a moving support line (based on ATR)
Sell signals: Close if the trend turns down (quick market sell).
Stop loss: Follows the support line to protect gains.
Take profit: Sell at 2 times the recent price swing (for steady wins).
Settings you can change:
ATR period: 13 (how many days to look back).
Factor: 2.0 (makes the line wider or tighter).
Use Heikin Ashi: To Filter out Noise
Great for Opt premiums like NIFTY on 15min or 30m charts. Test it first—past results don't guarantee future wins. Not advice, just a tool!

TMB Invest - Smart Money Concept StrategyEnglish:
**Quick Overview**
The "TMB_SMC_Strategy_v1.1.3" combines a classic trend filter using two EMAs with contrarian RSI entries and simple SMC elements (Fair Value Gaps & Order Blocks). Stop-loss and take-profit orders are volatility-adaptive and controlled via the ATR. An integrated dashboard displays the setup status, stop-loss/take-profit levels, entry reference, and trend, RSI, and ATR values.
---
## Operating Principle
1. **Trend Filter:** A fast EMA (default 50) is compared to a slow EMA (default 200). Trading occurs only in the direction of the trend: long in uptrends, short in downtrends.
2. **Timing via RSI:** Contrarian entries within the trend. Go long when the RSI is below a buy level (default 40); Short when the RSI is above a sell level (standard 60).
3. **Structure Check (SMC Proxy):** An "FVG Touch" serves as additional confirmation that an inefficient price zone has been tested. Order blocks are visualized for guidance but are not a direct entry trigger.
4. **Risk Management via ATR:** Stop-loss and take-profit levels are set as multipliers of the current ATR (e.g., SL = 1×ATR, TP = 2×ATR). This allows target and risk distances to adjust to market volatility.
5. **Simple Position Logic:** Only one position is held at a time (no pyramiding). After entry, stop and limit orders (bracket exit) are automatically placed.
---
## Input Values
* **EMA Fast / EMA Slow:** Lengths of the moving averages for the trend filter.
* **RSI Length / Levels:** Length of the RSI as well as buy and sell thresholds (contra signals within the trend direction).
* **Take Profit (RR) / Stop Loss (RR):** ATR multipliers for TP and SL.
* **Show FVGs & Order Blocks:** Toggles the visual SMC elements (zones/boxes) on or off.
--
## Signals & Execution
* **Long Setup:** Uptrend (fast EMA above slow EMA) **and** RSI below the buy level **and** a current FVG signal in a bullish direction.
* **Short Setup:** Downtrend (fast EMA below slow EMA) **and** RSI above the sell level **and** a current FVG touch in a bearish direction.
* **Entry & Exit:** If the setup is met, the market is entered; stop-loss/take-profit orders are placed immediately according to ATR multiples.
--
## Visualization
* **EMAs:** The fast and slow EMAs are plotted to illustrate the trend.
* **FVGs:** Fair Value Gaps are drawn as semi-transparent boxes in the trend color and projected slightly into the future.
* **Order Blocks:** Potential order block zones from the previous candle are visually highlighted (for informational purposes only).
---
## Integrated Dashboard
A compact table dashboard (bottom left) displays:
* Current **Setup Status** (Long/Short active, Long/Short ready, No Setup),
* **Stop-Loss**, **Take-Profit**, and **Entry Reference**,
* **Trend Status** (Bull/Bear/Sideways),
* **RSI Value**, and **ATR Value**.
Active long/short positions are highlighted in color (green/red).
--
## Practical Guide
1. **Place on Chart** and select the desired timeframe.
2. **Calibrate Parameters** (EMA lengths, RSI levels, ATR multipliers) to match the market and timeframe.
3. **Backtest** across different market phases; prioritize robustness over maximum curve fit.
4. **Fine-Tuning:**
* Shorter EMAs are often useful intraday (e.g., 20/100 or 34/144).
* Adjust RSI levels to market characteristics (45/55 for aggressive trading, 30/70 for conservative trading).
* Increase or decrease ATR multipliers depending on volatility/trading style.
--
## Notes, Limitations & Extensions
* **FVG Definition:** The FVG detection used here is intentionally simplified. Those who prefer a more rigorous approach can switch to a 3-candle definition and fill levels.
* **Order Blocks:** These primarily serve as a guide. Integration into entry/exit logic (e.g., retests) is possible as an extension.
* **Backtest Realism:** Fills may differ from the displayed closing price. For greater accuracy, intrabar backtests or an entry indicator based on the average position price are conceivable.
* **Alerts:** Currently, no alert conditions are defined; these can be added for long/short setups and status messages.
* **Position Management:** By default, no scaling is performed. Partial sales, trailing stops, or multiple entries can be added.
---
## Purpose & Benefits
The strategy offers a clear, modular framework: trend filter (direction), RSI contra timing (entry), SMC proxy via FVG Touch (structure), and ATR-based exits (risk adaptation). This makes it robust, easy to understand, and highly extensible—both for discretionary traders who appreciate visual SMC elements and for systematic testers who prefer a clean, parameterizable foundation.
