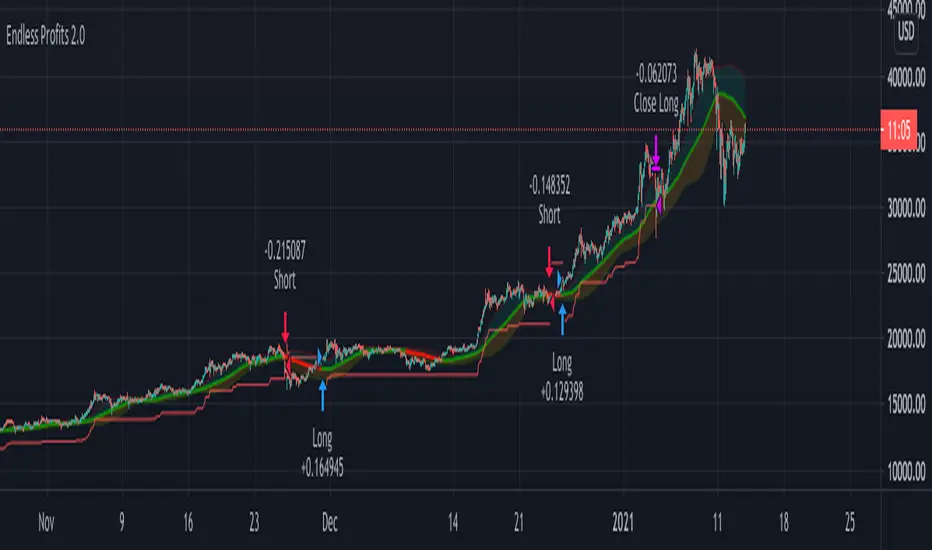
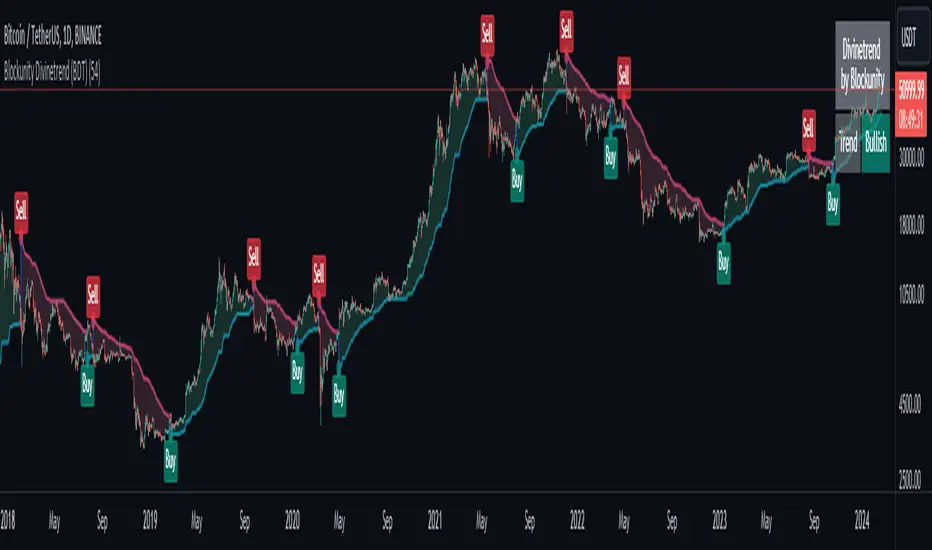
Blockunity Divinetrend (BDT)A formidable trend-following indicator, based on an ATR combined with a trailing stop mechanism. Divinetrend’s aim is to offer a simple and efficient alternative to Supertrend, another highly reputed indicator of the same type. It comes with a trading strategy that can be activated in its parameters. You can also change a number of design parameters.
Divinetrend is pretty straightforward in its approach. It calculates a base moving average taking into account the asset’s volatility, multiplies it with an ATR, then displays a line representing a trailing stop. When a red line is broken, the asset is considered to be moving back into an uptrend. Inversely, when a green line is broken, a bearish signal is sent. In the parameters, you can also activate a trend contestation period. If this parameter is activated, the price must have been trending for at least 5 days for the trend change to be validated.
Usage Advice
We recommend that you do not use this indicator with a time unit of less than 2 hours. Ideally in 4 hours or daily, or even 3 days. Otherwise, there’s nothing special about the use of this indicator. We still recommend that you use your logarithmic chart for a better visualization, but this is optional.
This indicator was designed in particular for the crypto market, but it also works on traditional market assets.
The Different Signals
Divinetrend gives buy and sell signals based on trailing stop line breaks and trend orientation. In particular, it can be used for trend identification and following. If the Contested Trend option is activated in the settings, the indicator will also display a contested period in blue. In this case, it is necessary to wait 5 days for the trend to be validated.
Integrated Strategy
In addition, a trading strategy is integrated into the Divinetrend indicator. This can be activated in the parameters. This is mainly there to see the results and the relevance of the indicator in the TradingView Strategy Tester. We do not recommend using it alone. As this strategy is used to study the indicator's performance, we use the following default parameters: An initial capital of 2,000 USDT with 100% of equity in order size. In other words, we'll bet the entire portfolio on each trade. To do this, we use a default stop loss of 10%, to avoid risking heavy losses. We also use a commission of 0.01% and a slippage of 3 ticks to reflect more reality.
Pesquisar nos scripts por "stop loss"
Bollinger Bands Modified (Stormer)This strategy is based and shown by trader and investor Alexandre Wolwacz "Stormer".
Overview
The strategy uses two indicators Bollinger Bands and EMA (optional for EMA).
Calculates Bollinger Bands, EMA, highest high, and lowest low values based on the input parameters, evaluating the conditions to determine potential long and short entry signals.
The conditions include checks for crossovers and crossunders of the price with the upper and lower Bollinger Bands, as well as the position of the price relative to the EMA.
The script also incorporates the option to add an inside bar pattern check for additional information.
Entry Position
Long Position:
Price cross over the superior band of bollinger bands.
The EMA is used to add support for trend analysis, it is an optional input, when used, it checks if price is above EMA.
Short Position:
Price cross under the inferior band of bollinger bands.
The EMA is used to add support for trend analysis, it is an optional input, when used, it checks if price is under EMA.
Risk Management
Stop Loss:
The stop loss is calculated based on the input highest high (for short position) and lowest low (for long position).
It gets the length based on the input from the last candles to set which is the highest high and which is the lowest low.
Take Profit:
According to the author, the profit target should be at least 1:1.6 the risk, so to have the strategy mathematically positive.
The profit target is configured input, can be increased or decreased.
It calculates the take profit based on the price of the stop loss with the profit target input.

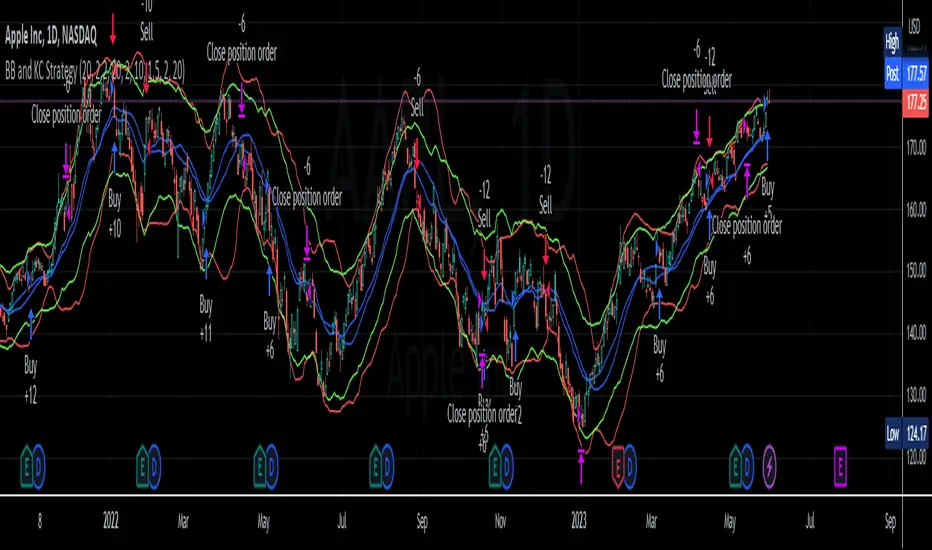
BB and KC StrategyThis script is designed as a TradingView strategy that uses Bollinger Bands (BB) and Keltner Channels (KC) as the primary indicators for generating trade signals. It aims to catch potential market trends by comparing the movements of these two popular volatility measures.
Key aspects of this strategy:
1. **Bollinger Bands and Keltner Channels:** Both are volatility-based indicators. The Bollinger Bands consist of a middle band (simple moving average) and two outer bands calculated based on standard deviation, which adjusts itself to market conditions. Keltner Channels are a set of bands placed above and below an exponential moving average of the price. The distance between the bands is calculated based on the Average True Range (ATR), a measure of price volatility.
2. **Entry Signals:** The strategy enters a long position when the upper KC line crosses above the upper BB line and the volume is above its moving average. Conversely, it enters a short position when the lower KC line crosses below the lower BB line and the volume is above its moving average.
3. **Exit Signals:** The strategy exits a position under two conditions. First, if the trade has been open for a certain number of bars defined by the user (default 20 bars). Second, a stop loss and trailing stop are in place to limit potential losses and lock in profits as the price moves favorably. The stop loss is set at a percentage of the entry price (default 1.5% for long and -1.5% for short), and the trailing stop is also a percentage of the entry price (default 2%).
4. **Trade Quantity:** The script allows specifying the investment amount for each trade, set to a default of 1000 currency units.
Remember, this is a strategy script, which means it is used for backtesting and not for real-time signals or live trading. It is also recommended that it is used as a tool to aid your trading, not as a standalone system. As with any strategy, it should be tested over different market conditions and used in conjunction with other aspects of technical and fundamental analysis to ensure robustness and effectiveness.
AUTOMATIC GRID BOT STRATEGY [ilovealgotrading]
OVERVIEW:
This Grid trading strategy can help you maximize your profit in a ranging sideways market with no clear direction.
INDICATOR:
We can get some money by taking advantage of the movement of the price between the range we have determined.
Short positions are opened while the price is rising, long positions are opened while the price is falling.
Therefore, there is no need to predict the trend direction.
What is different in this indicator:
I want to say thank you to © thequantscience. His GRID SPOT TRADING ALGORITHM - GRID BOT TRADING strategy helped me when I was writing my indicator.
I want to explain what I have improved:
1- Grid strategy is a type of strategy that can be traded in very short time frames and users can trade this strategy algorithmically by connecting this strategy to their own accounts with the help of API systems. For this reason, I have developed a software that can give us signals by dynamically changing the long and short messages when users are trading.
2- We can change the start and end dates of our grid bot as we want. It is necessary to use this setting when setting up automatic bots, so that previously opened transactions are not taken into account.
3 - Lot or quantity size should not be excessively small when users are taking automatic trades because exchanges have limitations, to avoid this problem, I have prevented this error by automatically rounding up to the nearest quantity size inside the software.
4 - Users can avoid excessive losses by using stop loss on this grid bot if they wish.
5 - When our price is over the range high or below the range low, our open positions are closed, if the stop button is active. We can also change which close price time frame we take as a basis from the settings.
6 -Users can set how many dollars they can enter per transaction while performing their transactions automatically.
IMPLEMENTATION DETAILS – SETTINGS:
This script allows the user to choose the highs and lows leves of our range. Our bot trades in the specified range.
1. This strategy allows us to set start and end backtest dates.
2. We can change range high and range low leves of our bot
3. IF people want to trade algorithmically with the help of this bot, there are 6 different input systems that will receive the Json codes as an alarm
4. IF the price closes above the upper line or below the lower line, all transactions will be closed. We can determine in which time frame our transactions will be stopped if the price closes outside these levels.We can adjust how our bot works by activating or turning off the Stop Loss button.
5. In this strategy, you can determine your dollar cost for per position.
6. The user can also divide the interval we have determined into 10 parts or 20 equal parts.
7. The grid is divided and colored at the interval we set. At the same time, if we don't want we can turn off colored channels.
Notes:
If you're going to connect this bot to an automatic Long and Short direction,
Don’t forget! you need to Webhook URL,
Don’t miss paste this code to your message window {{strategy.order.alert_message}}
ALSO:
Set your range below the support zones and above the resistance zones.
Don't be afraid to take a wide range, it doesn't matter if you make a little money, the important thing is that you don't lose money.
If you have any ideas what to add to my work to add more sources or make calculations cooler, suggest in DM .

JS-TechTrading: VWAP Momentum_Pullback StrategyGeneral Description and Unique Features of this Script
Introducing the VWAP Momentum-Pullback Strategy (long-only) that offers several unique features:
1. Our script/strategy utilizes Mark Minervini's Trend-Template as a qualifier for identifying stocks and other financial securities in confirmed uptrends.
NOTE: In this basic version of the script, the Trend-Template has to be used as a separate indicator on TradingView (Public Trend-Template indicators are available on TradingView – community scripts). It is recommended to only execute buy signals in case the stock or financial security is in a stage 2 uptrend, which means that the criteria of the trend-template are fulfilled.
2. Our strategy is based on the supply/demand balance in the market, making it timeless and effective across all timeframes. Whether you are day trading using 1- or 5-min charts or swing-trading using daily charts, this strategy can be applied and works very well.
3. We have also integrated technical indicators such as the RSI and the MA / VWAP crossover into this strategy to identify low-risk pullback entries in the context of confirmed uptrends. By doing so, the risk profile of this strategy and drawdowns are being reduced to an absolute minimum.
Minervini’s Trend-Template and the ‘Stage-Analysis’ of the Markets
This strategy is a so-called 'long-only' strategy. This means that we only take long positions, short positions are not considered.
The best market environment for such strategies are periods of stable upward trends in the so-called stage 2 - uptrend.
In stable upward trends, we increase our market exposure and risk.
In sideways markets and downward trends or bear markets, we reduce our exposure very quickly or go 100% to cash and wait for the markets to recover and improve. This allows us to avoid major losses and drawdowns.
This simple rule gives us a significant advantage over most undisciplined traders and amateurs!
'The Trend is your Friend'. This is a very old but true quote.
What's behind it???
• 98% of stocks made their biggest gains in a Phase 2 upward trend.
• If a stock is in a stable uptrend, this is evidence that larger institutions are buying the stock sustainably.
• By focusing on stocks that are in a stable uptrend, the chances of profit are significantly increased.
• In a stable uptrend, investors know exactly what to expect from further price developments. This makes it possible to locate low-risk entry points.
The goal is not to buy at the lowest price – the goal is to buy at the right price!
Each stock goes through the same maturity cycle – it starts at stage 1 and ends at stage 4
Stage 1 – Neglect Phase – Consolidation
Stage 2 – Progressive Phase – Accumulation
Stage 3 – Topping Phase – Distribution
Stage 4 – Downtrend – Capitulation
This strategy focuses on identifying stocks in confirmed stage 2 uptrends. This in itself gives us an advantage over long-term investors and less professional traders.
By focusing on stocks in a stage 2 uptrend, we avoid losses in downtrends (stage 4) or less profitable consolidation phases (stages 1 and 3). We are fully invested and put our money to work for us, and we are fully invested when stocks are in their stage 2 uptrends.
But how can we use technical chart analysis to find stocks that are in a stable stage 2 uptrend?
Mark Minervini has developed the so-called 'trend template' for this purpose. This is an essential part of our JS-TechTrading pullback strategy. For our watchlists, only those individual values that meet the tough requirements of Minervini's trend template are eligible.
The Trend Template
• 200d MA increasing over a period of at least 1 month, better 4-5 months or longer
• 150d MA above 200d MA
• 50d MA above 150d MA and 200d MA
• Course above 50d MA, 150d MA and 200d MA
• Ideally, the 50d MA is increasing over at least 1 month
• Price at least 25% above the 52w low
• Price within 25% of 52w high
• High relative strength according to IBD.
NOTE: In this basic version of the script, the Trend-Template has to be used as a separate indicator on TradingView (Public Trend-Template indicators are available in TradingView – community scripts). It is recommended to only execute buy signals in case the stock or financial security is in a stage 2 uptrend, which means that the criteria of the trend-template are fulfilled.
This strategy can be applied to all timeframes from 5 min to daily.
The VWAP Momentum-Pullback Strateg y
For the JS-TechTrading VWAP Momentum-Pullback Strategy, only stocks and other financial instruments that meet the selected criteria of Mark Minervini's trend template are recommended for algorithmic trading with this startegy.
A further prerequisite for generating a buy signals is that the individual value is in a short-term oversold state (RSI).
When the selling pressure is over and the continuation of the uptrend can be confirmed by the MA / VWAP crossover after reaching a price low, a buy signal is issued by this strategy.
Stop-loss limits and profit targets can be set variably.
Relative Strength Index (RSI)
The Relative Strength Index (RSI) is a technical indicator developed by Welles Wilder in 1978. The RSI is used to perform a market value analysis and identify the strength of a trend as well as overbought and oversold conditions. The indicator is calculated on a scale from 0 to 100 and shows how much an asset has risen or fallen relative to its own price in recent periods.
The RSI is calculated as the ratio of average profits to average losses over a certain period of time. A high value of the RSI indicates an overbought situation, while a low value indicates an oversold situation. Typically, a value > 70 is considered an overbought threshold and a value < 30 is considered an oversold threshold. A value above 70 signals that a single value may be overvalued and a decrease in price is likely , while a value below 30 signals that a single value may be undervalued and an increase in price is likely.
For example, let's say you're watching a stock XYZ. After a prolonged falling movement, the RSI value of this stock has fallen to 26. This means that the stock is oversold and that it is time for a potential recovery. Therefore, a trader might decide to buy this stock in the hope that it will rise again soon.
The MA / VWAP Crossover Trading Strategy
This strategy combines two popular technical indicators: the Moving Average (MA) and the Volume Weighted Average Price (VWAP). The MA VWAP crossover strategy is used to identify potential trend reversals and entry/exit points in the market.
The VWAP is calculated by taking the average price of an asset for a given period, weighted by the volume traded at each price level. The MA, on the other hand, is calculated by taking the average price of an asset over a specified number of periods. When the MA crosses above the VWAP, it suggests that buying pressure is increasing, and it may be a good time to enter a long position. When the MA crosses below the VWAP, it suggests that selling pressure is increasing, and it may be a good time to exit a long position or enter a short position.
Traders typically use the MA VWAP crossover strategy in conjunction with other technical indicators and fundamental analysis to make more informed trading decisions. As with any trading strategy, it is important to carefully consider the risks and potential rewards before making any trades.
This strategy is applicable to all timeframes and the relevant parameters for the underlying indicators (RSI and MA/VWAP) can be adjusted and optimized as needed.
Backtesting
Backtesting gives outstanding results on all timeframes and drawdowns can be reduced to a minimum level. In this example, the hourly chart for MCFT has been used.
Settings for backtesting are:
- Period from April 2020 until April 2021 (1 yr)
- Starting capital 100k USD
- Position size = 25% of equity
- 0.01% commission = USD 2.50.- per Trade
- Slippage = 2 ticks
Other comments
• This strategy has been designed to identify the most promising, highest probability entries and trades for each stock or other financial security.
• The RSI qualifier is highly selective and filters out the most promising swing-trading entries. As a result, you will normally only find a low number of trades for each stock or other financial security per year in case you apply this strategy for the daily charts. Shorter timeframes will result in a higher number of trades / year.
• As a result, traders need to apply this strategy for a full watchlist rather than just one financial security.

Minervini Pullback Strategy_Trend-Template QualifierGeneral Description and Unique Features of this Script
Introducing the ultimate trend-following (long-only) strategy that offers a unique feature you won't find anywhere else!
1. Our script/strategy utilizes Mark Minervini's Trend-Template as a qualifier for identifying stocks and other financial securities in confirmed uptrends. Mark Minervini, a 3x US Investment Champion, developed the Trend-Template, which covers eight different and independent characteristics that can be adjusted and optimized in this trend-following strategy to ensure the best results. The strategy will only trigger buy-signals in case the optimized qualifiers are being met.
2. Our strategy is based on supply/demand balance in the market, making it timeless and effective across all timeframes. Whether you're day trading using 1- or 5-min charts or swing-trading using daily charts, this strategy can be applied and works very well.
3. We also incorporate technical indicators such as RSI and MACD to identify low-risk pullback entries in the context of confirmed uptrends. By doing so, the risk profile of this strategy and drawdowns are being reduced to an absolute minimum, giving you peace of mind while trading.
Minervini’s Trend-Template and the ‘Stage-Analysis’ of the Markets
This strategy is a so-called 'long-only' strategy. This means that we only take long positions, short positions are not considered.
The best market environment for such strategies are periods of stable upward trends in the so-called stage 2 - uptrend.
In stable upward trends, we increase our market exposure and risk.
In sideways markets and downward trends or bear markets, we reduce our exposure very quickly or go 100% to cash and wait for the markets to recover and improve. This allows us to avoid major losses and drawdowns.
This simple rule gives us a significant advantage over most undisciplined traders and amateurs!
'The Trend is your Friend'. This is a very old but true quote.
What's behind it???
• 98% of stocks made their biggest gains in a Phase 2 upward trend.
• If a stock is in a stable uptrend, this is evidence that larger institutions are buying the stock sustainably.
• By focusing on stocks that are in a stable uptrend, the chances of profit are significantly increased.
• In a stable uptrend, investors know exactly what to expect from further price developments. This makes it possible to locate low-risk entry points.
The goal is not to buy at the lowest price – the goal is to buy at the right price!
Each stock goes through the same maturity cycle – it starts at stage 1 and ends at stage 4
Stage 1 – Neglect Phase – Consolidation
Stage 2 – Progressive Phase – Accumulation
Stage 3 – Topping Phase – Distribution
Stage 4 – Downtrend – Capitulation
This strategy focuses on identifying stocks in confirmed stage 2 uptrends. This in itself gives us an advantage over long-term investors and less professional traders.
By focusing on stocks in a stage 2 uptrend, we avoid losses in downtrends (stage 4) or less profitable consolidation phases (stages 1 and 3). We are fully invested and put our money to work for us, and we are fully invested when stocks are in their stage 2 uptrends.
But how can we use technical chart analysis to find stocks that are in a stable stage 2 uptrend?
Mark Minervini has developed the so-called 'trend template' for this purpose. This is an essential part of our JS-TechTrading pullback strategy. For our watchlists, only those individual values that meet the tough requirements of Minervini's trend template are eligible.
The Trend Template
• 200d MA increasing over a period of at least 1 month, better 4-5 months or longer
• 150d MA above 200d MA
• 50d MA above 150d MA and 200d MA
• Course above 50d MA, 150d MA and 200d MA
• Ideally, the 50d MA is increasing over at least 1 month
• Price at least 25% above the 52w low
• Price within 25% of 52w high
• High relative strength according to IBD.
We have developed an algorythm (for TradingView) that uses Minervini’s trend template as a qualifier. This means that the strategy only generates trading signals in case the selected elements of the trend template are being met. The user is fully flexible to adjust the requirements of this Trend-Template qualifier:
This strategy is normally applied to the daily chart ideal for selecting individual stocks for trend-following strategies. Nevertheless, Minervini’s principles are timeless and this alogrithmic strategy with the Trend-Template qualifier can also be applied to any other timframe.
The qualifier #9 (RS-Ratings) can be modified and optimized in the strategy’s settings to fit your individual needs.
In general, it should be noted that ideally all 8/8 trend template criteria are met. Stocks or other securities that meet only some of these 8 criteria can also be very promising candidates for this strategy, provided that backtesting yields good results.
The Pullback Strategy
For the JS-TechTrading pullback strategy, only stocks and other financial instruments that meet the selected criteria of Mark Minervini's trend template are considered. If not, the strategy will not generate any signals.
Further prerequisites for generating a buy signal is that the individual value is in a short-term oversold state (RSI).
When the selling pressure is over and the continuation of the uptrend can be confirmed by the MACD after reaching a price low, a buy signal is issued by the pullback strategy.
Stop-loss limits and profit targets can be set variably.
Relative Strength Index (RSI)
The Relative Strength Index (RSI) is a technical indicator developed by Welles Wilder in 1978. The RSI is used to perform a market value analysis and identify the strength of a trend as well as overbought and oversold conditions. The indicator is calculated on a scale from 0 to 100 and shows how much an asset has risen or fallen relative to its own price in recent periods.
The RSI is calculated as the ratio of average profits to average losses over a certain period of time. A high value of the RSI indicates an overbought situation, while a low value indicates an oversold situation. Typically, a value > 70 is considered an overbought threshold and a value < 30 is considered an oversold threshold. A value above 70 signals that a single value may be overvalued and a decrease in price is likely , while a value below 30 signals that a single value may be undervalued and an increase in price is likely.
For example, let's say you're watching a stock XYZ. After a prolonged falling movement, the RSI value of this stock has fallen to 26. This means that the stock is oversold and that it is time for a potential recovery. Therefore, a trader might decide to buy this stock in the hope that it will rise again soon.
Moving Average Convergence Divergence (MACD)
The MACD (Moving Average Convergence Divergence) is a technical indicator used in both short-term and long-term trading strategies. The indicator was developed by Gerald Appel and is one of the most well-known indicators for the stock market.
The MACD consists of two lines calculated by the difference between two moving averages. The first line is a fast moving average that targets a short period of time. The second line is a slow moving average that targets a longer period of time. In addition, a trigger line is calculated, which consists of another moving average of the MACD line.
The MACD line is the difference between the fast and slow moving average.
The greater the difference between the two lines, the more likely a subsequent price increase. The lower the difference, the more likely a subsequent price drop is.
If the MACD line crosses upwards over the trigger line, this is a buy signal that signals a potential price increase. If the MACD line crosses down below the trigger line, this is a sell signal that signals a potential price weakening.
This strategy is applicable to all timeframes and the relevant parameters for the underlying indicators (RSI and MACD) can be adjusted and optimized as needed.
Backtesting
Backtesting give outstanding results on all timeframes and drawdowns can be reduced to a minimum level. Swing-Traders (daily charts) will see that the strategy does not give any buy signals during market corrections and bear markets.
Settings for backtesting are:
- Period from Jan 2000 until now
- Starting capital 100k USD
- Position size = 25% of equity
- 0.01% commission = USD 2.50.- per Trade
Other comments
• This strategy has been designed to identify the most promising, highest probability entries and trades for each stock or other financial security.
• The trend-template qualifier is highly selective and filters out the most promising swing-trading entries. As a result, you will normally only find a single-digit number of trades for each stock or other financial security per year in case you apply this strategy for the daily charts. Shorter timeframes will result in a higher number of trades / year.
• As a result, traders need to apply this strategy for a full watchlist rather than just one financial security.

X48 - Strategy | MA Type Cross + TPSL | Future&Spot | V.2Thank You For Open Source Code, This Strategy Ref. By 1.Simple Strategy Like MA Crossover For Long/Short or Spot Trade, 2. CDC Action Zone V.2 for BarPaint
This Strategy Mixing With MA Crossover Strategy and BarPaint By CDC Action Zone and TP/SL by Varbara
### How To Use Strategy : Setting EMA/SMA Crossover EMA/SMA, Any Value If You Want
For Long Position : Cross Up
For Short Position : Cross Down
Can Use With Spot Trade : Cross Up = Buy, Cross Down = Sell
TP/SL When Your OrderSize Change From any % Of Your TP/SL Value
### In Strategy Setting
Intitial Capital = Ex. 200
Order Size = Should Be Money Management Not Use 100% of Capital Ex. 10% of Capital (200$) = Order Size 20$
StopLoss and Take Profit = If You Run Trend TF 4H+ or 1D+ You Can Change TP% = 1,000% for nonlimit and Stop Loss 5 - 20% from your order size
Ex. Stoploss 15% = OrderSize / 100 x %SL = 20$/100 x 15% = 3$ Loss from order size 20$ (if you not set stop loss.)
Base Currency = (Your Currency) # Ex. USD
Commission = (Your Trading Fee) # Ex. Future Fee Can Check At Binance Fee Rate > www.binance.com > Choose Your Fee Type, Ex. USD M Future (Regular User) = 0.02 (Maker), 0.04 (Taker)
Commission Symbol Type = % # (Ref. By Binance Fee Rate)
### Notice ####
Default Setting It's Realistic From Normal Life Ex. Capital 200$ / Ordersize 20$ (10%)/ Commission 0.1% (Buy+Sell) / Slippage = 2 / TP = 1000% (nonlimit) / SL = 15%/OrderSize
Low Risk But High Return, Good Luck
### Bot Auto Trade by X4815162342 ###
if you wanna try my bot auto trade X48-3in1-bot : Contact My Line ID : x4815x
Full Command Alert For This Strategy If You Wanna See It's
'{"ex":"'+markettype+'","side": "'+longcommand+'", "amount": "@{{strategy.order.contracts}}", "symbol": "{{ticker}}", "passphrase": "'+passphrase+'","leverage":"'+str.tostring(leveragex)+'"}'
'{"ex":"'+markettype+'","side": "'+shortcommand+'", "amount": "@{{strategy.order.contracts}}", "symbol": "{{ticker}}", "passphrase": "'+passphrase+'","leverage":"'+str.tostring(leveragex)+'"}'
But Easy Than Full Command Just Use Thisssssss !! Strategy Be Manage Auto Long and Short or TPSL Position
You Don't Do Anything Just Use This Message to Alerts Message
{{strategy.order.alert_message}}
### If you don't use bot but just looking for strategy test ####
Just Pass Bot Setting Function It's Nothing Effect For Strategy !!!!!!
Let's Enjoy With Your Strategy BackTest 😁
Remember Beware Max drawdown%. I'm Recommend Lower Than 10% It's Very Good.

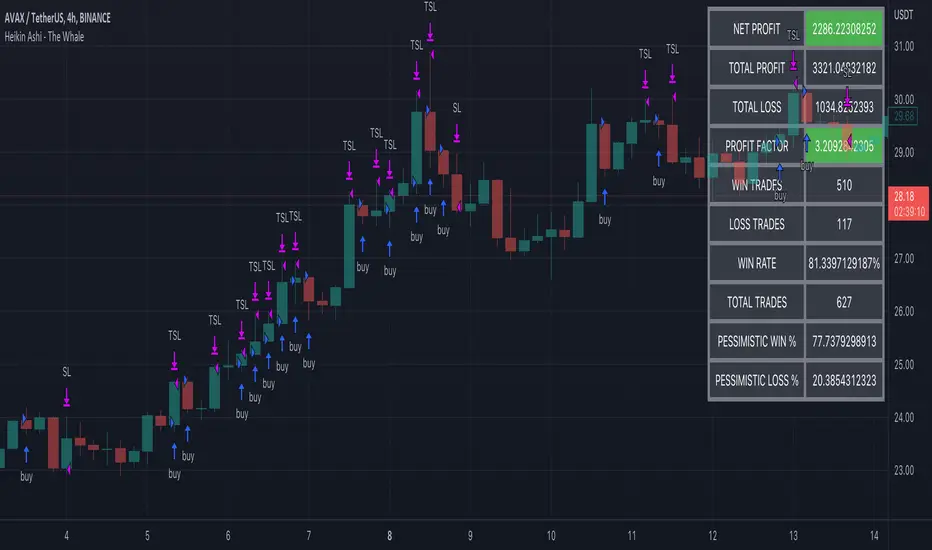
Heikin Ashi - The WhaleThe strategy is based on Heikin Ashi calculation, you do not need to switch the candle to HA.
The HA is used as a base entry, if a candle or two candles are bullish, then is valid to open a position, you can select the validation, one or two candles.
Also, the strategy mainly uses volume indicators as a confluence, you can select VWAP , VWMA , and Volume Oscillator, in addition to ADX which has two ways to validate the entry.
Base entry: One or two bullish HA candles (candles without a lower wick)
Confluence Indicators:
ADX: Will give a positive signal only if ADX is above the threshold, or if +DI is above -DI, or both.
VWAP: will give a positive signal if HA close is above VWAP.
VWMA: composite of 3 MA (20, 25, 50). There are multiple options to set it as confluence, the first option is to check if the short is bigger than the long and long is bigger than the base. The other options are to check the close status, which is bigger than which MA. You can find the description of each option in the strategy box
The sell is based on trailing stop loss (TSL), while the stop loss is based lowest X candle, the strategy will look back to the lowest number of the HA candles and set it as stop loss.
Short Swing Bearish MACD Cross (By Coinrule)This strategy is oriented towards shorting during downside moves, whilst ensuring the asset is trading in a higher timeframe downtrend, and exiting after further downside.
This script can work well on coins you are planning to hodl for long-term and works especially well whilst using an automated bot that can execute your trades for you. It allows you to hedge your investment by allocating a % of your coins to trade with, whilst not risking your entire holding. This mitigates unrealised losses from hodling as it provides additional cash from the profits made. You can then choose to hodl this cash, or use it to reinvest when the market reaches attractive buying levels. Alternatively, you can use this when trading contracts on futures markets where there is no need to already own the underlying asset prior to shorting it.
ENTRY
This script utilises the MACD indicator accompanied by the Exponential Moving Average (EMA) 450 to enter trades. The MACD is a trend following momentum indicator and provides identification of short-term trend direction. In this variation it utilises the 11-period as the fast and 26-period as the slow length EMAs, with signal smoothing set at 9.
The EMA 450 is used as additional confirmation to prevent the script from shorting when price is above this long-term moving average. Once price is above the EMA 450 the script will not open any shorts - preventing the rule from attempting to short uptrends. Due to this, this strategy is ideal for setting and forgetting.
The script will enter trades based on two conditions:
1) When the MACD signals a bearish cross. This occurs when the EMA 11 crosses below the EMA 26 within the MACD signalling the start of a potential downtrend.
2) Price has closed below the EMA 450. Price closing below this long-term EMA signals that the asset is in a sustained downtrend. Price breaking above this could indicate a bullish strength in which shorting would not be profitable.
EXIT
This script utilises a set take-profit and stop-loss from the entry of the trade. The take profit is set at 8% and the stop loss of 4%, providing a risk reward ratio of 2. This indicates the script will be profitable if it has a win ratio greater than 33%.
Take-Profit Exit: -8% price decrease from entry price.
OR
Stop-Loss Exit: +4% price increase from entry price.
Based on backtesting results across a selection of assets, the 45-minute and 1-hour timeframes are the best for this strategy.
The strategy assumes each order is using 30% of the available coins to make the results more realistic and to simulate you only ran this strategy on 30% of your holdings. A trading fee of 0.1% is also taken into account and is aligned to the base fee applied on Binance.
The backtesting data was recorded from December 1st 2021, just as the market was beginning its downtrend. We therefore recommend analysing the market conditions prior to utilising this strategy as it operates best on weak coins during downtrends and bearish conditions, however the EMA 450 condition should mitigate entries during bullish market conditions.

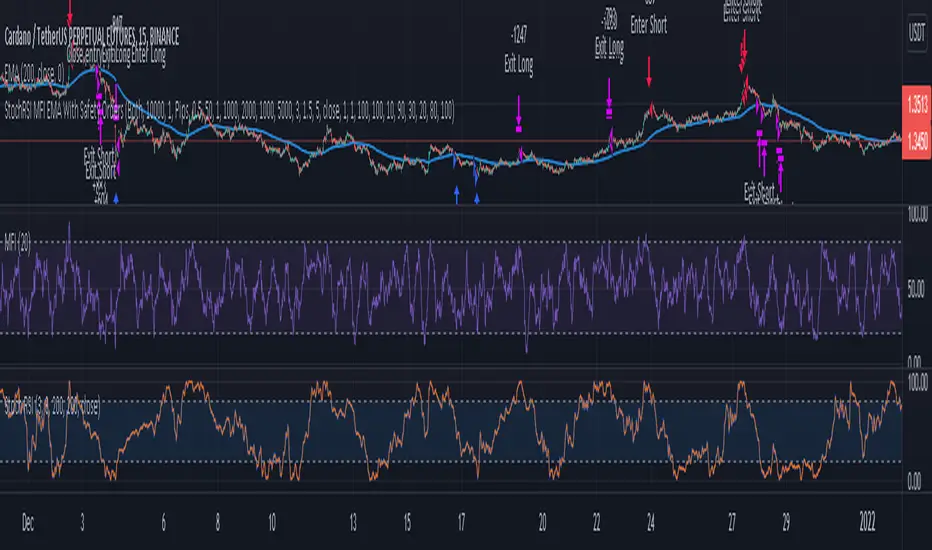
3 Indicator Strategy (StochRSI, MFI & EMA) With Safety OrdersThis strategy uses Stochastic RSI, Money Flow Index and EMA with settings for lower time-frames.
It also features safety orders based on 3 different take profit and stop loss methods.
Recommended Indicator Settings for lower time-frames;
Stoch RSI: 1,1,100,100
MFI: 30
EMA: 100
Take Profit/Stop Loss Settings:
There are 3 TP/SL types available;
- Pips -> based on minticks
- Base Value -> manually entering a value for the actual profit/loss.
- Opposite Signal -> e.g. if the current open order is long, strategy waits for the next short signal.
3Commas Visible DCA StrategyThis strategy consists of the following elements and can all be set by the user.
1. Entry by moving average cross.
1) Selection of moving average line.
- SMA(Simple Moving Average)
- EMA(Exponential Moving Average)
- HMA(Hull Moving Average)
2) Selection of Cross over / Cross under
2. Add Entry by DCA(Dollar Cost Averaging)
- A DCA strategy is the practice of investing into a currency at preset intervals to reduce the entry price of a position over time and mitigate volatility risk.
For example,
Base Order = 10 Dollar at Price 100%
Safety Order1 = 20 Dollar at Price 90%
Safety Order2 = 40 Dollar at Price 80%
Average Price => Price 80~90%
thereby getting a better average price for your position and greatly reducing risks from the consequences of volatility.
3. Target Price and Stop Loss.
1) Target Price : Realize profits at % set from the average unit price.
2) Stop Loss : Stop Loss % set from the last safety order.
You can easily find out what's related by changing the setting value after setting the strategy.
This strategy has the following Good characteristics.
1. It informs you of the assets required according to DCA settings.
If you are short of assets, a warning sign will appear.
2. Amount of assets invested in each long entry and long entry close.
3. Visibility of the lowest purchase price line and DCA purchase location according to DCA setting.
easily check the values set in the backtest.
I hope it will help you. Thank you.
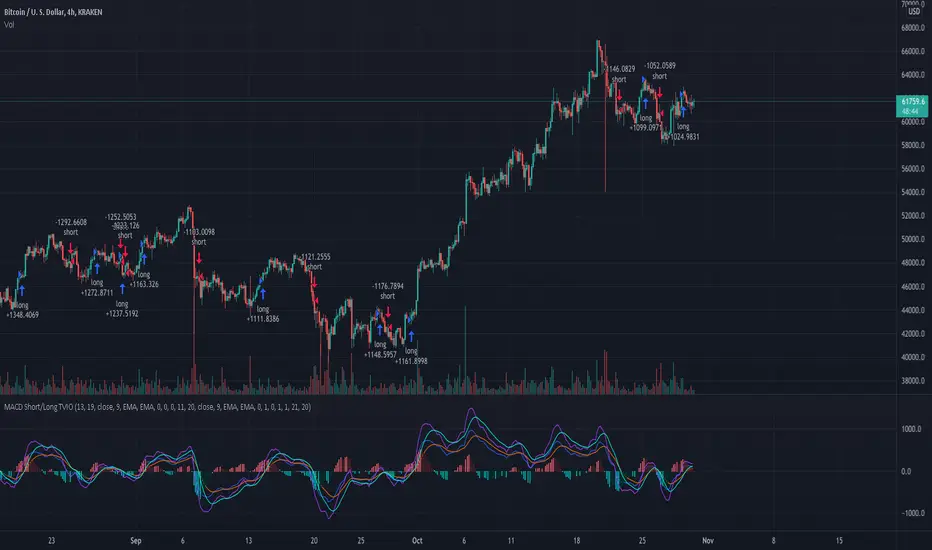
MacD Short and/or Long with Bi-Directional TP and SL This tool allows you to test any variable value for MacD and Signal for going Long or Short with each market direction having customizable values for stop loss and take profit.
For example, sometimes the MacD and Signal values are better with different lengths between Short and Long. You can use this tool to see them overlaid and determine the best settings for going one direction or the other.
This script was preset for use with XBTUSD on the 4 hour time frame. Another example with this in mind, is take profits and stop losses might not work in the Long market direction but going Short does! Without this tool that would be hard to see since typically stop loss and take profit is applied to both directions. I found with this tool that a 20% take profit seems to be a good sweet spot for going short with this strategy.
You can customize which MacD histogram you see by going to the style section and turning off the Short or Long parameters so you can see only 1 histogram at a time if you wish.
If you have any questions, please PM me.
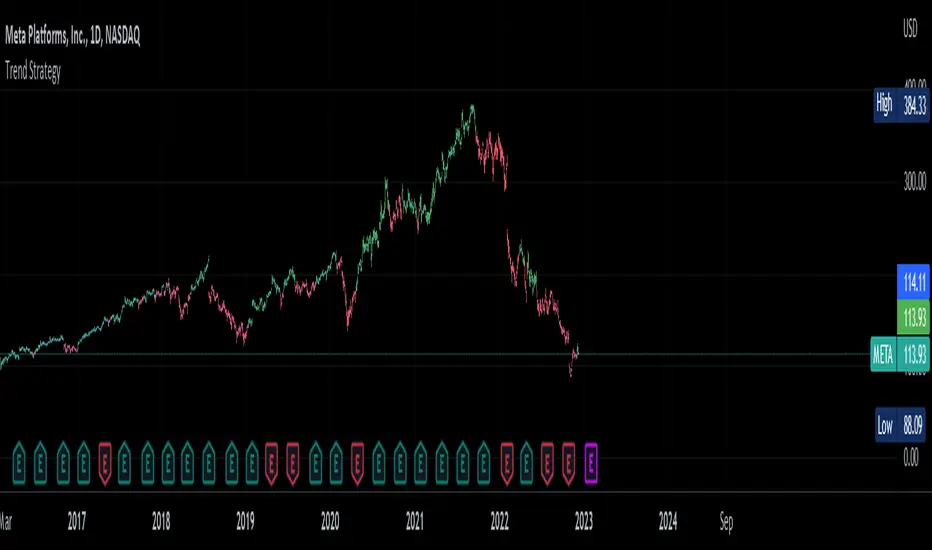
Trend Strategy by zdmreThis Strategy is a trend following indicator. It is plotted on price and the current trend can be determined by its placement vis-a-vis price. It is constructed with just three parameters: Period, Multiplier and Entry/Exit Point with Superformula.
The default parameters are 14 for Average True Range (ATR) and 4 for its multiplier. The average true range (ATR) plays a key role in ‘Trend’ as the indicator uses ATR to compute its value and it signals the degree of price volatility. You should note that any changes to these numbers can affect the use of the Trend indicator.
While you using this indicator, you should not avoid putting your stop loss.
For a long position, you can put stop loss right at the red indicator line. For a short position, you can put it at the green indicator line. You can insert your own settings as well.
Using Trend Strategy along with a stop loss pattern is the best way for earning the best wealth in trading.
There is no best setting for any trading indicator.
Price Change Scalping Strategy v1.0 - 3Commas EditionIntroduction
This strategy implements the Price Change Scalping (PCS) strategy specifically for the 3Commas platform. The Input settings have been redesigned to match the same inputs as the 3Commas My Bot Settings page. Only the "Deal Start Condition" section will echo the required PCS-related settings found in the original Price Change Scalping Strategy v1.0 to successfully implement the strategy.
The strategy uses a price rate of change (ROC) momentum calculation to determine the percent change in price between a defined range of bars. The calculated ROC value is then compared to the Upper Threshold and Lower Threshold values to determine if a trade setup is to be activated. If the threshold is crossed, a trade setup will occur based on the indicator settings. Entry, Take Profit, and Stop Loss prices are calculated and displayed on the chart. Once the Entry Price is crossed, a long or short position is created (depending on the direction) and once the Take Profit price is crossed, the position is closed. If the Entry Price is not crossed within a specific number of bars, the trade setup is canceled, and it will proceed to monitor price changes for the next set up.
How is it original and useful?
This strategy is unique in that the strategy version fully supports the TradingView backtester, which will enable you to perform experiments with various settings to evaluate performance using the historical chart data. The study version implements the "Start Deal" and "Close Deal" alerts for you to integrate with 3Comma's "Trading View Custom Signal" start condition. Both script versions will provide the same configuration abilities. The following list is a brief description of its usefulness:
Full support for all possible 3Commas bot settings.
Define a short or long trading strategy.
Price change data source and offset settings.
Your layering placement relative to the entry price.
Your trading parameters like take profit and stop loss offsets, trailing take profit support, exchange commission rates, trading start time, and order size multiplication for each layer.
Flexible trade eligibility rules that can use other chart indicators, like RSI or EMA, to exclude the selection of entry prices for trading.
The visibility of detailed statistics from the chart history pertaining to trading sessions started and closed, session durations, win rate, price action drops and bounces, as well as layer utilization.
The visibility of detailed Used Amount for Each Step table that details how each layer will be allocated for trading.
How does it compare to other scripts in the Public Library?
The strategy offers a very detailed, comprehensive settings to address all types of markets found on TradingView where you can implement the price change scalping strategy. The strategy version can be considered the first of its kind on TradingView to leverage the backtester to provide informative, detailed performance measurements surrounding this unique trading strategy. The study version will implement the latest alert framework called "Any Alert() Function" where you can create a single alert to handle multiple events, which include:
Deal Start
Deal Close
Strategy Results
The default settings are designed to define a "loose" price change settings to ensure that the indicator will render chart elements when first loaded as well as to allow the backtester to gather order executions and display performance summary. The strategy version is using $10,000 initial capital, a commission rate of 0.1% for both entries and exits, and a 1 tick slippage setting. It is also using 3.4881% of the equity for the Base Order Size, 4.7097% of equity for the first Safety Order Size. The Maximum Safety Trade Count is 7 with a Safety Order Volume Scale of 1.33, and a take profit of 2% with no stop loss. All other settings are defaults.
It is recommended that the indicator be "tuned" for your specific market to best implement the price change strategy and obtain better desirable results. You do so by scrolling through the chart's history and observing moments when prices tend to move rapidly. Measure the number or bars it typically takes for the price to change at a specific rate. Using this information, you can adjust the Price Change Settings accordingly to configure the indicator for the chart.
Always keep in mind that past performance may not be indicative of future results. Settings that seem favorable for one market may be found to be disastrous in another. Therefore, do take the time needed to understand how the settings will behave with the given chart symbol.
Enjoy! 😊👍
How to obtain access to the script?
You have two choices:
Use the "Website" link below to obtain access to this indicator, or
Send us a private message (PM) in TradingView itself.

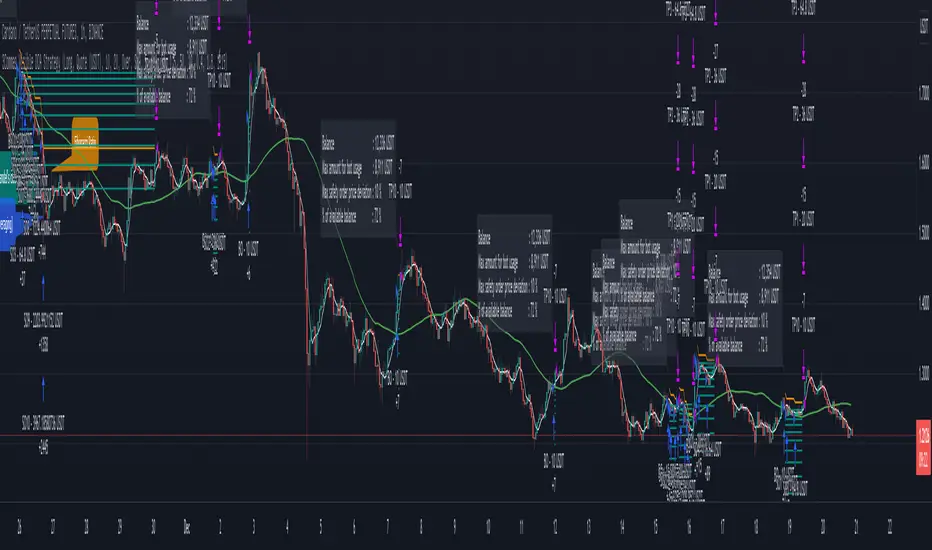
Price Change Scalping Strategy v1.0Introduction
This strategy uses a price rate of change (ROC) momentum calculation to determine the percent change in price between a defined range of bars. The calculated ROC value is then compared to the Upper Threshold and Lower Threshold values to determine if a trade setup is to be activated. If the threshold is crossed, a trade setup will occur based on the indicator settings. Entry, Take Profit, and Stop Loss prices are calculated and displayed on the chart. Once the Entry Price is crossed, a long or short position is created (depending on the direction) and once the Take Profit price is crossed, the position is closed. If the Entry Price is not crossed within a specific number of bars, the trade setup is canceled, and it will proceed to monitor price changes for the next set up.
How is it original and useful?
This strategy is unique in that the strategy version fully supports the TradingView backtester, which will enable you to perform experiments with various settings to evaluate performance using the historical chart data. The study version implements numerous custom alerts for you to build TradingView notifications around specific price action events and stay informed with market activity in real-time. Both script versions will provide the same configuration abilities where you can define:
Define a short or long trading strategy.
Price change data source and offset settings.
Your layering placement relative to the entry price.
Your trading parameters like take profit and stop loss offsets, exchange commission rates, trading start time, and order size multiplication for each layer.
Flexible trade eligibility rules that can use other chart indicators, like RSI or EMA, to exclude the selection of entry prices for trading.
The visibility of detailed statistics from the chart history pertaining to trading sessions started and closed, session durations, win rate, price action drops and bounces, as well as layer utilization.
How does it compare to other scripts in the Public Library?
The strategy offers a very detailed, comprehensive settings to address all types of markets found on TradingView where you can implement the price change scalping strategy. The strategy version can be considered the first of its kind on TradingView to leverage the backtester to provide informative, detailed performance measurements surrounding this unique trading strategy. The study version will contain numerous custom alerts to aid in your notification preferences and stay informed on the indicator's activities:
Price Crossed Above Threshold
Price Crossed Below Threshold
Enter Long Position
Exit Long Position
Enter Short Position
Exit Short Position
Price Crossed DCA Layer 1 (Long)
Price Crossed DCA Layer 2 (Long)
Price Crossed DCA Layer 3 (Long)
Price Crossed DCA Layer 4 (Long)
Price Crossed DCA Layer 5 (Long)
Price Crossed DCA Layer 6 (Long)
Price Crossed DCA Layer 7 (Long)
Price Crossed DCA Layer 8 (Long)
Price Crossed DCA Layer 1 (Short)
Price Crossed DCA Layer 2 (Short)
Price Crossed DCA Layer 3 (Short)
Price Crossed DCA Layer 4 (Short)
Price Crossed DCA Layer 5 (Short)
Price Crossed DCA Layer 6 (Short)
Price Crossed DCA Layer 7 (Short)
Price Crossed DCA Layer 8 (Short)
Strategy Results
The default settings are designed to define a "loose" price change settings to ensure that the indicator will render chart elements when first loaded as well as to allow the backtester to gather order executions and display performance summary. The strategy version is using $10,000 initial capital, a commission rate of 0.1% for both entries and exits, and a 1 tick slippage setting. It is also using 2.74506% of the equity with a Order Size Multiplier of 1.33, using 8 total DCA layers, and a take profit of 2% with no stop loss. All other settings are defaults.
It is recommended that the indicator be "tuned" for your specific market in order to best implement the price change strategy and obtain better desirable results. You do so by scrolling through the chart's history and observing moments when prices tend to move rapidly. Measure the number or bars it typcially takes for the price to change at a specific rate. Using this information, you can adjust the Price Change Settings accordingly to configure the indicator for the chart.
Always keep in mind that past performance may not be indicative of future results. Settings that seem favorable for one market may be found to be disastrous in another. Therefore, do take the time needed to understand how the settings will behave with the given chart symbol.
Enjoy! 😊👍
How to obtain access to the script?
You have two choices:
Use the "Website" link below to obtain access to this indicator, or
Send us a private message (PM) in TradingView itself.

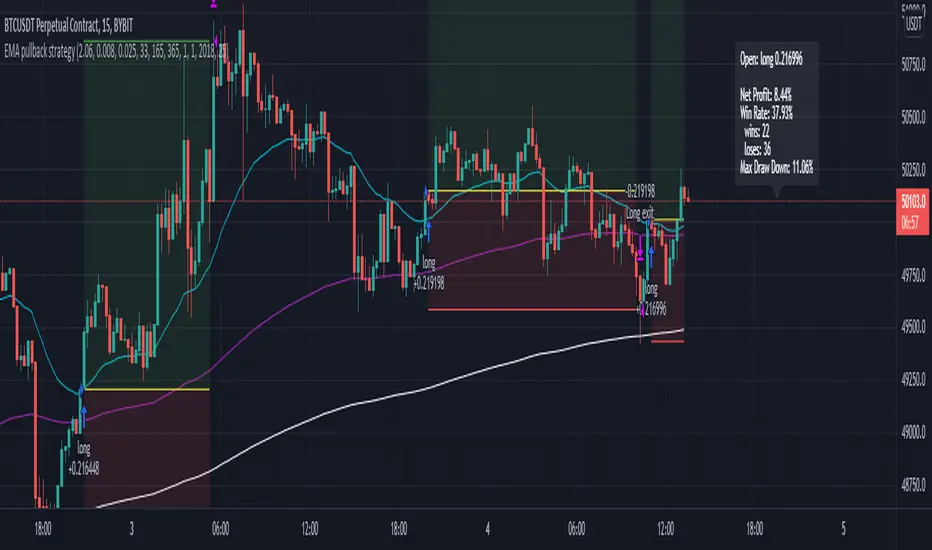
EMA pullback strategyA solid EMA pullback strategy for cryptos 15 min chart that uses EMA crossing as signal and pullback as stop loss.
EMA1: shortest period for finding crossing (I find period = 33 profitable for BTCUSD, you can adjust it for other cryptos)
EMA2: 5x period of EMA1, for filtering out some trend reversals
EMA3: 11x period of EMA1, for determining trend direction
Rules are:
Long:
close price > EMA3
EMA1 > EMA3
close price pullbacks below EMA1 and then crosses up EMA1, enter at the first close price above EMA1
lowest pullback close price < EMA2 at the cross up
Short:
close price < EMA3
EMA1 < EMA3
close price pullbacks above EMA1 and then crosses down EMA1, enter at the first close price below EMA1
highest pullback close price > EMA2 at the cross down
Stop-loss at lowest/highest pullback price for long/short
Take profit = 2x stop-loss
Risk management: risk range can be set in the inspector. If the risk is lower than the range, the trade is not taken. if the risk is higher than the range, the position size is adjusted to keep the risk within range.
Keltner Worm Strategy [PrismBot] [Lite]Included in this Keltner Worm Lite Strategy:
✔️ Tweak a multitude of specific settings (MA lengths, R:R, SL distance etc)
✔️ Enable advanced setup filters
✔️ Use money management and risk calculations
✔️ Draw trade info directly to chart (eg. SL size in percent, win rate etc)
✔️ Use various filters (eg. time filter, date filter, MA slope angle etc)
✔️ Manage risk per position when auto-trading forex through AutoView
✔️ Choose from various alert conditions!
✔️ Sync to any bot or algorithmic trading system
Some details about this strategy:
- it incorporates 2 strategies - Keltner Re-entry and Baseline MA Crossing
- it uses a take profit and stop loss level fixed
- there are up to 6 allowable "worms"
- the worm multipliers are exponential, so a value of 2 will mean that the 6th worm is multiplied by 6
- you can multiply the offset or the Keltner Channel default values
- You can enable alerts for order entry, take profit, and stop loss values
- You can easily enable and disable strategies using the checkbox.
- This strategy incorporates a risk to reward system where the user can select between ATR and Percent based stop losses and take profit targets. This means that the user has much better control over money management when utilizing this strategy and it doesn't require you to babysit the strategy to ensure it's entering and existing strategies in an ideal place.

8 Whittle DownThe system is designed to short on directionally negative instruments like VXX & SQQQ
The system only shorts, no longs
It enters a pilot position if the system has no trades open at the time is in the late afternoon
It uses a 200-day moving average as a filter and will only short if the price is below the 200 day moving average
The pilot position will only enter with 1/3 ( one third ) of the total expected position size
StopLossPerc sets the stop loss, (1.15) means it is set to a 15% stop loss. -- The Red Line
The system will buy additional shares for a full position if the pilot piston profit target was not reached
The full shares position is set to purchase at a higher price. T2EntTrgPerc sets the buy percentage target for the additional shares. -- The Yellow Line
Each entry has different settable profit targets. T1ProfTrgPerc sets the profit target for the first trade (0.95) is basically set to a 5% profit.
T2ProfTrgPerc sets the profit target for the second trade (0.90) is basically set to a 10% profit. -- The White Line
RED LINE == STOP LOSS LINE
GREENLINE == PROFIT TARGET FOR THE 1ST TRADE
YELLOW LINE == ADD ON SHARES TO THE TRADE
WHITE LINE == PROFIT TARGET FOR THE 1st & 2nd TRADE COMBINED
Let me know if you have any questions and I'll try to clarify

NIKI MSS BANKNIFTYThis is the strategy version of my old indicator NIKI BANKIFTY. It is more suitable for day trading with a 5 min chart. It is more profitable in BANKNIFTY future. It is based on multiple Supertrend, moving average, Donchain channel, and linear regression. The background color indicates the main trend and the color of the candle represents a short-term trend. The label with TA and SL represents more profitable entry positions. The label RE: LE and RE: SE stands for re-entry positions or signals with less accuracy. Consider the direction of the linear regression line to take trades on re-entry positions. The yellow candle indicates the entry and the blue candle represents the target or stop-loss.
The backtest results are based on BANKNIFTY last year's data. It has an initial capital of 100000 and the size of the lot is 1. The target is 0.3% and stop-loss is 1.5%. It exactly not following the stop loss, the trade will exit based on the Donchain channel breakout. It appears on the chart as a blue candle. The commission paid is 20 cash per trade and the slippage is 5 ticks per trade. Some of the Indian broker's commission is only 10 cash per trade. Adjust the commission as per your broker. Trades are conducted based on the intraday time in India set from 9.20 am to 2.25 pm. All positions will get square off at 3.00 pm. It will execute a maximum of 4 trades per day. All other parameters are suitable for Robo trading with Indian stock brokers.
Contact us using the link given below to obtain access to this indicator.

TradingView Alerts to MT4 MT5 - Forex, indices, commoditiesHowdy Algo-Traders! This example script has been created for educational purposes - to present how to use and automatically execute TradingView Alerts on real markets.
I'm posting this script today for a reason. TradingView has just released a new feature of the PineScript language - ALERT() function. Why is it important? It is finally possible to set alerts inside PineScript strategy-type script, without the need to convert the script into study-type. You may say triggering alerts straight from strategies was possible in PineScript before (since June 2020), but it had its limitations. Starting today you can attach alert to any custom event you might want to include in your PineScript code.
With the new feature, it is easier not only to execute strategies, but to maintain codebase - having to update 2 versions of the code with each single modification was... ahem... inconvenient. Moreover, the need to convert strategy into study also meant it was required to rip the code from all strategy...() calls, which carried a lot of useful information, like entry price, position size, and more, definitely influencing results calculated by strategy backtest. So the strategy without these features very likely produced different results than with them. While it was possible to convert these features into study with some advanced "coding gymnastics", it was also quite difficult to test whether those gymnastics didn't introduce serious, bankrupting bugs.
//////
How does this new feature work? It is really simple. On your custom events in the code like "GoLong" or "GoShort", create a string variable containing all the values you need inside your alert and this string variable will be your alert's message. Then, invoke brand new alert() function and that's it (see lines 67 onwards in the script). Set it up in CreateAlert popup and enjoy. Alerts will trigger on candle close as freq= parameter specifies. Detailed specification of the new alert() function can be found in TradingView's PineScript Reference (www.tradingview.com), but there's nothing more than message= and freq= parameters. Nothing else is needed, it is very simple. Yet powerful :)
//////
Alert syntax in this script is prepared to work with TradingConnector. Strategy here is not too complex, but also not the most basic one: it includes full exits, partial exits, stop-losses and it also utilizes dynamic variables calculated by the code (such as stop-loss price). This is only an example use case, because you could handle variety of other functionalities as well: conditional entries, pending entries, pyramiding, hedging, moving stop-loss to break-even, delivering alerts to multiple brokers and more.
//////
This script is a spin-off from my previous work, posted over a year ago here: Some comments on strategy parameters have been discussed there, but let me copy-paste most important points:
* Commission is taken into consideration.
* Slippage is intentionally left at 0. Due to shorter than 1 second delivery time of TradingConnector, slippage is practically non-existing.
* This strategy is NON-REPAINTING and uses NO TRAILING-STOP or any other feature known to be causing problems.
* The strategy was backtested on EURUSD 6h timeframe, will perform differently on other markets and timeframes.
Despite the fact this strategy seems to be still profitable, it is not guaranteed it will continue to perform well in the future. Remember the no.1 rule of backtesting - no matter how profitable and good looking a script is, it only tells about the past. There is zero guarantee the same strategy will get similar results in the future.
Full specs of TradingView alerts and how to set them up can be found here: www.tradingview.com

Ultimate Oscillator [Long] StrategyAfter I published Short Selling strategy with RSIofUO , I have been working for Long side strategy with same indicator.
but for Long strategy , I have used only the Ultimate Oscillator ... (Not the RSI of UO)
Logic behind this is , when UO goes below oversold level , high chance of possible reversal from there ...
Ultimate Oscialltor values , I have used are 5, 10 and 15
Signal Line 9
Above values are best/defaulted based on testing the strategy multiple symbols
BUY
when UO crossing up buyLine and close > open ( if the cross over is already done , it will wait for 3 candles to see a green bar i.e close>open )
Note when the bar color changes to orange , that means startegy is ready to take LONG position on next bar. But dont jump here , waith for the startegy take the Long Position :-)
Add
Signal appears when there is divergence (marked in yellow color ) ... strategy doesnt add the position , it is ony indicating you could add to existing OR if you missed the BUY signal you could enter here
Partial Exit
when UO crossing down partial exit level
Exit
When UO crossing down sell line
StopLoss
stop loss defaulted to 3%
Please note , I have slightly modified stop loss exit in this strategy.
Even though price hits 3% stoploss , strategy wont wind up the position ...
First , it will check if RSIofUO is above 30 , then it will hold on to the Long position.
Very reason behind this is , price is falling down and UO is going up ... That means there is bullish divergence here .. so it might turn this losing position to profitable one or will exit you with less than 3% loss.
Tested with SPY , QQQ , TSLA on 30mins to 4hrs. Though winning rate is average , net profit is exponential ...
Best working on 30 mins and 1 HR chart for QQQ
Warning
For the eductional purposes only ...
This is not a financial advise , before taking trading decission please do your own research

Scalping Strategy with SL and TP activation settingsThis strategy can be used on pretty much every timeframe that gives you a satisfying performance and will give you entries with a high probability of a winning trade.
Recommended are lower timeframes, because after all this is a scalping strategy and with that your chart wont be cluttered.
How to use this script?
Currently you can setup your positions SL and TP, because the markets vary in volatility it could improve the performance of the strategy.
You will simply get your signals and can decide to act upon them.
Stop loss: Simply your stop loss order which will trigger when price moves a given % away from your entry.
TP-Activation: When price reaches your % target it will trigger a stop limit order. So if price turns against your position after reaching your target it will close your position in profit and if it runs in your favoured direction it will trigger at a later stage.
Trailing-Offset-%: After reaching your % target it will trigger the TP order with an offset. So if you set your trailing offset to 0.1%, your TP order will be set behind 0.1 %. This can be used to test if the strategy would perform as well
if you leave more room for trades to play out.
Will this script make me profitable?
No strategy is a silver bullet and it depends mostly on you.
Trading is not easy and most people fail, because their risk management skills arent solid or they cant control their emotions.
This script will give you statistically often good entries, so even if you hit a losing streak your SL will protect you from losing more than necessary until you get a winning streak.
Patience and consistency is key to be profitable in the long run.
Does the script repaint?
Although you will get a notification when setting an alarm that the indicator may repaint, no security function is used and the signals will stay on the chart, because the signal is calculated based on the last candle close and will trigger with the next candle.
I am still looking into why that notification pops up.
You are free to try the indicator for a limited time to be sure.
My experience with the strategy
The overall statistical advantage is great. The strategy can be used simply as it is, but becomes better if you already have some experience with trading. Sometimes it will give you a good entry, reaches your target and the price still goes in your preferred direction. So your trading returns and experience could be improved with confluence, but it is totally fine as it is and if used right will help you get going.
Disclaimer: This is no financial advice. This is a tool and I am not responsible for your actions.
If you are interested in the indicator feel free to dm me on TradingView.

Profits Unlimited Pro Strategy** This is the backtesting (strategy) version of ~ Profits Unlimited Pro ~ proprietary script in TradingView. **
~ Profits Unlimited Pro Strategy ~
֎ Trading system script on tradingview that brings an easy approach to trading with a high profitability rate
֎ Our proprietary formula was developed over the course of the past two years through a combination of trial and error and algorithmic backtesting.
-- HOW IT WORKS --
֎ The algorithm starts with a proprietary script combining custom inputs with a formula that works with custom bollinger bands settings and specific RSI levels to results in deadly accurate signals for long and short entry points.
but that's not all...
֎ When we first developed our formula, we noticed that it produced a lot of accurate signals but also didn't fully understand the dynamics of market momentum and trending directions...
...so there were a lot of needless calls being made that were reducing profitability.
You see, most markets spend roughly 80% of the time trading sideways with no significant trend either up or down...
...And trading these sideways markets commonly result in what's called a "whipsaw"...
A whipsaw is when price is moving in one direction but then quickly pivots to move in the opposite direction resulting in a loss. And nobody wants to be stuck trading in a sideways market getting killed by whipsaws all day...
So what did we do to fix this?...
-- THE WINNING FORMULA --
֎ We added the Average Directional Index into our custom formula with a goal of teaching the algorithm to only trade during periods of strong momentum and trends whether up or down.
֎ We also added trend exhaustion levels to give clear indication for exit signals and help determine best times of getting out of a trade.
֎ Trend Exhaustion Levels work in conjunction with trailing stop loss % and both are customizable for ideal exits and profitability.
֎ The results are mind blowing!
-- WHO IT'S FOR --
֎ Optimized for crypto markets, to catch trend movements as soon as possible and maximize profitability
֎ It's A Swing Traders Dream.
-- What You Get --
֎ Sell & Buy alerts, Stop Loss alerts and always adding new features!
֎ Customizable settings.
֎ Chrome Extension in development for fine-tuning settings automatically(COMING SOON)
-You will be able to select an asset. push a button. and the extension will find the best settings for you!
֎ Users Facebook community for learning, sharing and direct support
If you’d like to test the trading script in TradingView, I can give you access to a 10 days trial.
Please send me PM in tradingview and I’ll activate it right away.
Thank you!