Seawolf Pivot Hunter [Strategy]Overview
Seawolf Pivot Hunter is a practical trading strategy that enhances the classic pivot-box breakout system with a structured risk-management framework. Using ATR-based stop loss and take-profit calculations, position sizing, multi-layer filtering, and daily loss-limit protection, it provides a stable and sustainable trading environment. It preserves the strengths of the original version while adding systems designed to manage real-market risks more effectively.
Core Philosophy
The most important element in trading is not generating profits but controlling losses. Even the best entry signals cannot compensate for a single large loss that wipes out accumulated gains. This strategy precisely calculates the risk exposure for every trade and includes multiple layers of protection to safeguard the account under worst-case scenarios.
Indicator Setup Link
kr.tradingview.com
Example of Optimal Parameter Settings
Asset (Exchange): ETH/USDT (Binance)
Timeframe: 15-minute chart
Pivot Detection Length: 5
Upper Box Width: 2
Lower Box Width: 2
Enable Risk Management: False
Use Trailing Stop: False
Use Volume Filter
-Min Buy Volume % for Long: 50
-Min Sell Volume % for Short: 50
Use Trend Filter (EMA): False
Enable Max Loss Protection
-Max Daily Loss ($): 200
-Max Trades Per Day: 10
Calculated Bars: 50,000
Risk-Management System
Every trade automatically receives a stop-loss level at the moment of entry. The stop is calculated using ATR, adjusting dynamically to market volatility. When volatility increases, the stop widens; in stable conditions, it tightens to reduce unnecessary exits. The default distance is set to twice the ATR.
The standard take-profit level is set to four times the ATR, providing a 1:2 risk-reward structure. With this ratio, even a 50 percent win rate can produce profitability—while the typical trade structure aims for small losses and larger gains to support long-term performance.
A trailing-stop option is also available. Once the trade moves into profit, the stop level automatically trails behind price action, protecting gains while allowing the position to expand when momentum continues.
Position size is calculated automatically based on the selected risk percentage. For example, with a 2 percent risk setting, each stop-loss hit would result in exactly 2 percent of the account balance being lost. This ensures a consistent risk profile regardless of account size.
The daily loss-limit function prevents excessive drawdown by halting new trades once a predefined loss threshold is reached. This helps avoid emotional decision-making after consecutive losses.
A daily trade-limit feature is included as well. The default is 10 trades per day, protecting traders from overtrading and unnecessary fees.
Filtering System
The volume filter analyzes buying and selling pressure within the pivot box. Long trades are allowed only when buy volume exceeds a specified percentage; shorts require sell-volume dominance. The default threshold is 55 percent.
The trend filter uses an EMA to determine market direction. When price is above the 200-EMA, only long signals are permitted; when below, only shorts are allowed. This ensures alignment with the broader trend and reduces counter-trend risk.
Each filter can be toggled independently. More filters generally reduce trade frequency but improve signal quality.
Real-Time Monitoring
A real-time statistics panel displays daily profit/loss, the number of trades taken, the maximum allowed trades, and whether new trades are currently permitted. When daily limits are reached, the panel provides clear visual warnings.
Entry Logic
A trade is validated only after a pivot-box breakout occurs and all active filters—volume, trend, daily loss limit, and daily trade limit—are satisfied. Position size, stop loss, and take-profit levels are then calculated automatically. Entry arrows and labels on the chart help with later review and analysis.
Setup Guide
Risk percentage is the most critical setting. Beginners should start at 1 percent. Anything above 3 percent becomes aggressive.
ATR stop-loss multipliers should reflect asset volatility.
ATR take-profit multipliers determine reward ratio; 4.0 is the standard.
Volume thresholds are typically set between 50–60 percent depending on market conditions.
Daily loss limits are typically 2–5 percent of the account.
Trading Strategy
This strategy performs best in trending environments and works especially well on the 4-hour and daily charts. New users should begin with all filters enabled and trade conservatively. A minimum of one month of paper trading is recommended before committing real capital.
Suitable Users
The strategy is ideal for beginners who lack risk-management experience as well as advanced traders seeking a customizable structure. It is particularly helpful for traders who struggle with emotional decision-making, as pre-defined limits and rules enforce discipline.
Backtesting Guide
Use at least 2–3 years of historical data that includes bullish, bearish, and sideways conditions.
Target metrics:
Sharpe ratio: 1.5 or higher
Maximum drawdown: below 25 percent
Win rate: 40 percent or higher
Total trades: at least 100 for statistical relevance
Optimization Precautions
Avoid over-fitting parameters. Always test values around the “best” setting to verify stability.
Out-of-sample testing is essential for confirming robustness.
Test across multiple assets and timeframes to ensure consistency.
Live Deployment Roadmap
After successful backtesting, follow a gradual rollout:
Paper trading for at least one month
Small-account live testing
Slow scaling as performance stabilizes
Continuous Improvement
Keep a detailed trading journal and evaluate performance each quarter using recent data.
Adapt settings as market conditions evolve.
Conclusion
Seawolf Pivot Hunter aims to provide more than simple trade signals—it is designed to create a stable and sustainable trading system built on disciplined risk management. No strategy is perfect, and long-term success depends on consistency, patience, and strict adherence to rules. Start small, verify results, and scale progressively.
Disclaimer
This strategy is for educational and research purposes only. Past performance does not guarantee future results. All trading decisions are the responsibility of the user.
개요
Seawolf Pivot Hunter는 기본 피봇 박스 브레이크아웃 전략에 전문적인 리스크 관리 시스템을 더한 실전형 트레이딩 전략입니다. ATR 기반의 손절매와 목표가 설정, 포지션 사이징, 다층 필터링 시스템, 일일 손실 제한 기능을 통해 안정적이고 지속 가능한 트레이딩 환경을 제공합니다. 기본 버전의 장점은 유지하면서 실제 시장에서 발생할 수 있는 위험을 체계적으로 관리할 수 있도록 설계되었습니다.
핵심 철학
트레이딩에서 가장 중요한 것은 수익이 아니라 손실 관리입니다. 아무리 훌륭한 진입 조건이 있어도 한 번의 큰 손실로 모든 수익이 사라질 수 있습니다. 이 전략은 각 거래마다 감수할 리스크를 명확히 계산하고, 최악의 상황에서도 계좌를 보호하기 위한 다양한 안전장치를 제공합니다.
지표 적용 링크 공유
kr.tradingview.com
최적 조건값 설정(예시)
"종목(거래소): ETH/USDT(Binance)", "15 분봉 기준"
-Pivot Detection Length: 5
-Upper Box width: 2
-Lower Box width: 2
-Enable Risk Management: False
-Use Trailing Stop: False
-Use Volume Filter
-Min Buy Volume % for Long: 50
-Min Buy Volume % for Long: 50
-Use Trend Filter(EMA): False
-Enable Max Loss Protection
-Max Daily Loss($): 200
-Max Trades Per Day: 10
-Calucated bars: 50000
리스크 관리 시스템
모든 거래는 진입과 동시에 손절매 주문이 자동 설정됩니다. 손절가는 ATR을 기준으로 계산되며, 시장의 변동성에 따라 자동으로 조정됩니다. 변동성이 큰 시장에서는 넓은 손절폭을, 안정적인 시장에서는 좁은 손절폭을 사용해 불필요한 청산을 줄입니다. 기본값은 ATR의 2배입니다.
목표가는 ATR의 4배를 기본값으로 설정하여 손익비 1:2 구조를 유지합니다. 승률이 50퍼센트만 되어도 수익성이 가능하며, 실제로는 손절은 짧고 이익은 길게 가져가는 방식으로 장기 성과를 확보합니다.
트레일링 스톱 기능도 제공됩니다. 포지션이 수익 구간에 들어서면 손절가가 자동으로 함께 움직이며 수익을 보호합니다. 이 기능은 사용자가 켜거나 끌 수 있습니다.
포지션 크기는 리스크 퍼센트 기반으로 자동 계산됩니다. 예를 들어 리스크를 2퍼센트로 설정하면 손절 시 계좌 자산의 2퍼센트만 잃도록 수량이 조절됩니다. 계좌 크기와 무관하게 항상 일정한 비율의 리스크만 감수하게 되는 방식입니다.
일일 손실 제한 기능은 하루에 허용 가능한 최대 손실을 초과하지 않도록 합니다. 지정 금액에 도달하면 당일 거래는 더 이상 실행되지 않습니다. 감정적 거래를 막고 일정한 규율을 유지하도록 돕습니다.
일일 거래 횟수 제한 기능도 제공됩니다. 기본값은 하루 10회로, 과매매와 수수료 증가를 방지합니다.
필터링 시스템
볼륨 필터는 박스 구간 내 매수·매도 압력을 분석해 진입 신호를 검증합니다. 롱은 매수 볼륨이 일정 비율 이상일 때, 숏은 매도 볼륨이 우세할 때만 진입합니다. 기본값은 55퍼센트입니다.
추세 필터는 EMA를 사용하며, 가격이 200EMA 위에 있을 때는 롱 신호만, 아래에서는 숏 신호만 허용합니다. 큰 추세 방향에만 거래하여 역추세 리스크를 줄입니다.
필터는 독립적으로 켜고 끌 수 있으며, 필터가 많을수록 거래 횟수는 줄지만 신호 품질은 향상됩니다.
실시간 모니터링
화면에 실시간 통계 테이블이 표시되며, 일일 손익, 거래 횟수, 최대 허용 횟수, 현재 거래 가능 여부가 즉시 확인됩니다. 손실 제한 또는 거래 제한 도달 시 시각적으로 표시됩니다.
진입 로직
피봇 박스 브레이크아웃 발생 후 볼륨 필터, 추세 필터, 일일 손실·거래 제한을 모두 통과하면 포지션 크기를 계산하고 손절·목표가를 설정한 뒤 진입합니다. 진입 지점에는 화살표와 레이블이 표시되어 분석에 도움을 줍니다.
설정 가이드
리스크 퍼센트는 가장 중요한 설정입니다. 초보자는 1퍼센트를 추천하며 3퍼센트 이상은 위험합니다.
손절 ATR 배수는 자산 특성에 맞게 조절합니다.
목표가 ATR 배수는 손익비를 결정하며 기본값은 4.0입니다.
볼륨 비율은 시장 상황에 따라 50~60퍼센트 내외로 조정합니다.
일일 손실 제한은 계좌의 2~5퍼센트 수준이 적절합니다.
사용 전략
추세가 명확한 시장에서 가장 효과적이며, 4시간봉 또는 일봉을 추천합니다. 초반에는 모든 필터를 켜고 보수적으로 시작하며, 최소 한 달간 페이퍼 트레이딩을 권장합니다.
적합한 사용자
리스크 관리 경험이 부족한 초보자부터, 커스터마이징을 원하는 경험자까지 폭넓게 적합합니다. 감정적 트레이딩을 억제하는 기능이 있어 규율 유지가 어렵던 트레이더에게 특히 유용합니다.
백테스트 가이드
최소 2~3년 데이터로 테스트하며, 상승·하락·횡보 모두 포함해야 합니다.
샤프비율 1.5 이상, 최대 낙폭 25퍼센트 이하를 목표로 합니다.
승률은 40퍼센트 이상이면 충분합니다.
최소 100회 이상 거래가 있어야 통계적으로 의미가 있습니다.
최적화 주의사항
과최적화를 피하고 주변 값도 테스트해야 합니다.
샘플 외 기간 검증은 필수입니다.
여러 자산·여러 시간대에서 테스트하여 일관성을 확인해야 합니다.
실전 적용 로드맵
백테스트 후 바로 실전 투입하지 말고, 한 달 이상의 페이퍼 트레이딩 → 소액 실전 → 점진적 확대 순으로 진행합니다.
지속적 개선
일지를 기록하고 분기마다 최신 데이터로 점검합니다.
시장 변화에 따라 유연하게 조정해야 합니다.
마치며
Seawolf Pivot Hunter는 단순 신호 제공을 넘어, 안전하고 지속 가능한 트레이딩 환경 구축을 목표로 합니다. 어떤 전략도 완벽할 수 없으며, 장기적 성공을 위해서는 규칙 준수와 인내가 가장 중요합니다. 충분한 검증을 거쳐 작은 금액으로 시작하고 점진적으로 확장해나가는 접근을 추천합니다.
면책 조항
이 전략은 교육 및 연구 목적이며, 과거 성과는 미래를 보장하지 않습니다. 모든 투자 결정은 본인의 판단과 책임 하에 이루어져야 합니다.
Pesquisar nos scripts por "stop loss"

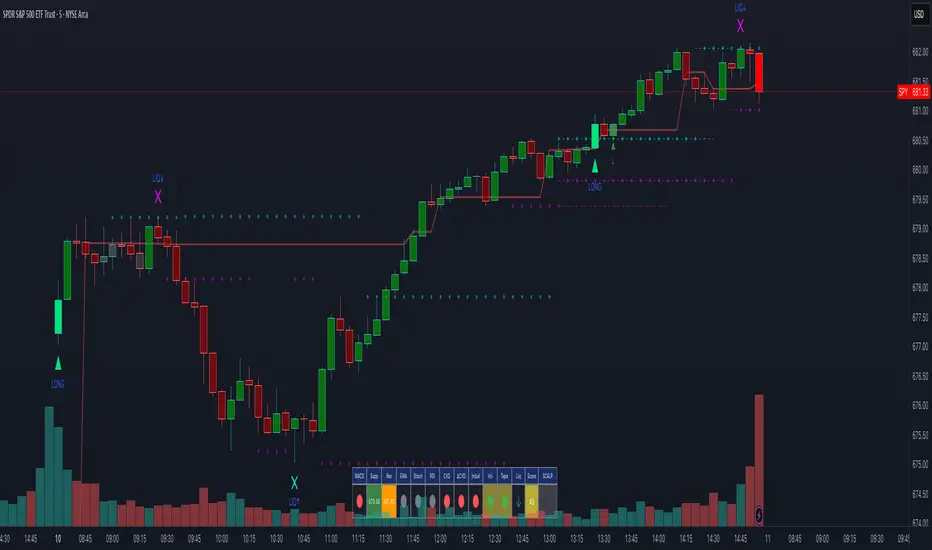
Scalping Dashboard - Volume Candles + Liquidity ZonesScalping Dashboard - Volume Candles + Liquidity Zones
📊 Overview
A comprehensive scalping indicator designed for high-frequency traders on 1-5 minute timeframes. This all-in-one dashboard combines volume analysis, order flow metrics, technical indicators, and institutional liquidity zones to identify high-probability scalping opportunities.
🎯 Key Features
✅ Multi-Timeframe Analysis
Fast MACD (5/13/5) for momentum
Quick EMAs (9/20/50) for trend direction
Rapid Stochastic (5/3/3) for oversold/overbought conditions
Fast RSI (7) for extreme readings
✅ Advanced Order Flow Metrics
CVD (Cumulative Volume Delta): Tracks buy vs sell pressure over time
Delta Momentum: Measures acceleration in buying/selling
Buy/Sell Pressure Ratio: Real-time balance of market forces
Order Flow Imbalance: Detects aggressive buying or selling
Tape Speed: Measures how fast volume is hitting the market
✅ Institutional Liquidity Zones
Buy-Side Liquidity: Areas above price where short stop losses cluster
Sell-Side Liquidity: Areas below price where long stop losses cluster
Liquidity Sweeps: Detects "stop hunts" by institutions before reversals
✅ Volume-Based Candle Coloring
Visual representation of volume intensity
Extreme, High, Normal, and Low volume categories
Fully customizable color schemes
✅ Dynamic Support/Resistance
Volume-weighted price levels
Automatically updates every 3 bars
Shows distance to key levels
📈 Dashboard Indicators Explained
The bottom-left dashboard displays 14 real-time metrics:
▸ MACD (●)
Green = Bullish momentum
Red = Bearish momentum
Gray = Neutral
▸ Supp (Price)
Support level
Green highlight = at support (good for long entry)
▸ Res (Price)
Resistance level
Orange highlight = at resistance (good for short entry)
▸ EMA (●)
Green = Price above EMAs (bullish)
Red = Price below EMAs (bearish)
▸ Stoch (●)
Green = Oversold (<20)
Red = Overbought (>80)
Gray = Neutral
▸ RSI (●)
Green = Oversold (<30)
Red = Overbought (>70)
Gray = Neutral
▸ CVD (●)
Green = Cumulative buying pressure
Red = Cumulative selling pressure
▸ ΔCVD (●)
Green = Increasing buy pressure
Red = Increasing sell pressure
▸ Imbal (●)
Green = Buy imbalance (>2:1 ratio)
Red = Sell imbalance
▸ Vol (●)
Green/Yellow background = Volume surge (>2x average)
▸ Tape (●)
Green/Yellow background = Fast tape (>1.5x speed)
▸ Liq (↑↓●)
↑ = Bullish sweep or near sell-side liquidity
↓ = Bearish sweep or near buy-side liquidity
● = Neutral
▸ Score (#L or #S)
Quality score (0-8) for Long or Short setups
Higher numbers = Better quality trade
▸ SCALP (LONG/SHORT/WAIT)
Primary signal
Bright color = High quality (score ≥5)
Dim color = Decent quality (score =4)
Gray = Wait for better setup
🎨 Candle Color System
Volume-Based Colors
Bright Green/Red: Extreme volume (>2.5x average) - Major moves
Medium Green/Red: High volume (>1.5x average) - Strong activity
Dull Green/Red: Normal volume - Standard market activity
Gray: Low volume (<0.5x average) - Avoid trading
Signal-Based Colors
Lime: Strong Long signal (score ≥5)
Green: Decent Long signal (score =4)
Orange: Strong Short signal (score ≥5)
Red: Decent Short signal (score =4)
Candle Color Modes (adjustable in settings):
Volume Only: Pure volume intensity
Volume + Signals: Signals override volume when present (default)
Signals Only: Only shows entry signals
🔵 Chart Indicators
Support & Resistance Lines
Green Line: Volume-weighted support level
Red Line: Volume-weighted resistance level
Lines update dynamically based on 100-bar volume profile
Liquidity Zones
Cyan Circles/Dashed Lines: Buy-side liquidity (above price)
Where short stop losses cluster
Potential targets for bullish moves
Institutions may push price here before reversing down
Magenta Circles/Dashed Lines: Sell-side liquidity (below price)
Where long stop losses cluster
Potential targets for bearish moves
Institutions may push price here before reversing up
Entry Markers
Large Green Triangle (▲): High quality long entry (score ≥5)
Small Green Triangle (▲): Decent long entry (score =4)
Large Orange Triangle (▼): High quality short entry (score ≥5)
Small Red Triangle (▼): Decent short entry (score =4)
Liquidity Sweep Markers
Cyan X-Cross (below bar): Bullish liquidity sweep - "LIQ↑"
Price swept sell-side liquidity and reversed up
Strong buy signal
Magenta X-Cross (above bar): Bearish liquidity sweep - "LIQ↓"
Price swept buy-side liquidity and reversed down
Strong sell signal
🎯 How to Use This Indicator
For Long Scalps (Buy):
Wait for Dashboard Signal: SCALP = "LONG" with score ≥5
Confirm Multiple Green Dots: Look for EMA, CVD, ΔCVD, Imbal all green
Check Volume: Vol or Tape should show yellow background (surge)
Look for Confluence:
Price at or near Support level (green highlight)
Price near Sell-Side Liquidity (magenta line below)
RSI oversold (green dot)
Large green triangle appears on chart
Best Entry: On a bullish liquidity sweep (cyan X-cross)
For Short Scalps (Sell):
Wait for Dashboard Signal: SCALP = "SHORT" with score ≥5
Confirm Multiple Red Dots: Look for EMA, CVD, ΔCVD, Imbal all red
Check Volume: Vol or Tape should show yellow background (surge)
Look for Confluence:
Price at or near Resistance level (orange highlight)
Price near Buy-Side Liquidity (cyan line above)
RSI overbought (red dot)
Large orange triangle appears on chart
Best Entry: On a bearish liquidity sweep (magenta X-cross)
Three Types of Scalping Setups:
1. Quick Scalp (Fastest - 1-5 minute holds)
MACD or Stochastic crossover + Volume surge
At Support/Resistance level
Score ≥4
2. Momentum Scalp (Ride the wave - 5-15 minute holds)
Strong EMA alignment + CVD slope positive
Order flow imbalance + Fast tape
Volume surge with price structure
Score ≥5
3. Reversal Scalp (Fade extremes - 3-10 minute holds)
Stochastic + RSI extreme readings
At Support/Resistance OR liquidity sweep
CVD momentum reversal
Score ≥6
⚙️ Recommended Settings
Timeframes
Primary: 1-minute, 2-minute, 5-minute
Confirmation: Use 15-minute chart for overall trend direction
Asset Types
Forex pairs (high liquidity)
Crypto (BTC, ETH with high volume)
Futures (ES, NQ)
Major stocks during market hours
Risk Management
Target: 1-3 times your stop loss
Stop Loss: Below nearest liquidity zone for longs, above for shorts
Position Size: Never risk more than 1% per trade
Score ≥5: Take full position size
Score =4: Take half position size or skip
🔧 Customization Options
Input Groups
MACD Settings
Fast Length: 5 (scalping optimized)
Slow Length: 13
Signal Length: 5
EMA Settings
EMA 9, 20, 50 (fast scalping EMAs)
Stochastic Settings
%K Length: 5
%D Smoothing: 3
Smooth: 3
CVD Settings
MA Length: 10 (for CVD smoothing)
RSI Settings
Length: 7 (fast RSI)
Overbought: 70
Oversold: 30
Volume Settings
MA Length: 10
Extreme Multiplier: 2.5x
High Multiplier: 1.5x
Low Multiplier: 0.5x
Liquidity Zone Settings
Lookback Periods: 20
Swing Strength: 3
Show Liquidity Zones: On/Off
Show Liquidity Sweeps: On/Off
Support/Resistance Settings
Volume Lookback: 100 bars (~2 hours on 1-min chart)
Order Flow Settings
Imbalance Threshold: 2.0 (2:1 ratio)
Color Customization
All volume colors customizable
All signal colors customizable
All liquidity colors customizable
📊 Volume Legend (Top Right)
The small table in the top-right corner shows the volume intensity key:
Extreme: >2.5x average volume
High: >1.5x average volume
Normal: 0.5x to 1.5x average volume
Low: <0.5x average volume
🔔 Built-in Alerts
Set up these alerts to never miss a trade:
High Quality Long Scalp: Triggers when entry_long and score ≥5
High Quality Short Scalp: Triggers when entry_short and score ≥5
Bullish Liquidity Sweep: Triggers when sell-side liquidity is swept
Bearish Liquidity Sweep: Triggers when buy-side liquidity is swept
To set up: Right-click chart → Add Alert → Select condition → Create
💡 Pro Tips
Understanding Liquidity Zones
Buy-Side Liquidity = Where shorts have their stops = Price tends to wick up here
Sell-Side Liquidity = Where longs have their stops = Price tends to wick down here
Liquidity Sweep = Institution triggers stops, absorbs liquidity, then reverses
Best trades = Enter AFTER the sweep when price reverses back
Reading the Dashboard
All Green Dots + Yellow Volume = Strong Long Setup
All Red Dots + Yellow Volume = Strong Short Setup
Mixed Colors = Choppy/Neutral = Wait
Score 6+ = Highest probability trades
Score 3 or less = Avoid
Confluence is Key
Never trade on a single indicator. Wait for:
Dashboard score ≥5
Volume surge (yellow background)
At support/resistance OR liquidity zone
CVD and momentum aligned
Price structure confirmation (triangle marker)
Avoid These Situations
❌ Low volume periods (gray candles)
❌ Dashboard shows "WAIT"
❌ Score below 4
❌ No volume surge during entry
❌ Trading against higher timeframe trend
Best Trading Sessions
Forex: London open (3-5 AM EST), NY open (8-10 AM EST)
Crypto: Works 24/7, best during high volume periods
Stocks: First hour (9:30-10:30 AM EST), last hour (3-4 PM EST)
Futures: US session open (9:30 AM EST)
🎓 Understanding the Scoring System
The indicator calculates a quality score (0-8) for both long and short setups:
+1 point for each:
EMA bias aligned (price above/below EMA structure)
CVD momentum bias aligned (buying/selling pressure)
Buy/Sell pressure ratio aligned (>1.5x or <0.67x)
Volume strength (surge detected)
Order flow imbalance (>2:1 ratio)
Tape speed (>1.3x average)
Price structure (higher highs or lower lows)
Liquidity bias (sweep detected)
Score Interpretation:
7-8: Extremely high probability (rare, take immediately)
6: Very high probability (excellent trade)
5: High probability (good trade)
4: Decent probability (acceptable with tight stop)
3 or less: Low probability (wait for better setup)
📋 Quick Reference Card
Entry Checklist
Dashboard shows LONG or SHORT
Score is ≥5
Multiple indicators aligned (green or red dots)
Volume surge present (yellow background)
At support/resistance or liquidity zone
Triangle marker appeared on chart
Risk:Reward ratio is at least 1:2
Exit Strategy
Take Profit: At opposite liquidity zone or resistance/support
Stop Loss: Below sell-side liquidity (longs) or above buy-side liquidity (shorts)
Trail Stop: Move to breakeven after 1:1 risk:reward achieved
⚠️ Important Notes
This is NOT a holy grail: No indicator is 100% accurate. Always use proper risk management.
Backtest first: Paper trade or backtest on your specific instrument before using real money.
Market conditions matter: This indicator works best in trending or volatile markets, not in tight consolidation.
Combine with price action: Use the indicator as confluence with your own price action reading.
Adjust for your instrument: Different assets may require tweaking the sensitivity settings.
Lower timeframes = More noise: 1-minute charts have more false signals than 5-minute charts.
🔄 Version History
v1.0 - Initial release
Multi-indicator dashboard
Volume-based candle coloring
Support/Resistance detection
Entry signal generation
v2.0 - Current version
Added liquidity zone detection
Added liquidity sweep identification
Enhanced scoring system (now 0-8)
Added liquidity bias to entries
New alerts for liquidity sweeps
Improved dashboard with Liq indicator
📞 Support & Feedback
If you find this indicator helpful, please:
⭐ Give it a boost
💬 Share your results in the comments
🐛 Report any bugs or issues
💡 Suggest improvements
Disclaimer: This indicator is for educational purposes only. Trading involves significant risk. Past performance does not guarantee future results. Always trade responsibly and never risk more than you can afford to lose.
🏆 Credits
Created for serious scalpers who want institutional-level insights on retail charts. Combines order flow analysis, volume profiling, and liquidity mapping into one comprehensive tool.
Happy Scalping! 🚀📈
Quantum Rotational Field MappingQuantum Rotational Field Mapping (QRFM):
Phase Coherence Detection Through Complex-Plane Oscillator Analysis
Quantum Rotational Field Mapping applies complex-plane mathematics and phase-space analysis to oscillator ensembles, identifying high-probability trend ignition points by measuring when multiple independent oscillators achieve phase coherence. Unlike traditional multi-oscillator approaches that simply stack indicators or use boolean AND/OR logic, this system converts each oscillator into a rotating phasor (vector) in the complex plane and calculates the Coherence Index (CI) —a mathematical measure of how tightly aligned the ensemble has become—then generates signals only when alignment, phase direction, and pairwise entanglement all converge.
The indicator combines three mathematical frameworks: phasor representation using analytic signal theory to extract phase and amplitude from each oscillator, coherence measurement using vector summation in the complex plane to quantify group alignment, and entanglement analysis that calculates pairwise phase agreement across all oscillator combinations. This creates a multi-dimensional confirmation system that distinguishes between random oscillator noise and genuine regime transitions.
What Makes This Original
Complex-Plane Phasor Framework
This indicator implements classical signal processing mathematics adapted for market oscillators. Each oscillator—whether RSI, MACD, Stochastic, CCI, Williams %R, MFI, ROC, or TSI—is first normalized to a common scale, then converted into a complex-plane representation using an in-phase (I) and quadrature (Q) component. The in-phase component is the oscillator value itself, while the quadrature component is calculated as the first difference (derivative proxy), creating a velocity-aware representation.
From these components, the system extracts:
Phase (φ) : Calculated as φ = atan2(Q, I), representing the oscillator's position in its cycle (mapped to -180° to +180°)
Amplitude (A) : Calculated as A = √(I² + Q²), representing the oscillator's strength or conviction
This mathematical approach is fundamentally different from simply reading oscillator values. A phasor captures both where an oscillator is in its cycle (phase angle) and how strongly it's expressing that position (amplitude). Two oscillators can have the same value but be in opposite phases of their cycles—traditional analysis would see them as identical, while QRFM sees them as 180° out of phase (contradictory).
Coherence Index Calculation
The core innovation is the Coherence Index (CI) , borrowed from physics and signal processing. When you have N oscillators, each with phase φₙ, you can represent each as a unit vector in the complex plane: e^(iφₙ) = cos(φₙ) + i·sin(φₙ).
The CI measures what happens when you sum all these vectors:
Resultant Vector : R = Σ e^(iφₙ) = Σ cos(φₙ) + i·Σ sin(φₙ)
Coherence Index : CI = |R| / N
Where |R| is the magnitude of the resultant vector and N is the number of active oscillators.
The CI ranges from 0 to 1:
CI = 1.0 : Perfect coherence—all oscillators have identical phase angles, vectors point in the same direction, creating maximum constructive interference
CI = 0.0 : Complete decoherence—oscillators are randomly distributed around the circle, vectors cancel out through destructive interference
0 < CI < 1 : Partial alignment—some clustering with some scatter
This is not a simple average or correlation. The CI captures phase synchronization across the entire ensemble simultaneously. When oscillators phase-lock (align their cycles), the CI spikes regardless of their individual values. This makes it sensitive to regime transitions that traditional indicators miss.
Dominant Phase and Direction Detection
Beyond measuring alignment strength, the system calculates the dominant phase of the ensemble—the direction the resultant vector points:
Dominant Phase : φ_dom = atan2(Σ sin(φₙ), Σ cos(φₙ))
This gives the "average direction" of all oscillator phases, mapped to -180° to +180°:
+90° to -90° (right half-plane): Bullish phase dominance
+90° to +180° or -90° to -180° (left half-plane): Bearish phase dominance
The combination of CI magnitude (coherence strength) and dominant phase angle (directional bias) creates a two-dimensional signal space. High CI alone is insufficient—you need high CI plus dominant phase pointing in a tradeable direction. This dual requirement is what separates QRFM from simple oscillator averaging.
Entanglement Matrix and Pairwise Coherence
While the CI measures global alignment, the entanglement matrix measures local pairwise relationships. For every pair of oscillators (i, j), the system calculates:
E(i,j) = |cos(φᵢ - φⱼ)|
This represents the phase agreement between oscillators i and j:
E = 1.0 : Oscillators are in-phase (0° or 360° apart)
E = 0.0 : Oscillators are in quadrature (90° apart, orthogonal)
E between 0 and 1 : Varying degrees of alignment
The system counts how many oscillator pairs exceed a user-defined entanglement threshold (e.g., 0.7). This entangled pairs count serves as a confirmation filter: signals require not just high global CI, but also a minimum number of strong pairwise agreements. This prevents false ignitions where CI is high but driven by only two oscillators while the rest remain scattered.
The entanglement matrix creates an N×N symmetric matrix that can be visualized as a web—when many cells are bright (high E values), the ensemble is highly interconnected. When cells are dark, oscillators are moving independently.
Phase-Lock Tolerance Mechanism
A complementary confirmation layer is the phase-lock detector . This calculates the maximum phase spread across all oscillators:
For all pairs (i,j), compute angular distance: Δφ = |φᵢ - φⱼ|, wrapping at 180°
Max Spread = maximum Δφ across all pairs
If max spread < user threshold (e.g., 35°), the ensemble is considered phase-locked —all oscillators are within a narrow angular band.
This differs from entanglement: entanglement measures pairwise cosine similarity (magnitude of alignment), while phase-lock measures maximum angular deviation (tightness of clustering). Both must be satisfied for the highest-conviction signals.
Multi-Layer Visual Architecture
QRFM includes six visual components that represent the same underlying mathematics from different perspectives:
Circular Orbit Plot : A polar coordinate grid showing each oscillator as a vector from origin to perimeter. Angle = phase, radius = amplitude. This is a real-time snapshot of the complex plane. When vectors converge (point in similar directions), coherence is high. When scattered randomly, coherence is low. Users can see phase alignment forming before CI numerically confirms it.
Phase-Time Heat Map : A 2D matrix with rows = oscillators and columns = time bins. Each cell is colored by the oscillator's phase at that time (using a gradient where color hue maps to angle). Horizontal color bands indicate sustained phase alignment over time. Vertical color bands show moments when all oscillators shared the same phase (ignition points). This provides historical pattern recognition.
Entanglement Web Matrix : An N×N grid showing E(i,j) for all pairs. Cells are colored by entanglement strength—bright yellow/gold for high E, dark gray for low E. This reveals which oscillators are driving coherence and which are lagging. For example, if RSI and MACD show high E but Stochastic shows low E with everything, Stochastic is the outlier.
Quantum Field Cloud : A background color overlay on the price chart. Color (green = bullish, red = bearish) is determined by dominant phase. Opacity is determined by CI—high CI creates dense, opaque cloud; low CI creates faint, nearly invisible cloud. This gives an atmospheric "feel" for regime strength without looking at numbers.
Phase Spiral : A smoothed plot of dominant phase over recent history, displayed as a curve that wraps around price. When the spiral is tight and rotating steadily, the ensemble is in coherent rotation (trending). When the spiral is loose or erratic, coherence is breaking down.
Dashboard : A table showing real-time metrics: CI (as percentage), dominant phase (in degrees with directional arrow), field strength (CI × average amplitude), entangled pairs count, phase-lock status (locked/unlocked), quantum state classification ("Ignition", "Coherent", "Collapse", "Chaos"), and collapse risk (recent CI change normalized to 0-100%).
Each component is independently toggleable, allowing users to customize their workspace. The orbit plot is the most essential—it provides intuitive, visual feedback on phase alignment that no numerical dashboard can match.
Core Components and How They Work Together
1. Oscillator Normalization Engine
The foundation is creating a common measurement scale. QRFM supports eight oscillators:
RSI : Normalized from to using overbought/oversold levels (70, 30) as anchors
MACD Histogram : Normalized by dividing by rolling standard deviation, then clamped to
Stochastic %K : Normalized from using (80, 20) anchors
CCI : Divided by 200 (typical extreme level), clamped to
Williams %R : Normalized from using (-20, -80) anchors
MFI : Normalized from using (80, 20) anchors
ROC : Divided by 10, clamped to
TSI : Divided by 50, clamped to
Each oscillator can be individually enabled/disabled. Only active oscillators contribute to phase calculations. The normalization removes scale differences—a reading of +0.8 means "strongly bullish" regardless of whether it came from RSI or TSI.
2. Analytic Signal Construction
For each active oscillator at each bar, the system constructs the analytic signal:
In-Phase (I) : The normalized oscillator value itself
Quadrature (Q) : The bar-to-bar change in the normalized value (first derivative approximation)
This creates a 2D representation: (I, Q). The phase is extracted as:
φ = atan2(Q, I) × (180 / π)
This maps the oscillator to a point on the unit circle. An oscillator at the same value but rising (positive Q) will have a different phase than one that is falling (negative Q). This velocity-awareness is critical—it distinguishes between "at resistance and stalling" versus "at resistance and breaking through."
The amplitude is extracted as:
A = √(I² + Q²)
This represents the distance from origin in the (I, Q) plane. High amplitude means the oscillator is far from neutral (strong conviction). Low amplitude means it's near zero (weak/transitional state).
3. Coherence Calculation Pipeline
For each bar (or every Nth bar if phase sample rate > 1 for performance):
Step 1 : Extract phase φₙ for each of the N active oscillators
Step 2 : Compute complex exponentials: Zₙ = e^(i·φₙ·π/180) = cos(φₙ·π/180) + i·sin(φₙ·π/180)
Step 3 : Sum the complex exponentials: R = Σ Zₙ = (Σ cos φₙ) + i·(Σ sin φₙ)
Step 4 : Calculate magnitude: |R| = √
Step 5 : Normalize by count: CI_raw = |R| / N
Step 6 : Smooth the CI: CI = SMA(CI_raw, smoothing_window)
The smoothing step (default 2 bars) removes single-bar noise spikes while preserving structural coherence changes. Users can adjust this to control reactivity versus stability.
The dominant phase is calculated as:
φ_dom = atan2(Σ sin φₙ, Σ cos φₙ) × (180 / π)
This is the angle of the resultant vector R in the complex plane.
4. Entanglement Matrix Construction
For all unique pairs of oscillators (i, j) where i < j:
Step 1 : Get phases φᵢ and φⱼ
Step 2 : Compute phase difference: Δφ = φᵢ - φⱼ (in radians)
Step 3 : Calculate entanglement: E(i,j) = |cos(Δφ)|
Step 4 : Store in symmetric matrix: matrix = matrix = E(i,j)
The matrix is then scanned: count how many E(i,j) values exceed the user-defined threshold (default 0.7). This count is the entangled pairs metric.
For visualization, the matrix is rendered as an N×N table where cell brightness maps to E(i,j) intensity.
5. Phase-Lock Detection
Step 1 : For all unique pairs (i, j), compute angular distance: Δφ = |φᵢ - φⱼ|
Step 2 : Wrap angles: if Δφ > 180°, set Δφ = 360° - Δφ
Step 3 : Find maximum: max_spread = max(Δφ) across all pairs
Step 4 : Compare to tolerance: phase_locked = (max_spread < tolerance)
If phase_locked is true, all oscillators are within the specified angular cone (e.g., 35°). This is a boolean confirmation filter.
6. Signal Generation Logic
Signals are generated through multi-layer confirmation:
Long Ignition Signal :
CI crosses above ignition threshold (e.g., 0.80)
AND dominant phase is in bullish range (-90° < φ_dom < +90°)
AND phase_locked = true
AND entangled_pairs >= minimum threshold (e.g., 4)
Short Ignition Signal :
CI crosses above ignition threshold
AND dominant phase is in bearish range (φ_dom < -90° OR φ_dom > +90°)
AND phase_locked = true
AND entangled_pairs >= minimum threshold
Collapse Signal :
CI at bar minus CI at current bar > collapse threshold (e.g., 0.55)
AND CI at bar was above 0.6 (must collapse from coherent state, not from already-low state)
These are strict conditions. A high CI alone does not generate a signal—dominant phase must align with direction, oscillators must be phase-locked, and sufficient pairwise entanglement must exist. This multi-factor gating dramatically reduces false signals compared to single-condition triggers.
Calculation Methodology
Phase 1: Oscillator Computation and Normalization
On each bar, the system calculates the raw values for all enabled oscillators using standard Pine Script functions:
RSI: ta.rsi(close, length)
MACD: ta.macd() returning histogram component
Stochastic: ta.stoch() smoothed with ta.sma()
CCI: ta.cci(close, length)
Williams %R: ta.wpr(length)
MFI: ta.mfi(hlc3, length)
ROC: ta.roc(close, length)
TSI: ta.tsi(close, short, long)
Each raw value is then passed through a normalization function:
normalize(value, overbought_level, oversold_level) = 2 × (value - oversold) / (overbought - oversold) - 1
This maps the oscillator's typical range to , where -1 represents extreme bearish, 0 represents neutral, and +1 represents extreme bullish.
For oscillators without fixed ranges (MACD, ROC, TSI), statistical normalization is used: divide by a rolling standard deviation or fixed divisor, then clamp to .
Phase 2: Phasor Extraction
For each normalized oscillator value val:
I = val (in-phase component)
Q = val - val (quadrature component, first difference)
Phase calculation:
phi_rad = atan2(Q, I)
phi_deg = phi_rad × (180 / π)
Amplitude calculation:
A = √(I² + Q²)
These values are stored in arrays: osc_phases and osc_amps for each oscillator n.
Phase 3: Complex Summation and Coherence
Initialize accumulators:
sum_cos = 0
sum_sin = 0
For each oscillator n = 0 to N-1:
phi_rad = osc_phases × (π / 180)
sum_cos += cos(phi_rad)
sum_sin += sin(phi_rad)
Resultant magnitude:
resultant_mag = √(sum_cos² + sum_sin²)
Coherence Index (raw):
CI_raw = resultant_mag / N
Smoothed CI:
CI = SMA(CI_raw, smoothing_window)
Dominant phase:
phi_dom_rad = atan2(sum_sin, sum_cos)
phi_dom_deg = phi_dom_rad × (180 / π)
Phase 4: Entanglement Matrix Population
For i = 0 to N-2:
For j = i+1 to N-1:
phi_i = osc_phases × (π / 180)
phi_j = osc_phases × (π / 180)
delta_phi = phi_i - phi_j
E = |cos(delta_phi)|
matrix_index_ij = i × N + j
matrix_index_ji = j × N + i
entangle_matrix = E
entangle_matrix = E
if E >= threshold:
entangled_pairs += 1
The matrix uses flat array storage with index mapping: index(row, col) = row × N + col.
Phase 5: Phase-Lock Check
max_spread = 0
For i = 0 to N-2:
For j = i+1 to N-1:
delta = |osc_phases - osc_phases |
if delta > 180:
delta = 360 - delta
max_spread = max(max_spread, delta)
phase_locked = (max_spread < tolerance)
Phase 6: Signal Evaluation
Ignition Long :
ignition_long = (CI crosses above threshold) AND
(phi_dom > -90 AND phi_dom < 90) AND
phase_locked AND
(entangled_pairs >= minimum)
Ignition Short :
ignition_short = (CI crosses above threshold) AND
(phi_dom < -90 OR phi_dom > 90) AND
phase_locked AND
(entangled_pairs >= minimum)
Collapse :
CI_prev = CI
collapse = (CI_prev - CI > collapse_threshold) AND (CI_prev > 0.6)
All signals are evaluated on bar close. The crossover and crossunder functions ensure signals fire only once when conditions transition from false to true.
Phase 7: Field Strength and Visualization Metrics
Average Amplitude :
avg_amp = (Σ osc_amps ) / N
Field Strength :
field_strength = CI × avg_amp
Collapse Risk (for dashboard):
collapse_risk = (CI - CI) / max(CI , 0.1)
collapse_risk_pct = clamp(collapse_risk × 100, 0, 100)
Quantum State Classification :
if (CI > threshold AND phase_locked):
state = "Ignition"
else if (CI > 0.6):
state = "Coherent"
else if (collapse):
state = "Collapse"
else:
state = "Chaos"
Phase 8: Visual Rendering
Orbit Plot : For each oscillator, convert polar (phase, amplitude) to Cartesian (x, y) for grid placement:
radius = amplitude × grid_center × 0.8
x = radius × cos(phase × π/180)
y = radius × sin(phase × π/180)
col = center + x (mapped to grid coordinates)
row = center - y
Heat Map : For each oscillator row and time column, retrieve historical phase value at lookback = (columns - col) × sample_rate, then map phase to color using a hue gradient.
Entanglement Web : Render matrix as table cell with background color opacity = E(i,j).
Field Cloud : Background color = (phi_dom > -90 AND phi_dom < 90) ? green : red, with opacity = mix(min_opacity, max_opacity, CI).
All visual components render only on the last bar (barstate.islast) to minimize computational overhead.
How to Use This Indicator
Step 1 : Apply QRFM to your chart. It works on all timeframes and asset classes, though 15-minute to 4-hour timeframes provide the best balance of responsiveness and noise reduction.
Step 2 : Enable the dashboard (default: top right) and the circular orbit plot (default: middle left). These are your primary visual feedback tools.
Step 3 : Optionally enable the heat map, entanglement web, and field cloud based on your preference. New users may find all visuals overwhelming; start with dashboard + orbit plot.
Step 4 : Observe for 50-100 bars to let the indicator establish baseline coherence patterns. Markets have different "normal" CI ranges—some instruments naturally run higher or lower coherence.
Understanding the Circular Orbit Plot
The orbit plot is a polar grid showing oscillator vectors in real-time:
Center point : Neutral (zero phase and amplitude)
Each vector : A line from center to a point on the grid
Vector angle : The oscillator's phase (0° = right/east, 90° = up/north, 180° = left/west, -90° = down/south)
Vector length : The oscillator's amplitude (short = weak signal, long = strong signal)
Vector label : First letter of oscillator name (R = RSI, M = MACD, etc.)
What to watch :
Convergence : When all vectors cluster in one quadrant or sector, CI is rising and coherence is forming. This is your pre-signal warning.
Scatter : When vectors point in random directions (360° spread), CI is low and the market is in a non-trending or transitional regime.
Rotation : When the cluster rotates smoothly around the circle, the ensemble is in coherent oscillation—typically seen during steady trends.
Sudden flips : When the cluster rapidly jumps from one side to the opposite (e.g., +90° to -90°), a phase reversal has occurred—often coinciding with trend reversals.
Example: If you see RSI, MACD, and Stochastic all pointing toward 45° (northeast) with long vectors, while CCI, TSI, and ROC point toward 40-50° as well, coherence is high and dominant phase is bullish. Expect an ignition signal if CI crosses threshold.
Reading Dashboard Metrics
The dashboard provides numerical confirmation of what the orbit plot shows visually:
CI : Displays as 0-100%. Above 70% = high coherence (strong regime), 40-70% = moderate, below 40% = low (poor conditions for trend entries).
Dom Phase : Angle in degrees with directional arrow. ⬆ = bullish bias, ⬇ = bearish bias, ⬌ = neutral.
Field Strength : CI weighted by amplitude. High values (> 0.6) indicate not just alignment but strong alignment.
Entangled Pairs : Count of oscillator pairs with E > threshold. Higher = more confirmation. If minimum is set to 4, you need at least 4 pairs entangled for signals.
Phase Lock : 🔒 YES (all oscillators within tolerance) or 🔓 NO (spread too wide).
State : Real-time classification:
🚀 IGNITION: CI just crossed threshold with phase-lock
⚡ COHERENT: CI is high and stable
💥 COLLAPSE: CI has dropped sharply
🌀 CHAOS: Low CI, scattered phases
Collapse Risk : 0-100% scale based on recent CI change. Above 50% warns of imminent breakdown.
Interpreting Signals
Long Ignition (Blue Triangle Below Price) :
Occurs when CI crosses above threshold (e.g., 0.80)
Dominant phase is in bullish range (-90° to +90°)
All oscillators are phase-locked (within tolerance)
Minimum entangled pairs requirement met
Interpretation : The oscillator ensemble has transitioned from disorder to coherent bullish alignment. This is a high-probability long entry point. The multi-layer confirmation (CI + phase direction + lock + entanglement) ensures this is not a single-oscillator whipsaw.
Short Ignition (Red Triangle Above Price) :
Same conditions as long, but dominant phase is in bearish range (< -90° or > +90°)
Interpretation : Coherent bearish alignment has formed. High-probability short entry.
Collapse (Circles Above and Below Price) :
CI has dropped by more than the collapse threshold (e.g., 0.55) over a 5-bar window
CI was previously above 0.6 (collapsing from coherent state)
Interpretation : Phase coherence has broken down. If you are in a position, this is an exit warning. If looking to enter, stand aside—regime is transitioning.
Phase-Time Heat Map Patterns
Enable the heat map and position it at bottom right. The rows represent individual oscillators, columns represent time bins (most recent on left).
Pattern: Horizontal Color Bands
If a row (e.g., RSI) shows consistent color across columns (say, green for several bins), that oscillator has maintained stable phase over time. If all rows show horizontal bands of similar color, the entire ensemble has been phase-locked for an extended period—this is a strong trending regime.
Pattern: Vertical Color Bands
If a column (single time bin) shows all cells with the same or very similar color, that moment in time had high coherence. These vertical bands often align with ignition signals or major price pivots.
Pattern: Rainbow Chaos
If cells are random colors (red, green, yellow mixed with no pattern), coherence is low. The ensemble is scattered. Avoid trading during these periods unless you have external confirmation.
Pattern: Color Transition
If you see a row transition from red to green (or vice versa) sharply, that oscillator has phase-flipped. If multiple rows do this simultaneously, a regime change is underway.
Entanglement Web Analysis
Enable the web matrix (default: opposite corner from heat map). It shows an N×N grid where N = number of active oscillators.
Bright Yellow/Gold Cells : High pairwise entanglement. For example, if the RSI-MACD cell is bright gold, those two oscillators are moving in phase. If the RSI-Stochastic cell is bright, they are entangled as well.
Dark Gray Cells : Low entanglement. Oscillators are decorrelated or in quadrature.
Diagonal : Always marked with "—" because an oscillator is always perfectly entangled with itself.
How to use :
Scan for clustering: If most cells are bright, coherence is high across the board. If only a few cells are bright, coherence is driven by a subset (e.g., RSI and MACD are aligned, but nothing else is—weak signal).
Identify laggards: If one row/column is entirely dark, that oscillator is the outlier. You may choose to disable it or monitor for when it joins the group (late confirmation).
Watch for web formation: During low-coherence periods, the matrix is mostly dark. As coherence builds, cells begin lighting up. A sudden "web" of connections forming visually precedes ignition signals.
Trading Workflow
Step 1: Monitor Coherence Level
Check the dashboard CI metric or observe the orbit plot. If CI is below 40% and vectors are scattered, conditions are poor for trend entries. Wait.
Step 2: Detect Coherence Building
When CI begins rising (say, from 30% to 50-60%) and you notice vectors on the orbit plot starting to cluster, coherence is forming. This is your alert phase—do not enter yet, but prepare.
Step 3: Confirm Phase Direction
Check the dominant phase angle and the orbit plot quadrant where clustering is occurring:
Clustering in right half (0° to ±90°): Bullish bias forming
Clustering in left half (±90° to 180°): Bearish bias forming
Verify the dashboard shows the corresponding directional arrow (⬆ or ⬇).
Step 4: Wait for Signal Confirmation
Do not enter based on rising CI alone. Wait for the full ignition signal:
CI crosses above threshold
Phase-lock indicator shows 🔒 YES
Entangled pairs count >= minimum
Directional triangle appears on chart
This ensures all layers have aligned.
Step 5: Execute Entry
Long : Blue triangle below price appears → enter long
Short : Red triangle above price appears → enter short
Step 6: Position Management
Initial Stop : Place stop loss based on your risk management rules (e.g., recent swing low/high, ATR-based buffer).
Monitoring :
Watch the field cloud density. If it remains opaque and colored in your direction, the regime is intact.
Check dashboard collapse risk. If it rises above 50%, prepare for exit.
Monitor the orbit plot. If vectors begin scattering or the cluster flips to the opposite side, coherence is breaking.
Exit Triggers :
Collapse signal fires (circles appear)
Dominant phase flips to opposite half-plane
CI drops below 40% (coherence lost)
Price hits your profit target or trailing stop
Step 7: Post-Exit Analysis
After exiting, observe whether a new ignition forms in the opposite direction (reversal) or if CI remains low (transition to range). Use this to decide whether to re-enter, reverse, or stand aside.
Best Practices
Use Price Structure as Context
QRFM identifies when coherence forms but does not specify where price will go. Combine ignition signals with support/resistance levels, trendlines, or chart patterns. For example:
Long ignition near a major support level after a pullback: high-probability bounce
Long ignition in the middle of a range with no structure: lower probability
Multi-Timeframe Confirmation
Open QRFM on two timeframes simultaneously:
Higher timeframe (e.g., 4-hour): Use CI level to determine regime bias. If 4H CI is above 60% and dominant phase is bullish, the market is in a bullish regime.
Lower timeframe (e.g., 15-minute): Execute entries on ignition signals that align with the higher timeframe bias.
This prevents counter-trend trades and increases win rate.
Distinguish Between Regime Types
High CI, stable dominant phase (State: Coherent) : Trending market. Ignitions are continuation signals; collapses are profit-taking or reversal warnings.
Low CI, erratic dominant phase (State: Chaos) : Ranging or choppy market. Avoid ignition signals or reduce position size. Wait for coherence to establish.
Moderate CI with frequent collapses : Whipsaw environment. Use wider stops or stand aside.
Adjust Parameters to Instrument and Timeframe
Crypto/Forex (high volatility) : Lower ignition threshold (0.65-0.75), lower CI smoothing (2-3), shorter oscillator lengths (7-10).
Stocks/Indices (moderate volatility) : Standard settings (threshold 0.75-0.85, smoothing 5-7, oscillator lengths 14).
Lower timeframes (5-15 min) : Reduce phase sample rate to 1-2 for responsiveness.
Higher timeframes (daily+) : Increase CI smoothing and oscillator lengths for noise reduction.
Use Entanglement Count as Conviction Filter
The minimum entangled pairs setting controls signal strictness:
Low (1-2) : More signals, lower quality (acceptable if you have other confirmation)
Medium (3-5) : Balanced (recommended for most traders)
High (6+) : Very strict, fewer signals, highest quality
Adjust based on your trade frequency preference and risk tolerance.
Monitor Oscillator Contribution
Use the entanglement web to see which oscillators are driving coherence. If certain oscillators are consistently dark (low E with all others), they may be adding noise. Consider disabling them. For example:
On low-volume instruments, MFI may be unreliable → disable MFI
On strongly trending instruments, mean-reversion oscillators (Stochastic, RSI) may lag → reduce weight or disable
Respect the Collapse Signal
Collapse events are early warnings. Price may continue in the original direction for several bars after collapse fires, but the underlying regime has weakened. Best practice:
If in profit: Take partial or full profit on collapse
If at breakeven/small loss: Exit immediately
If collapse occurs shortly after entry: Likely a false ignition; exit to avoid drawdown
Collapses do not guarantee immediate reversals—they signal uncertainty .
Combine with Volume Analysis
If your instrument has reliable volume:
Ignitions with expanding volume: Higher conviction
Ignitions with declining volume: Weaker, possibly false
Collapses with volume spikes: Strong reversal signal
Collapses with low volume: May just be consolidation
Volume is not built into QRFM (except via MFI), so add it as external confirmation.
Observe the Phase Spiral
The spiral provides a quick visual cue for rotation consistency:
Tight, smooth spiral : Ensemble is rotating coherently (trending)
Loose, erratic spiral : Phase is jumping around (ranging or transitional)
If the spiral tightens, coherence is building. If it loosens, coherence is dissolving.
Do Not Overtrade Low-Coherence Periods
When CI is persistently below 40% and the state is "Chaos," the market is not in a regime where phase analysis is predictive. During these times:
Reduce position size
Widen stops
Wait for coherence to return
QRFM's strength is regime detection. If there is no regime, the tool correctly signals "stand aside."
Use Alerts Strategically
Set alerts for:
Long Ignition
Short Ignition
Collapse
Phase Lock (optional)
Configure alerts to "Once per bar close" to avoid intrabar repainting and noise. When an alert fires, manually verify:
Orbit plot shows clustering
Dashboard confirms all conditions
Price structure supports the trade
Do not blindly trade alerts—use them as prompts for analysis.
Ideal Market Conditions
Best Performance
Instruments :
Liquid, actively traded markets (major forex pairs, large-cap stocks, major indices, top-tier crypto)
Instruments with clear cyclical oscillator behavior (avoid extremely illiquid or manipulated markets)
Timeframes :
15-minute to 4-hour: Optimal balance of noise reduction and responsiveness
1-hour to daily: Slower, higher-conviction signals; good for swing trading
5-minute: Acceptable for scalping if parameters are tightened and you accept more noise
Market Regimes :
Trending markets with periodic retracements (where oscillators cycle through phases predictably)
Breakout environments (coherence forms before/during breakout; collapse occurs at exhaustion)
Rotational markets with clear swings (oscillators phase-lock at turning points)
Volatility :
Moderate to high volatility (oscillators have room to move through their ranges)
Stable volatility regimes (sudden VIX spikes or flash crashes may create false collapses)
Challenging Conditions
Instruments :
Very low liquidity markets (erratic price action creates unstable oscillator phases)
Heavily news-driven instruments (fundamentals may override technical coherence)
Highly correlated instruments (oscillators may all reflect the same underlying factor, reducing independence)
Market Regimes :
Deep, prolonged consolidation (oscillators remain near neutral, CI is chronically low, few signals fire)
Extreme chop with no directional bias (oscillators whipsaw, coherence never establishes)
Gap-driven markets (large overnight gaps create phase discontinuities)
Timeframes :
Sub-5-minute charts: Noise dominates; oscillators flip rapidly; coherence is fleeting and unreliable
Weekly/monthly: Oscillators move extremely slowly; signals are rare; better suited for long-term positioning than active trading
Special Cases :
During major economic releases or earnings: Oscillators may lag price or become decorrelated as fundamentals overwhelm technicals. Reduce position size or stand aside.
In extremely low-volatility environments (e.g., holiday periods): Oscillators compress to neutral, CI may be artificially high due to lack of movement, but signals lack follow-through.
Adaptive Behavior
QRFM is designed to self-adapt to poor conditions:
When coherence is genuinely absent, CI remains low and signals do not fire
When only a subset of oscillators aligns, entangled pairs count stays below threshold and signals are filtered out
When phase-lock cannot be achieved (oscillators too scattered), the lock filter prevents signals
This means the indicator will naturally produce fewer (or zero) signals during unfavorable conditions, rather than generating false signals. This is a feature —it keeps you out of low-probability trades.
Parameter Optimization by Trading Style
Scalping (5-15 Minute Charts)
Goal : Maximum responsiveness, accept higher noise
Oscillator Lengths :
RSI: 7-10
MACD: 8/17/6
Stochastic: 8-10, smooth 2-3
CCI: 14-16
Others: 8-12
Coherence Settings :
CI Smoothing Window: 2-3 bars (fast reaction)
Phase Sample Rate: 1 (every bar)
Ignition Threshold: 0.65-0.75 (lower for more signals)
Collapse Threshold: 0.40-0.50 (earlier exit warnings)
Confirmation :
Phase Lock Tolerance: 40-50° (looser, easier to achieve)
Min Entangled Pairs: 2-3 (fewer oscillators required)
Visuals :
Orbit Plot + Dashboard only (reduce screen clutter for fast decisions)
Disable heavy visuals (heat map, web) for performance
Alerts :
Enable all ignition and collapse alerts
Set to "Once per bar close"
Day Trading (15-Minute to 1-Hour Charts)
Goal : Balance between responsiveness and reliability
Oscillator Lengths :
RSI: 14 (standard)
MACD: 12/26/9 (standard)
Stochastic: 14, smooth 3
CCI: 20
Others: 10-14
Coherence Settings :
CI Smoothing Window: 3-5 bars (balanced)
Phase Sample Rate: 2-3
Ignition Threshold: 0.75-0.85 (moderate selectivity)
Collapse Threshold: 0.50-0.55 (balanced exit timing)
Confirmation :
Phase Lock Tolerance: 30-40° (moderate tightness)
Min Entangled Pairs: 4-5 (reasonable confirmation)
Visuals :
Orbit Plot + Dashboard + Heat Map or Web (choose one)
Field Cloud for regime backdrop
Alerts :
Ignition and collapse alerts
Optional phase-lock alert for advance warning
Swing Trading (4-Hour to Daily Charts)
Goal : High-conviction signals, minimal noise, fewer trades
Oscillator Lengths :
RSI: 14-21
MACD: 12/26/9 or 19/39/9 (longer variant)
Stochastic: 14-21, smooth 3-5
CCI: 20-30
Others: 14-20
Coherence Settings :
CI Smoothing Window: 5-10 bars (very smooth)
Phase Sample Rate: 3-5
Ignition Threshold: 0.80-0.90 (high bar for entry)
Collapse Threshold: 0.55-0.65 (only significant breakdowns)
Confirmation :
Phase Lock Tolerance: 20-30° (tight clustering required)
Min Entangled Pairs: 5-7 (strong confirmation)
Visuals :
All modules enabled (you have time to analyze)
Heat Map for multi-bar pattern recognition
Web for deep confirmation analysis
Alerts :
Ignition and collapse
Review manually before entering (no rush)
Position/Long-Term Trading (Daily to Weekly Charts)
Goal : Rare, very high-conviction regime shifts
Oscillator Lengths :
RSI: 21-30
MACD: 19/39/9 or 26/52/12
Stochastic: 21, smooth 5
CCI: 30-50
Others: 20-30
Coherence Settings :
CI Smoothing Window: 10-14 bars
Phase Sample Rate: 5 (every 5th bar to reduce computation)
Ignition Threshold: 0.85-0.95 (only extreme alignment)
Collapse Threshold: 0.60-0.70 (major regime breaks only)
Confirmation :
Phase Lock Tolerance: 15-25° (very tight)
Min Entangled Pairs: 6+ (broad consensus required)
Visuals :
Dashboard + Orbit Plot for quick checks
Heat Map to study historical coherence patterns
Web to verify deep entanglement
Alerts :
Ignition only (collapses are less critical on long timeframes)
Manual review with fundamental analysis overlay
Performance Optimization (Low-End Systems)
If you experience lag or slow rendering:
Reduce Visual Load :
Orbit Grid Size: 8-10 (instead of 12+)
Heat Map Time Bins: 5-8 (instead of 10+)
Disable Web Matrix entirely if not needed
Disable Field Cloud and Phase Spiral
Reduce Calculation Frequency :
Phase Sample Rate: 5-10 (calculate every 5-10 bars)
Max History Depth: 100-200 (instead of 500+)
Disable Unused Oscillators :
If you only want RSI, MACD, and Stochastic, disable the other five. Fewer oscillators = smaller matrices, faster loops.
Simplify Dashboard :
Choose "Small" dashboard size
Reduce number of metrics displayed
These settings will not significantly degrade signal quality (signals are based on bar-close calculations, which remain accurate), but will improve chart responsiveness.
Important Disclaimers
This indicator is a technical analysis tool designed to identify periods of phase coherence across an ensemble of oscillators. It is not a standalone trading system and does not guarantee profitable trades. The Coherence Index, dominant phase, and entanglement metrics are mathematical calculations applied to historical price data—they measure past oscillator behavior and do not predict future price movements with certainty.
No Predictive Guarantee : High coherence indicates that oscillators are currently aligned, which historically has coincided with trending or directional price movement. However, past alignment does not guarantee future trends. Markets can remain coherent while prices consolidate, or lose coherence suddenly due to news, liquidity changes, or other factors not captured by oscillator mathematics.
Signal Confirmation is Probabilistic : The multi-layer confirmation system (CI threshold + dominant phase + phase-lock + entanglement) is designed to filter out low-probability setups. This increases the proportion of valid signals relative to false signals, but does not eliminate false signals entirely. Users should combine QRFM with additional analysis—support and resistance levels, volume confirmation, multi-timeframe alignment, and fundamental context—before executing trades.
Collapse Signals are Warnings, Not Reversals : A coherence collapse indicates that the oscillator ensemble has lost alignment. This often precedes trend exhaustion or reversals, but can also occur during healthy pullbacks or consolidations. Price may continue in the original direction after a collapse. Use collapses as risk management cues (tighten stops, take partial profits) rather than automatic reversal entries.
Market Regime Dependency : QRFM performs best in markets where oscillators exhibit cyclical, mean-reverting behavior and where trends are punctuated by retracements. In markets dominated by fundamental shocks, gap openings, or extreme low-liquidity conditions, oscillator coherence may be less reliable. During such periods, reduce position size or stand aside.
Risk Management is Essential : All trading involves risk of loss. Use appropriate stop losses, position sizing, and risk-per-trade limits. The indicator does not specify stop loss or take profit levels—these must be determined by the user based on their risk tolerance and account size. Never risk more than you can afford to lose.
Parameter Sensitivity : The indicator's behavior changes with input parameters. Aggressive settings (low thresholds, loose tolerances) produce more signals with lower average quality. Conservative settings (high thresholds, tight tolerances) produce fewer signals with higher average quality. Users should backtest and forward-test parameter sets on their specific instruments and timeframes before committing real capital.
No Repainting by Design : All signal conditions are evaluated on bar close using bar-close values. However, the visual components (orbit plot, heat map, dashboard) update in real-time during bar formation for monitoring purposes. For trade execution, rely on the confirmed signals (triangles and circles) that appear only after the bar closes.
Computational Load : QRFM performs extensive calculations, including nested loops for entanglement matrices and real-time table rendering. On lower-powered devices or when running multiple indicators simultaneously, users may experience lag. Use the performance optimization settings (reduce visual complexity, increase phase sample rate, disable unused oscillators) to improve responsiveness.
This system is most effective when used as one component within a broader trading methodology that includes sound risk management, multi-timeframe analysis, market context awareness, and disciplined execution. It is a tool for regime detection and signal confirmation, not a substitute for comprehensive trade planning.
Technical Notes
Calculation Timing : All signal logic (ignition, collapse) is evaluated using bar-close values. The barstate.isconfirmed or implicit bar-close behavior ensures signals do not repaint. Visual components (tables, plots) render on every tick for real-time feedback but do not affect signal generation.
Phase Wrapping : Phase angles are calculated in the range -180° to +180° using atan2. Angular distance calculations account for wrapping (e.g., the distance between +170° and -170° is 20°, not 340°). This ensures phase-lock detection works correctly across the ±180° boundary.
Array Management : The indicator uses fixed-size arrays for oscillator phases, amplitudes, and the entanglement matrix. The maximum number of oscillators is 8. If fewer oscillators are enabled, array sizes shrink accordingly (only active oscillators are processed).
Matrix Indexing : The entanglement matrix is stored as a flat array with size N×N, where N is the number of active oscillators. Index mapping: index(row, col) = row × N + col. Symmetric pairs (i,j) and (j,i) are stored identically.
Normalization Stability : Oscillators are normalized to using fixed reference levels (e.g., RSI overbought/oversold at 70/30). For unbounded oscillators (MACD, ROC, TSI), statistical normalization (division by rolling standard deviation) is used, with clamping to prevent extreme outliers from distorting phase calculations.
Smoothing and Lag : The CI smoothing window (SMA) introduces lag proportional to the window size. This is intentional—it filters out single-bar noise spikes in coherence. Users requiring faster reaction can reduce the smoothing window to 1-2 bars, at the cost of increased sensitivity to noise.
Complex Number Representation : Pine Script does not have native complex number types. Complex arithmetic is implemented using separate real and imaginary accumulators (sum_cos, sum_sin) and manual calculation of magnitude (sqrt(real² + imag²)) and argument (atan2(imag, real)).
Lookback Limits : The indicator respects Pine Script's maximum lookback constraints. Historical phase and amplitude values are accessed using the operator, with lookback limited to the chart's available bar history (max_bars_back=5000 declared).
Visual Rendering Performance : Tables (orbit plot, heat map, web, dashboard) are conditionally deleted and recreated on each update using table.delete() and table.new(). This prevents memory leaks but incurs redraw overhead. Rendering is restricted to barstate.islast (last bar) to minimize computational load—historical bars do not render visuals.
Alert Condition Triggers : alertcondition() functions evaluate on bar close when their boolean conditions transition from false to true. Alerts do not fire repeatedly while a condition remains true (e.g., CI stays above threshold for 10 bars fires only once on the initial cross).
Color Gradient Functions : The phaseColor() function maps phase angles to RGB hues using sine waves offset by 120° (red, green, blue channels). This creates a continuous spectrum where -180° to +180° spans the full color wheel. The amplitudeColor() function maps amplitude to grayscale intensity. The coherenceColor() function uses cos(phase) to map contribution to CI (positive = green, negative = red).
No External Data Requests : QRFM operates entirely on the chart's symbol and timeframe. It does not use request.security() or access external data sources. All calculations are self-contained, avoiding lookahead bias from higher-timeframe requests.
Deterministic Behavior : Given identical input parameters and price data, QRFM produces identical outputs. There are no random elements, probabilistic sampling, or time-of-day dependencies.
— Dskyz, Engineering precision. Trading coherence.

Trading Mastery Indicator# Trading Mastery Indicator - Complete User Guide
## Overview
The Trading Mastery Indicator is a professional-grade technical analysis tool that provides high-probability trading signals with complete trade management information including entry, stop loss, and take profit levels.
## Key Features
- High-Quality Signal Detection: Identifies strong, medium, and weak trading opportunities
- Complete Trade Setup: Provides entry, stop loss, and take profit for every signal
- Risk Management: Calculates risk-to-reward ratios automatically
- Elliott Wave Analysis: Integrated wave pattern and position analysis
- Active Signal Tracking: Shows when you're currently in a trade
- Professional Alerts: Detailed notifications with all trade parameters
## Signal Quality Classification
### STRONG Signals (Premium Quality)
- Reliability: Highest probability setups
- Market Conditions: Strong trending environments
- Color: Teal for buys, Red for sells
- When to Trade: These are your primary trading opportunities
- Risk Profile: Lowest risk, highest reward potential
### MEDIUM Signals (Standard Quality)
- Reliability: Good probability setups
- Market Conditions: Moderate trend or consolidation breakouts
- Color: Gold for buys, Purple for sells (Change to Blue Gray)
- When to Trade: Secondary opportunities when strong signals are scarce
- Risk Profile: Moderate risk, good reward potential
### WEAK Signals (Entry Quality)
- Reliability: Lower probability setups
- Market Conditions: Counter-trend or unclear market structure
- Color: Coral for buys, Pink for sells
- When to Trade: Only for experienced traders in specific market conditions
- Risk Profile: Higher risk, variable reward
## How to Use the Indicator
### 1. Signal Settings Configuration
Signal Filter Options:
- All Signals: Shows every trading opportunity (strong, medium, weak)
- High Quality Only: Shows only the highest probability setups
- High + Medium Quality**: Balanced approach filtering out weak signals
Recommended Settings by Experience:
- Beginner: Use "High Quality Only"
- Intermediate: Use "High + Medium Quality"
- Advanced: Use "All Signals" with proper risk management
Label Controls:
- Label Position: Adjust how close labels appear to candles
- Label Text Size: Choose based on screen size and preference
- Maximum Labels: Control chart clutter (recommended: 20)
### 2. Understanding the Professional Panel
The panel provides real-time market intelligence:
Primary Trend: Market direction analysis
- BULLISH TREND: Look for buy opportunities only
- BEARISH TREND: Look for sell opportunities only
- CONSOLIDATION: Market indecision, trade with caution
Wave Pattern: Elliott Wave structure analysis
- IMPULSE UP: Strong bullish momentum
- IMPULSE DOWN: Strong bearish momentum
- CORRECTION: Sideways/corrective movement
Wave Position: Current Elliott Wave position
- WAVE 3 (STRONG): Most powerful moves, best for trend following
- WAVE 1 OR 5: Beginning or ending waves
- WAVE 2 OR 4: Corrective phases, lower probability
- CORRECTIVE ABC: Wait for pattern completion
Signal Grade: Current signal status
- SIGNAL ACTIVE: You're currently in a trade
- PREMIUM/STANDARD/SPECULATIVE: New signal quality
- NO SIGNAL: No current opportunities
Trading Bias: Overall market direction
- LONG BIAS: Focus on buy opportunities
- SHORT BIAS: Focus on sell opportunities
- NEUTRAL: No clear directional bias
### 3. Reading Signal Labels
Each signal provides complete trade setup information:
```
STRONG BUY
━━━━━━━━━━━━━━━━━━━━
💰 Entry: 1875.50
🛡️ SL: 1860.25
🎯 TP: 1905.75
📈 R:R = 1:2.0
━━━━━━━━━━━━━━━━━━━━
```
Understanding the Information:
- Entry: Exact price level to enter the trade
- SL: Stop loss level (risk management)
- TP: Take profit level (profit target)
- R:R: Risk-to-reward ratio (1:2.0 means you risk 1 to make 2)
### 4. Entry/TP/SL Level Lines
Visual trade management aids:
- Blue Solid Line: Entry level
- Red Dashed Line: Stop loss level
- Green Dashed Line: Take profit level
- Small Labels: "ENTRY", "SL", "TP" markers
## Trading Strategy Guidelines
### Trend Following Strategy
1. Check Panel: Ensure trend aligns with your trade direction
2. Wait for Signals: Only trade in the direction of the primary trend
3. Quality First: Focus on STRONG signals during trending markets
4. Wave Timing: WAVE 3 positions offer the best trending opportunities
### Reversal Strategy
1. Look for Divergence: Panel shows trend change signals
2. Wait for Confirmation: Don't jump early on potential reversals
3. Use MEDIUM Signals: Often good for catching early trend changes
4. Watch Wave Position: CORRECTIVE ABC patterns may signal trend completion
### Risk Management Rules
Position Sizing:
- Risk no more than 1-2% of account per trade
- Use the provided R:R ratios to calculate position sizes
- Stronger signals can justify slightly larger positions
Stop Loss Management:
- Always use the provided stop loss levels
- Never move stops against your position
- Consider trailing stops once trade moves in your favor
Take Profit Strategy:
- Use provided TP levels as minimum targets
- Consider taking partial profits at TP level
- Let strong trends run beyond TP in trending markets
## Best Practices by Timeframe
### Scalping (M1-M5)
- Use "High Quality Only" filter
- Focus on STRONG signals only
- Quick entry and exit
- Expect more false signals due to market noise
### Intraday Trading (M15-H1)
- Use "High + Medium Quality" filter
- Good balance of opportunity and reliability
- Hold trades for several hours
- Most versatile timeframe for the indicator
### Swing Trading (H4-Daily)
- Use "All Signals" with proper analysis
- Hold trades for days to weeks
- Most reliable signals on higher timeframes
- Best for beginners due to less noise
## Panel Customization
Position Options:
- Top Right: Default, doesn't interfere with price action
- Top Left: Good for wide screens
- Bottom corners: Keeps important info visible while analyzing tops
- Middle positions: Central reference, good for multi-monitor setups
Size Options:
- Small: Minimal screen space, good for small screens
- Normal: Balanced visibility and space usage
- Large: Easy reading, good for detailed analysis
Transparency: Adjust 0-95% based on preference and chart background
## Common Mistakes to Avoid
### Signal Interpretation Errors
- Don't ignore the trend: Trading against primary trend reduces success
- Don't chase weak signals: Focus on quality over quantity
- Don't ignore wave position: WAVE 2/4 corrections are lower probability
### Risk Management Errors
- Don't skip stop losses: Every signal includes SL for a reason
- Don't risk too much: Even strong signals can fail
- Don't move stops against position: Stick to the plan
### Psychological Errors
- Don't overtrade: Wait for quality setups
- Don't second-guess strong signals: Trust the analysis
- Don't panic on normal drawdowns: Expect some losing trades
## Alert Configuration
Enable alerts for:
- Strong signals: Primary trading opportunities
- Medium signals: Secondary opportunities (optional)
- Signal active status: Know when you're in trades
Alert messages include complete trade information for easy execution.
## Performance Optimization
### For Best Results:
1. Combine with price action: Look for confluence with support/resistance
2. Consider market sessions: Different sessions have different characteristics
3. Monitor news events: Avoid trading during high-impact news
4. Keep a trading journal: Track which signals work best for your style
### Regular Review:
- Weekly analysis: Review which signal types performed best
- Timeframe assessment: Determine your most profitable timeframes
- Strategy refinement: Adjust filters based on performance data
## Troubleshooting
If you're not seeing signals:
- Check that "Show Buy/Sell Signals" is enabled
- Verify your signal filter isn't too restrictive
- Market may be in a consolidation phase
If labels are cluttered:
- Reduce "Maximum Labels to Show"
- Change label position to "Far from Candle"
- Use smaller label text size
If panel is in the way:
- Change panel position
- Increase transparency
- Reduce panel size
- Toggle panel off temporarily
Remember: This indicator provides analysis and signals, but successful trading also requires proper risk management, emotional discipline, and understanding of market conditions. Always practice with demo accounts before risking real capital, and never risk more than you can afford to lose.

OptionHawk1. What makes the script original?
• Unique concept: It integrates a Keltner based custom supertrend with a multi-EMA energy visualization, ATR based multi target management, and on chart options (CALL/PUT) trade signals—creating a toolkit not found in typical public scripts.
• Innovative use: Instead of off the shelf indicators, it reinvents them:
• Keltner bands used as dynamic Supertrend triggers.
• Fifteen EMAs layered for “energy” zones (bullish/bearish heatmaps).
• ATR dynamically scales multi-TP levels and stop loss.
These are creatively fused into a unified signal and automation engine.
________________________________________
2. What value does it provide to traders?
• Clear entries & exits: Labels for entry price/time, five TP levels, and SL structure eliminate guesswork.
• Visualization & automation: Real-time bar coloring and energy overlays allow quick momentum reads.
• Targeted to common pain points: Many traders struggle with manual TP/SL and entry timing—this automates that process.
• Ready for real use: Just plug into intraday (e.g., 5 min) or swing setups; no manual calculations. Signals are actionable out of the box.
________________________________________
3. Why invite only (worth paying)?
• Proprietary fusion: Public indicators like Supertrend or EMA are common—but your layered use, ATR based scaling, and label logic are exclusive.
• Auto-generated options format: Unique labeling for CALL/PUT, with graphical on chart signals, isn’t offered freely elsewhere.
• Time-saver & edge-provider: Saves traders hours of configuration and enhances consistency—worth the subscription cost over piecing together mash ups.
________________________________________
4. How does it work?
• Signal backbone: Custom supertrend uses Keltner bands crossing with close for direction, filtered by trend direction EMAs.
• Multi time logic: Trend defined by crossover of price over dynamic SMA thresholds built from ATR.
• Energy bar-colors/EMAs: 15 fast EMAs color-coded green/red to instantly show momentum.
• Entry logic: “Bull” when close crosses above supertrend; “Bear” when crosses below.
• Risk management: SL set at previous bar; up to 5 ATR scaled targets (or percentage based).
• Options formatted alerts: CALL/PUT labels with ₹¬currency values, embedded timestamp, SL/TP all printed on the chart.
________________________________________
5. How should traders use it?
• Best markets & timeframes: Ideal for intraday / low timeframe (1 15m) setups and 1 hour swing trades in equities, indices, options.
• Conditions: Works best in trending or volatility driven sessions—visible via Keltner bands and EMA energy alignment.
• Recommended combo: Use alongside volume filters or broader cycles; when supertrend & energy EMAs align, validation is stronger.
________________________________________
6. Proof of effectiveness?
• On chart visuals: Entry/exit labels, confirmed labels, TP and SL markers make past hits obvious.
• Real trade examples: Highlighted both bull & bear setups with full profit realization or SL hits.
• Performance is paint tested: Easy to showcase historic signals across multiple tickers.
• Data-backed: Users can export chart data to calculate win rate and avg return per trade.
________________________________________
Summary Pitch:
OptionHawk offers a holistic, execution-ready trading tool:
1. Proprietary blend of Keltner-supertrend and layered EMAs—beyond standard scripts.
2. Automates entries, multi-tier targets, SL, and options-format labels.
3. Visual energy overlays for quick momentum readings.
4. Use-tested in intraday and swing markets.
5. Installs on chart and works immediately—no setup complexity.
It's not a public indicator package; it's a self-contained, plug and play trade catalyst—worth subscribing for active traders seeking clarity, speed, and structure in their decision-making.
6. While OptionHawk is designed for clarity and structure, no script can predict the market. Always use with discretion and proper risk management.
---------------------------------------------------------------------------------------------------------------------
OptionHawk: A Comprehensive Trend-Following & Volatility-Adaptive Trading System
The "OptionHawk" script is a sophisticated trading tool designed to provide clear, actionable signals for options trading by combining multiple technical indicators and custom logic. It aims to offer a holistic view of market conditions, identifying trend direction, momentum, and potential entry/exit points with dynamic stop-loss and take-profit levels.
________________________________________
1. Why These Specific Indicators and Code Elements?
The "OptionHawk" script is a strategic fusion of the Supertrend indicator (modified with Keltner Channels), a multi-EMA "Energy" ribbon, dynamic trend lines (based on SMA and ATR), a 100-period Trend Filter EMA, and comprehensive trade management logic (SL/TP). My reason and motivation for this mashup stem from a desire to create a robust system that accounts for various market aspects often overlooked by individual indicators:
• Supertrend with Keltner Channels: The standard Supertrend is effective for trend identification but can sometimes generate whipsaws in volatile or ranging markets. By integrating Keltner Channels into the Supertrend calculation, the volatility measure becomes more adaptive, using the (high - low) range within the Keltner Channel for its ATR-like component. This aims to create a more responsive yet less prone-to-false-signals Supertrend.
• Multi-EMA "Energy" Ribbon: This visually striking element, composed of 15 EMAs, provides a quick glance at short-to-medium term momentum and potential support/resistance zones. When these EMAs are stacked and moving in one direction, it indicates strong "energy" behind the trend, reinforcing the signals from other indicators.
• Dynamic Trend Lines (SMA + ATR): These lines offer a visual representation of support and resistance that adapts to market volatility. Unlike static trend lines, their ATR-based offset ensures they remain relevant across different market conditions and asset classes, providing context for price action relative to the underlying trend.
• 100-Period Trend Filter EMA: A longer-period EMA acts as a higher-timeframe trend filter. This is crucial for confirming the direction identified by the faster-acting Supertrend, helping to avoid trades against the prevailing broader trend.
• Comprehensive Trade Management Logic: The script integrates automated calculation and display of stop-loss (SL) and multiple take-profit (TP) levels, along with trade confirmation and "TP Hit" labels. This is critical for practical trading, providing immediate, calculated risk-reward parameters that individual indicators typically don't offer.
This combination is driven by the need for a multi-faceted approach to trading that goes beyond simple signal generation to include trend confirmation, volatility adaptation, and essential risk management.
________________________________________
2. What Problem or Need Does This Mashup Solve?
This mashup addresses several critical gaps that existing individual indicators often fail to fill:
• Reliable Trend Identification in Volatile Markets: While Supertrend is good, it can be late or whipsaw. Integrating Keltner Channels helps it adapt to changing volatility, providing more reliable trend signals.
• Confirmation of Signals: A common pitfall of relying on a single indicator is false signals. "OptionHawk" uses the multi-EMA "Energy" ribbon and the 100-period EMA to confirm the trend identified by the Keltner-Supertrend, reducing false entries.
• Dynamic Support/Resistance & Trend Context: Static support and resistance levels can quickly become irrelevant. The dynamic SMA + ATR trend lines provide continually adjusting zones that reflect the current market's true support and resistance, giving traders a better understanding of price action within the trend.
• Integrated Risk and Reward Management: Most indicators just give entry signals. This script goes a significant step further by automatically calculating and displaying clear stop-loss and up to five take-profit levels (either ATR-based or percentage-based). This is a vital component for structured trading, allowing traders to pre-define their risk and reward for each trade.
• Visual Clarity and Actionable Information: Instead of requiring traders to layer multiple indicators manually, "OptionHawk" integrates them into a single, cohesive display with intuitive bar coloring, shape plots, and informative labels. This reduces cognitive load and presents actionable information directly on the chart.
In essence, "OptionHawk" provides a more comprehensive, adaptive, and actionable trading framework than relying on isolated indicators.
________________________________________
3. How Do the Components Work Together?
The various components of "OptionHawk" interact in a synergistic and often sequential manner to generate signals and manage trades:
• Keltner-Supertrend as the Primary Signal Generator: The supertrend function, enhanced by keltner_channel, is the core of the system. It identifies potential trend reversals and continuation signals (bullish/bearish crosses of the supertrendLine). The sensitivity and factor inputs directly influence how closely the Supertrend follows price and its responsiveness to volatility.
• Multi-EMA "Energy" Ribbon for Momentum and Confirmation: The 15 EMAs (from ema1 to ema15) are plotted to provide a visual representation of short-term momentum. When the price is above these EMAs and they are spread out and pointing upwards, it suggests strong bullish "energy." Conversely, when price is below them and they are pointing downwards, it indicates bearish "energy." This ribbon serves as a simultaneous visual confirmation for the Supertrend signals; a buy signal from Supertrend is stronger if the EMA ribbon is also indicating upward momentum.
• Dynamic Trend Lines for Context and Confirmation: The sma_high and sma_low lines, incorporating ATR, act as dynamic support and resistance. The trend variable, determined by price crossing these lines, provides an overarching directional bias. This component works conditionally with the Supertrend; a bullish Supertrend signal is more potent if the price is also above the sma_high (indicating an uptrend).
• 100-Period Trend Filter EMA for Macro Trend Confirmation: The ema100 acts as a macro trend filter. Supertrend signals are typically considered valid if they align with the direction of the ema100. For example, a "BUY" signal from the Keltner-Supertrend is ideally taken only if the price is also above the ema100, signifying that the smaller trend aligns with the larger trend. This is a conditional filter.
• Trade Confirmation and SL/TP Logic (Sequential and Conditional):
• Once a bull or bear signal is generated by the Keltner-Supertrend, the tradeSignalCall or tradeSignalPut is set to true.
• A confirmation step then occurs for a "BUY" signal, the script checks if the close of the next bar is higher than the entry bar's close. For a "SELL" signal, it checks if the close of the next bar is lower. This is a sequential confirmation step aimed at filtering out weak signals.
• Upon a confirmed signal, the stop-loss (SL) is immediately set based on the previous bar's low (for calls) or high (for puts).
• Multiple take-profit (TP) levels are calculated and stored in arrays. These can be based on a fixed percentage or dynamic ATR multiples, based on user input.
• The TP HIT logic continuously monitors price action simultaneously against these pre-defined target levels, displaying labels when a target is reached. The SL HIT logic similarly monitors for a stop-loss breach.
In summary, the Supertrend generates the initial signal, which is then confirmed by the dynamic trend lines and the 100-period EMA, and visually reinforced by the EMA "Energy" ribbon. The trade management logic then takes over, calculating and displaying vital risk-reward parameters.
________________________________________
4. What is the Purpose of the Mashup Beyond Simply Merging Code?
The purpose of "OptionHawk" extends far beyond merely combining different indicator codes; it's about creating a structured and informed decision-making process for options trading. The key strategic insights and functionalities added by combining these elements are:
• Enhanced Signal Reliability and Reduced Noise: By requiring multiple indicators to align (e.g., Keltner-Supertrend signal confirmed by EMA trend filter and dynamic trend lines), the script aims to filter out false signals and whipsaws that commonly plague individual indicators. This leads to higher-probability trade setups.
• Adaptive Risk Management: The integration of ATR into both the Supertrend calculation and the dynamic stop-loss/take-profit levels makes the entire system adaptive to current market volatility. This means stop-losses and targets are not static but expand or contract with the market's price swings, promoting more realistic risk management.
• Clear Trade Entry and Exit Framework: The script provides a complete trading plan with each signal: a clear entry point, a precise stop-loss, and multiple cascading take-profit levels. This holistic approach empowers traders to manage their trades effectively from initiation to conclusion, rather than just identifying a potential entry.
• Visual Confirmation of Market Strength: The "Energy" ribbon and dynamic trend lines provide an immediate visual understanding of the market's momentum and underlying trend strength, helping traders gauge conviction behind a signal.
• Improved Backtesting and Analysis: By combining these elements into one script, traders can more easily backtest a comprehensive strategy rather than trying to manually combine signals from multiple overlaying indicators, leading to more accurate strategy analysis.
• Suitability for Options Trading: Options contracts are highly sensitive to price movement and volatility. This script's focus on confirmed trend identification, dynamic volatility adaptation, and precise risk management makes it particularly well-suited for the nuanced demands of options trading, where timing and defined risk are paramount.
________________________________________
5. What New Functionality or Insight Does Your Script Offer?
"OptionHawk" offers several new functionalities and insights that significantly enhance decision-making, improve accuracy, and provide clearer signals and better timing for traders:
• "Smart" Supertrend: By basing the Supertrend's volatility component on the Keltner Channel's range instead of a simple ATR, the Supertrend becomes more sensitive to price action within its typical bounds while still adapting to broader market volatility. This can lead to earlier and more relevant trend change signals.
• Multi-Confirmation System: The script doesn't just provide a signal; it layers multiple confirmations (Keltner-Supertrend, multi-EMA "Energy" coloration, dynamic trend lines, and the 100-period EMA). This multi-layered validation significantly improves the accuracy of signals by reducing the likelihood of false positives.
• Automated and Dynamic Risk-Reward Display: This is a major functionality enhancement. The automatic calculation and clear display of stop-loss and five distinct take-profit levels (based on either ATR or percentage) directly on the chart, along with "TP HIT" and "SL HIT" labels, streamline the trading process. Traders no longer need to manually calculate these crucial levels, leading to enhanced decision-making and better risk management.
• Visual Trend "Energy" and Momentum: The vibrant coloring of the multi-EMA ribbon based on price relative to the EMA provides an intuitive and immediate visual cue for market momentum and "energy." This offers an insight into the strength of the current move, which isn't available from single EMA plots.
• Post-Signal Confirmation: The "Confirmation" label appearing on the bar after a signal, if the price continues in the signaled direction, adds an extra layer of real-time validation. This helps to improve signal timing by waiting for initial follow-through.
• Streamlined Options Trading Planning: For options traders, having clear entry prices, stop-losses, and multiple target levels directly annotated on the chart is invaluable. It helps in quickly assessing potential premium movements and managing positions effectively.
In essence, "OptionHawk" transitions from a collection of indicators to a semi-automated trading assistant, providing a comprehensive, visually rich, and dynamically adaptive framework for making more informed and disciplined trading decisions.
----------------------------------------------------------------------------------------------------------------
Performance & Claims
1. What is the claimed performance of the script or strategy?
Answer: The script does not claim any specific performance metrics (e.g., win rate, profit factor, percentage gains). It's an indicator designed to identify potential buy/sell signals and target/stop-loss levels. The labels it generates ("BUY CALL," "BUY PUT," "TP HIT," "SL HIT") are informational based on its internal logic, not a representation of actual trading outcomes.
2. Is there any proof or backtesting to support this claim?
Answer: No, the provided code does not include any backtesting functionality or historical performance proof. As an indicator, it simply overlays visual signals on the chart. To obtain backtesting results, the logic would need to be implemented as a Pine Script strategy with entry/exit rules and commission/slippage considerations.
3. Are there any unrealistic or exaggerated performance expectations being made?
Answer: The script itself does not make any performance expectations. It avoids quantitative claims. However, if this script were presented to users with implied promises of profit based solely on the visual signals, that would be unrealistic.
4. Have you clearly stated the limitations of the performance data (e.g., “based on backtesting only”)?
Answer: There is no statement of performance data or its limitations because the script doesn't generate performance data.
5. Do you include a disclaimer that past results do not guarantee future performance?
Answer: No, the script does not include any disclaimers about past or future performance. This is typically found in accompanying documentation or marketing materials for a trading system, not within the indicator's code itself.
________________________________________
Evidence & Transparency
6. How are your performance results measured (e.g., profit factor, win rate, Sharpe ratio)?
Answer: Performance results are not measured by this script. It's an indicator.
7. Are these results reproducible by others using the same script and settings?
Answer: The visual signals and calculated levels (Supertrend line, EMAs, target/SL levels) generated by the script are reproducible on TradingView when applied to the same instrument, timeframe, and with the same input settings. However, the actual trading results (profit/loss) are not generated or reproducible by this indicator.
8. Do you include enough data (charts, equity curves, trade logs) to support your claims?
Answer: No, the script does not include or generate equity curves or trade logs. It provides visual labels on the chart, which can be seen as a form of "data" to support the signal generation, but not the performance claims (as none are made by the code).
________________________________________
Future Expectations
9. Are you making any predictions about future market performance?
Answer: No, the script does not make any explicit predictions about future market performance. Its signals are based on historical price action and indicator calculations.
10. Have you stated clearly that the future is fundamentally uncertain?
Answer: No, the script does not contain any statements about the uncertainty of the future.
11. Are forward-looking statements presented with caution and appropriate language?
Answer: The script does not contain any forward-looking statements beyond the visual signals it generates based on real-time data.
________________________________________
Risk & Disclosure
12. Have you disclosed the risks associated with using your script or strategy?
Answer: No, the script does not include any risk disclosures. This is typically found in external documentation.
13. Do you explain that trading involves potential loss as well as gain?
Answer: No, the script does not contain any explanation about the potential for loss in trading.
________________________________________
Honesty & Integrity
14. Have you avoided hype words like “guaranteed,” “foolproof,” or “no losses”?
Answer: Yes, the script itself avoids these hype words. The language used within the code is technical and describes the indicator's logic.
15. Is your language grounded and realistic rather than promotional?
Answer: Yes, the language within the provided Pine Script code is grounded and realistic as it pertains to the technical implementation of an indicator.
16. Are you leaving out any important details that might mislead users (e.g., selective performance snapshots)?
Answer: From the perspective of the code itself, no, it's not "leaving out" performance details because it's not designed to generate them. However, if this indicator were to be presented as a "strategy" that implies profitability without accompanying disclaimers, backtesting results, and risk disclosures, then that external presentation could be misleading. The script focuses on signal generation and visual representation.
⚠️ Disclaimer:
This indicator is for informational and educational purposes only. It does not guarantee any future results or performance. All trading involves risk. Please assess your own risk tolerance and consult a licensed financial advisor if needed. Past performance does not indicate future returns.

Profit Guard ProProfitGuard Pro
ProfitGuard Pro is a risk management and profit calculation tool that helps traders optimize their trades by handling position sizing, risk management, leverage, and take profit calculations. With support for both cumulative and non-cumulative take profit strategies, this versatile indicator provides the insights you need to maximize your trading strategy.
How to Use ProfitGuard Pro:
Load the Indicator: Add ProfitGuard Pro to your chart in TradingView.
Set Your Entry Position: Input your desired entry price.
Define Your Stop Loss: Enter the price at which your trade will exit to minimize losses.
Add Take Profit Levels: Input your TP1, TP2, TP3, and TP4 levels, as needed.
If you want fewer take profit levels, adjust the number of TPs in the settings menu. You can choose between 1 to 4 take profit levels based on your strategy.
Adjust Risk Settings: Specify your account size and risk percentage to calculate position size and leverage.
Choose Cumulative or Non-Cumulative Mode: Toggle cumulative profit mode to either recalculate position sizes as each take profit is hit or keep position sizes static for each TP.
Once set up, ProfitGuard Pro will automatically calculate your position size, leverage, and potential profits for each take profit level, providing a clear visual on your chart to guide your trading decisions.
Key Features:
Risk Management:
Calculate your risk percentage based on account size and stop loss.
Visualize risk in dollar terms and percentage of your account.
Position Size & Leverage:
Automatically calculate the ideal position size and leverage for your trade based on your entry, stop loss, and risk settings.
Ensure you are trading with the appropriate leverage for your account size.
Cumulative vs Non-Cumulative Profit Mode:
Cumulative Mode: Adjusts position size after each take profit is reached, recalculating for remaining contracts.
Non-Cumulative Mode: Treats each take profit as a separate calculation using the full position size.
Take Profit Levels:
Set up to 4 customizable take profit levels.
Adjust percentage values for each TP target, and visualize them on your chart with easy-to-read lines.
Profit Calculation:
Displays potential profits for each take profit level based on whether cumulative or non-cumulative mode is selected.
Calculate your risk-reward ratio dynamically at each TP.
Customizable Visuals:
Easily customize the table's size, position, and color scheme to fit your chart.
Visualize key trade details like leverage, contracts, margin, and profits directly on your chart.
Short and Long Position Support:
Automatically adjusts calculations based on whether you're trading long or short.

Dskyz (DAFE) Aurora Divergence – Quant Master Dskyz (DAFE) Aurora Divergence – Quant Master
Introducing the Dskyz (DAFE) Aurora Divergence – Quant Master , a strategy that’s your secret weapon for mastering futures markets like MNQ, NQ, MES, and ES. Born from the legendary Aurora Divergence indicator, this fully automated system transforms raw divergence signals into a quant-grade trading machine, blending precision, risk management, and cyberpunk DAFE visuals that make your charts glow like a neon skyline. Crafted with care and driven by community passion, this strategy stands out in a sea of generic scripts, offering traders a unique edge to outsmart institutional traps and navigate volatile markets.
The Aurora Divergence indicator was a cult favorite for spotting price-OBV divergences with its aqua and fuchsia orbs, but traders craved a system to act on those signals with discipline and automation. This strategy delivers, layering advanced filters (z-score, ATR, multi-timeframe, session), dynamic risk controls (kill switches, adaptive stops/TPs), and a real-time dashboard to turn insights into profits. Whether you’re a newbie dipping into futures or a pro hunting reversals, this strat’s got your back with a beginner guide, alerts, and visuals that make trading feel like a sci-fi mission. Let’s dive into every detail and see why this original DAFE creation is a must-have.
Why Traders Need This Strategy
Futures markets are a battlefield—fast-paced, volatile, and riddled with institutional games that can wipe out undisciplined traders. From the April 28, 2025 NQ 1k-point drop to sneaky ES slippage, the stakes are high. Meanwhile, platforms are flooded with unoriginal, low-effort scripts that promise the moon but deliver noise. The Aurora Divergence – Quant Master rises above, offering:
Unmatched Originality: A bespoke system built from the ground up, with custom divergence logic, DAFE visuals, and quant filters that set it apart from copycat clutter.
Automation with Precision: Executes trades on divergence signals, eliminating emotional slip-ups and ensuring consistency, even in chaotic sessions.
Quant-Grade Filters: Z-score, ATR, multi-timeframe, and session checks filter out noise, targeting high-probability reversals.
Robust Risk Management: Daily loss and rolling drawdown kill switches, plus ATR-based stops/TPs, protect your capital like a fortress.
Stunning DAFE Visuals: Aqua/fuchsia orbs, aurora bands, and a glowing dashboard make signals intuitive and charts a work of art.
Community-Driven: Evolved from trader feedback, this strat’s a labor of love, not a recycled knockoff.
Traders need this because it’s a complete, original system that blends accessibility, sophistication, and style. It’s your edge to trade smarter, not harder, in a market full of traps and imitators.
1. Divergence Detection (Core Signal Logic)
The strategy’s core is its ability to detect bullish and bearish divergences between price and On-Balance Volume (OBV), pinpointing reversals with surgical accuracy.
How It Works:
Price Slope: Uses linear regression over a lookback (default: 9 bars) to measure price momentum (priceSlope).
OBV Slope: OBV tracks volume flow (+volume if price rises, -volume if falls), with its slope calculated similarly (obvSlope).
Bullish Divergence: Price slope negative (falling), OBV slope positive (rising), and price above 50-bar SMA (trend_ma).
Bearish Divergence: Price slope positive (rising), OBV slope negative (falling), and price below 50-bar SMA.
Smoothing: Requires two consecutive divergence bars (bullDiv2, bearDiv2) to confirm signals, reducing false positives.
Strength: Divergence intensity (divStrength = |priceSlope * obvSlope| * sensitivity) is normalized (0–1, divStrengthNorm) for visuals.
Why It’s Brilliant:
- Divergences catch hidden momentum shifts, often exploited by institutions, giving you an edge on reversals.
- The 50-bar SMA filter aligns signals with the broader trend, avoiding choppy markets.
- Adjustable lookback (min: 3) and sensitivity (default: 1.0) let you tune for different instruments or timeframes.
2. Filters for Precision
Four advanced filters ensure signals are high-probability and market-aligned, cutting through the noise of volatile futures.
Z-Score Filter:
Logic: Calculates z-score ((close - SMA) / stdev) over a lookback (default: 50 bars). Blocks entries if |z-score| > threshold (default: 1.5) unless disabled (useZFilter = false).
Impact: Avoids trades during extreme price moves (e.g., blow-off tops), keeping you in statistically safe zones.
ATR Percentile Volatility Filter:
Logic: Tracks 14-bar ATR in a 100-bar window (default). Requires current ATR > 80th percentile (percATR) to trade (tradeOk).
Impact: Ensures sufficient volatility for meaningful moves, filtering out low-volume chop.
Multi-Timeframe (HTF) Trend Filter:
Logic: Uses a 50-bar SMA on a higher timeframe (default: 60min). Longs require price > HTF MA (bullTrendOK), shorts < HTF MA (bearTrendOK).
Impact: Aligns trades with the bigger trend, reducing counter-trend losses.
US Session Filter:
Logic: Restricts trading to 9:30am–4:00pm ET (default: enabled, useSession = true) using America/New_York timezone.
Impact: Focuses on high-liquidity hours, avoiding overnight spreads and erratic moves.
Evolution:
- These filters create a robust signal pipeline, ensuring trades are timed for optimal conditions.
- Customizable inputs (e.g., zThreshold, atrPercentile) let traders adapt to their style without compromising quality.
3. Risk Management
The strategy’s risk controls are a masterclass in balancing aggression and safety, protecting capital in volatile markets.
Daily Loss Kill Switch:
Logic: Tracks daily loss (dayStartEquity - strategy.equity). Halts trading if loss ≥ $300 (default) and enabled (killSwitch = true, killSwitchActive).
Impact: Caps daily downside, crucial during events like April 27, 2025 ES slippage.
Rolling Drawdown Kill Switch:
Logic: Monitors drawdown (rollingPeak - strategy.equity) over 100 bars (default). Stops trading if > $1000 (rollingKill).
Impact: Prevents prolonged losing streaks, preserving capital for better setups.
Dynamic Stop-Loss and Take-Profit:
Logic: Stops = entry ± ATR * multiplier (default: 1.0x, stopDist). TPs = entry ± ATR * 1.5x (profitDist). Longs: stop below, TP above; shorts: vice versa.
Impact: Adapts to volatility, keeping stops tight but realistic, with TPs targeting 1.5:1 reward/risk.
Max Bars in Trade:
Logic: Closes trades after 8 bars (default) if not already exited.
Impact: Frees capital from stagnant trades, maintaining efficiency.
Kill Switch Buffer Dashboard:
Logic: Shows smallest buffer ($300 - daily loss or $1000 - rolling DD). Displays 0 (red) if kill switch active, else buffer (green).
Impact: Real-time risk visibility, letting traders adjust dynamically.
Why It’s Brilliant:
- Kill switches and ATR-based exits create a safety net, rare in generic scripts.
- Customizable risk inputs (maxDailyLoss, dynamicStopMult) suit different account sizes.
- Buffer metric empowers disciplined trading, a DAFE signature.
4. Trade Entry and Exit Logic
The entry/exit rules are precise, filtered, and adaptive, ensuring trades are deliberate and profitable.
Entry Conditions:
Long Entry: bullDiv2, cooldown passed (canSignal), ATR filter passed (tradeOk), in US session (inSession), no kill switches (not killSwitchActive, not rollingKill), z-score OK (zOk), HTF trend bullish (bullTrendOK), no existing long (lastDirection != 1, position_size <= 0). Closes shorts first.
Short Entry: Same, but for bearDiv2, bearTrendOK, no long (lastDirection != -1, position_size >= 0). Closes longs first.
Adaptive Cooldown: Default 2 bars (cooldownBars). Doubles (up to 10) after a losing trade, resets after wins (dynamicCooldown).
Exit Conditions:
Stop-Loss/Take-Profit: Set per trade (ATR-based). Exits on stop/TP hits.
Other Exits: Closes if maxBarsInTrade reached, ATR filter fails, or kill switch activates.
Position Management: Ensures no conflicting positions, closing opposites before new entries.
Built To Be Reliable and Consistent:
- Multi-filtered entries minimize false signals, a stark contrast to basic scripts.
- Adaptive cooldown prevents overtrading, especially after losses.
- Clean position handling ensures smooth execution, even in fast markets.
5. DAFE Visuals
The visuals are a DAFE hallmark, blending function with clean flair to make signals intuitive and charts stunning.
Aurora Bands:
Display: Bands around price during divergences (bullish: below low, bearish: above high), sized by ATR * bandwidth (default: 0.5).
Colors: Aqua (bullish), fuchsia (bearish), with transparency tied to divStrengthNorm.
Purpose: Highlights divergence zones with a glowing, futuristic vibe.
Divergence Orbs:
Display: Large/small circles (aqua below for bullish, fuchsia above for bearish) when bullDiv2/bearDiv2 and canSignal. Labels show strength (0–1).
Purpose: Pinpoints entries with eye-catching clarity.
Gradient Background:
Display: Green (bullish), red (bearish), or gray (neutral), 90–95% transparent.
Purpose: Sets the market mood without clutter.
Strategy Plots:
- Stop/TP Lines: Red (stops), green (TPs) for active trades.
- HTF MA: Yellow line for trend context.
- Z-Score: Blue step-line (if enabled).
- Kill Switch Warning: Red background flash when active.
What Makes This Next-Level?:
- Visuals make complex signals (divergences, filters) instantly clear, even for beginners.
- DAFE’s unique aesthetic (orbs, bands) sets it apart from generic scripts, reinforcing originality.
- Functional plots (stops, TPs) enhance trade management.
6. Metrics Dashboard
The top-right dashboard (2x8 table) is your command center, delivering real-time insights.
Metrics:
Daily Loss ($): Current loss vs. day’s start, red if > $300.
Rolling DD ($): Drawdown vs. 100-bar peak, red if > $1000.
ATR Threshold: Current percATR, green if ATR exceeds, red if not.
Z-Score: Current value, green if within threshold, red if not.
Signal: “Bullish Div” (aqua), “Bearish Div” (fuchsia), or “None” (gray).
Action: “Consider Buying”/“Consider Selling” (signal color) or “Wait” (gray).
Kill Switch Buffer ($): Smallest buffer to kill switch, green if > 0, red if 0.
Why This Is Important?:
- Consolidates critical data, making decisions effortless.
- Color-coded metrics guide beginners (e.g., green action = go).
- Buffer metric adds transparency, rare in off-the-shelf scripts.
7. Beginner Guide
Beginner Guide: Middle-right table (shown once on chart load), explains aqua orbs (bullish, buy) and fuchsia orbs (bearish, sell).
Key Features:
Futures-Optimized: Tailored for MNQ, NQ, MES, ES with point-value adjustments.
Highly Customizable: Inputs for lookback, sensitivity, filters, and risk settings.
Real-Time Insights: Dashboard and visuals update every bar.
Backtest-Ready: Fixed qty and tick calc for accurate historical testing.
User-Friendly: Guide, visuals, and dashboard make it accessible yet powerful.
Original Design: DAFE’s unique logic and visuals stand out from generic scripts.
How to Use
Add to Chart: Load on a 5min MNQ/ES chart in TradingView.
Configure Inputs: Adjust instrument, filters, or risk (defaults optimized for MNQ).
Monitor Dashboard: Watch signals, actions, and risk metrics (top-right).
Backtest: Run in strategy tester to evaluate performance.
Live Trade: Connect to a broker (e.g., Tradovate) for automation. Watch for slippage (e.g., April 27, 2025 ES issues).
Replay Test: Use bar replay (e.g., April 28, 2025 NQ drop) to test volatility handling.
Disclaimer
Trading futures involves significant risk of loss and is not suitable for all investors. Past performance is not indicative of future results. Backtest results may not reflect live trading due to slippage, fees, or market conditions. Use this strategy at your own risk, and consult a financial advisor before trading. Dskyz (DAFE) Trading Systems is not responsible for any losses incurred.
Backtesting:
Frame: 2023-09-20 - 2025-04-29
Fee Typical Range (per side, per contract)
CME Exchange $1.14 – $1.20
Clearing $0.10 – $0.30
NFA Regulatory $0.02
Firm/Broker Commis. $0.25 – $0.80 (retail prop)
TOTAL $1.60 – $2.30 per side
Round Turn: (enter+exit) = $3.20 – $4.60 per contract
Final Notes
The Dskyz (DAFE) Aurora Divergence – Quant Master isn’t just a strategy—it’s a movement. Crafted with originality and driven by community passion, it rises above the flood of generic scripts to deliver a system that’s as powerful as it is beautiful. With its quant-grade logic, DAFE visuals, and robust risk controls, it empowers traders to tackle futures with confidence and style. Join the DAFE crew, light up your charts, and let’s outsmart the markets together!
(This publishing will most likely be taken down do to some miscellaneous rule about properly displaying charting symbols, or whatever. Once I've identified what part of the publishing they want to pick on, I'll adjust and repost.)
Use it with discipline. Use it with clarity. Trade smarter.
**I will continue to release incredible strategies and indicators until I turn this into a brand or until someone offers me a contract.
Created by Dskyz, powered by DAFE Trading Systems. Trade fast, trade bold.

FVG Visual Trading ToolHow to Use the FVG Tool
1. Identify the FVG Zone
Bullish FVG: Look for green boxes that represent potential support zones. These are areas where price is likely to retrace before continuing upward.
Bearish FVG: Look for red boxes that represent potential resistance zones. These are areas where price is likely to retrace before continuing downward.
2. Set Up Your Trade
Entry: Place a limit order at the retracement zone (inside the FVG box). This ensures you enter the trade when the price retraces into the imbalance.
Stop-Loss (SL): Place your stop-loss just below the FVG box for bullish trades or just above the FVG box for bearish trades. The tool provides a suggested SL level.
Take-Profit (TP): Set your take-profit level at a 2:1 risk-reward ratio (or higher). The tool provides a suggested target level.
3. Let the Trade Run
Once your trade is set up, let it play out. Avoid micromanaging the trade unless market conditions change drastically.
Step-by-Step Example
Bullish FVG Trade
Identify the FVG:
A green box appears, indicating a bullish FVG.
The tool provides the target price (e.g., 0.6371) and the stop-loss level (e.g., 0.6339).
Set Up the Trade:
Place a limit buy order at the retracement zone (inside the green box).
Set your stop-loss just below the FVG box (e.g., 0.6339).
Set your take-profit at a 2:1 risk-reward ratio or the suggested target (e.g., 0.6371).
Monitor the Trade:
Wait for the price to retrace into the FVG zone and trigger your limit order.
Let the trade run until it hits the take-profit or stop-loss.
Bearish FVG Trade
Identify the FVG:
A red box appears, indicating a bearish FVG.
The tool provides the target price and the stop-loss level.
Set Up the Trade:
Place a limit sell order at the retracement zone (inside the red box).
Set your stop-loss just above the FVG box.
Set your take-profit at a 2:1 risk-reward ratio or the suggested target.
Monitor the Trade:
Wait for the price to retrace into the FVG zone and trigger your limit order.
Let the trade run until it hits the take-profit or stop-loss.
Key Features of the Tool in Action
Visual Clarity:
The green and red boxes clearly show the FVG zones, making it easy to identify potential trade setups.
Labels provide the target price and stop-loss level for quick decision-making.
Risk-Reward Management:
The tool encourages disciplined trading by providing predefined SL and TP levels.
A 2:1 risk-reward ratio ensures that profitable trades outweigh losses.
Hands-Off Execution:
By placing limit orders, you can let the trade execute automatically without needing to monitor the market constantly.
Best Practices
Trade in the Direction of the Trend:
Use higher timeframes (e.g., 4-hour or daily) to identify the overall trend.
Focus on bullish FVGs in an uptrend and bearish FVGs in a downtrend.
Combine with Confirmation Signals:
Look for additional confirmation, such as candlestick patterns (e.g., engulfing candles) or indicator signals (e.g., RSI, MACD).
Adjust Parameters for Volatility:
For highly volatile markets, consider increasing the stop-loss percentage to avoid being stopped out prematurely.
Avoid Overtrading:
Not every FVG is a good trading opportunity. Be selective and only trade setups that align with your strategy.
Backtest and Optimize:
Use historical data to test the tool and refine your approach before trading live.
Common Mistakes to Avoid
Entering Without Confirmation:
Wait for price to retrace into the FVG zone before entering a trade.
Avoid chasing trades that have already moved away from the zone.
Ignoring Risk Management:
Always use a stop-loss to protect your account.
Stick to a consistent risk-reward ratio.
Trading Against the Trend:
Avoid taking trades that go against the prevailing market trend unless there is strong evidence of a reversal.
Final Thoughts
The FVG Visual Trading Tool is a powerful aid for identifying high-probability trade setups. By following the steps outlined above, you can use the tool to trade with confidence and discipline. Remember, no tool guarantees success, so always combine it with sound trading principles and proper risk management

Pivot Points [SMRT Algo]Pivot Points is a free, innovative indicator designed to automatically detect and highlight key turning points on your TradingView charts through advanced candlestick pattern analysis. This indicator is perfect for traders seeking clear visual signals for potential trend reversals.
How It Works:
Candlestick Pattern Analysis: The indicator continuously scans for specific candlestick formations. It identifies a potential high pivot when a bullish candle (where the close is higher than the open) is immediately followed by a bearish candle (where the close is lower than the open). Conversely, a potential low pivot is detected when a bearish candle is followed by a bullish candle.
Boxing the Price Range: Once a potential pivot is identified, the algorithm draws a box around the corresponding price range. This box captures the area where the price action is concentrated, serving as a zone of interest for the pivot.
Confirmation of Major Pivots: The initial detection marks what we call a "minor pivot" with a temporary yellow box. The indicator then waits for subsequent price action. If the price fails to break out of this box—meaning it remains confined within the defined boundaries—the pivot is confirmed as a major pivot. At this stage, the yellow box changes color to green (or red, depending on whether it’s a high or low pivot), clearly marking the confirmed turning point.
Pivot Sequence: The progression follows a clear sequence: Minor Pivot ➔ Yellow Box ➔ Major Pivot. This step-by-step visual guide helps traders quickly interpret the strength and significance of the pivot.
Inputs:
Show Labels: An input option allows you to toggle pivot labels on or off, so you can choose whether to display descriptive labels directly on your chart.
Adjustable Colors: The colors of the pivot points—including the green and red boxes—are fully customizable via the input settings. This ensures that you can tailor the visual appearance of the indicator to match your personal charting style or trading strategy.
Enhancing Entry and Exit Strategies
Entry Points: Look to enter a trade when the indicator confirms a pivot (after the box changes color). A confirmed pivot could indicate that a reversal is underway, giving you a potential entry signal.
Exit Points & Stop Losses: Use the boundaries of the pivot box to set stop losses. For example, if you’re in a long trade and the price approaches a confirmed resistance pivot, consider this a signal to tighten stops or exit, as the trend may reverse.
Confluence with Other Indicators: Combine the pivot point signals with other tools like RSI, MACD, or volume indicators. If multiple signals point to a reversal at the same pivot, it strengthens your confidence in the trade decision.
Trading Strategy Applications
Reversal Trading: Use confirmed pivot points as indicators for potential reversals. Enter trades when the price action validates the pivot point, anticipating that the market is turning.
Range Trading: When the price oscillates within a defined pivot box, you can use the top and bottom of the box as potential boundaries for a range-trading strategy.
Breakout Trading: Conversely, if the price breaks out of a pivot box, this may signal the start of a new trend. You can use this breakout as a trigger for entering a position in the direction of the breakout.
The indicator highlights potential reversal zones with clearly marked boxes and labels, making it easier to spot key turning points and manage trades effectively.
Pivot Points removes the guesswork by automatically scanning for and confirming pivot points based on rigorous candlestick analysis.
Whether you're a day trader or a swing trader, Pivot Points provides actionable insights into market dynamics, helping you to better time entries and exits.

Sunil 2 Bar Breakout StrategyDetailed Explanation of the Sunil 2 Bar Breakout Strategy
Introduction
The Sunil 2 Bar Breakout Strategy is a simple yet effective price-action-based approach designed to identify breakout opportunities in financial markets. This strategy analyzes the movement of the last three candles to detect momentum and initiates trades in the direction of the breakout. It is equipped with a built-in stop-loss mechanism to protect capital, making it suitable for traders looking for a structured and disciplined trading system.
The strategy works well across different timeframes and asset classes, including indices, stocks, forex, and cryptocurrencies. Its versatility makes it ideal for both intraday and swing trading.
Core Concept
The strategy revolves around two primary conditions: breakout identification and risk management.
Breakout Identification:
Long Trade Setup: The strategy identifies bullish breakouts when:
The current candle's closing price is higher than the previous candle's closing price.
The high of the previous candle is greater than the highs of the two candles before it.
Short Trade Setup: The strategy identifies bearish breakouts when:
The current candle's closing price is lower than the previous candle's closing price.
The low of the previous candle is lower than the lows of the two candles before it.
Risk Management:
Stop-Loss: For each trade, a stop-loss is automatically set:
For long trades, the stop-loss is set to the low of the previous candle.
For short trades, the stop-loss is set to the high of the previous candle.
This ensures that losses are minimized if the breakout fails.
Exit Logic:
The trade is closed automatically when the stop-loss is hit.
This approach maintains discipline and prevents emotional trading.
Strategy Workflow
Entry Criteria:
Long Entry: A long trade is triggered when:
The current close is greater than the previous close.
The high of the previous candle exceeds the highs of the two candles before it.
Short Entry: A short trade is triggered when:
The current close is less than the previous close.
The low of the previous candle is below the lows of the two candles before it.
Stop-Loss Placement:
For long trades, the stop-loss is set at the low of the previous candle.
For short trades, the stop-loss is set at the high of the previous candle.
Trade Management:
Trades are exited automatically if the stop-loss level is hit.
The strategy avoids re-entering trades until new breakout conditions are met.
Default Settings
Position Sizing:
The default position size is set to 1% of the account equity. This ensures proper risk management and prevents overexposure to the market.
Stop-Loss:
Stop-loss levels are automatically calculated based on the previous candle’s high or low.
Timeframes:
The strategy is versatile and works across multiple timeframes. However, it is recommended to test it on 15-minute, 1-hour, and daily charts for optimal performance.
Key Features
Automated Trade Execution:
The strategy handles both trade entry and exit automatically based on pre-defined conditions.
Built-In Risk Management:
The automatic stop-loss placement ensures losses are minimized on failed breakouts.
Works Across Markets:
The strategy is compatible with a wide range of instruments, including indices, stocks, forex, and cryptocurrencies.
Clear Signals:
Entry and exit points are straightforward and based on objective conditions, reducing ambiguity.
Versatility:
Can be used for both day trading and swing trading, depending on the chosen timeframe.
Best Practices for Using This Strategy
Backtesting:
Test the strategy on your chosen instrument and timeframe using TradingView's Strategy Tester to evaluate its performance.
Market Conditions:
The strategy performs best in trending markets or during periods of high volatility. Avoid using it in range-bound or choppy markets.
Position Sizing:
Use the default position size (1% of equity) or adjust based on your risk tolerance and account size.
Instrument Selection:
Focus on instruments with good liquidity and volatility, such as indices (e.g., NIFTY, BANKNIFTY), forex pairs, or major cryptocurrencies (e.g., Bitcoin, Ethereum).
Potential Enhancements
To make the strategy even more robust, consider adding the following optional features:
Stop-Loss Multiplier:
Allow users to customize the stop-loss distance as a multiple of the default level (e.g., 1.5x the low or high of the previous candle).
Take-Profit Levels:
Add user-defined take-profit levels, such as a fixed risk-reward ratio (e.g., 1:2).
Time Filter:
Include an option to restrict trading to specific market hours (e.g., avoid low-liquidity times).
Conclusion
The Sunil 2 Bar Breakout Strategy is an excellent tool for traders looking to capitalize on breakout opportunities while maintaining disciplined risk management. Its simplicity, combined with its effectiveness, makes it suitable for traders of all experience levels. By adhering to the clearly defined rules, traders can achieve consistent results while avoiding emotional trading decisions.
This strategy is a reliable addition to any trader’s toolbox and is designed to work seamlessly across different market conditions and instruments.

RSI Trend Following StrategyOverview
The RSI Trend Following Strategy utilizes Relative Strength Index (RSI) to enter the trade for the potential trend continuation. It uses Stochastic indicator to check is the price is not in overbought territory and the MACD to measure the current price momentum. Moreover, it uses the 200-period EMA to filter the counter trend trades with the higher probability. The strategy opens only long trades.
Unique Features
Dynamic stop-loss system: Instead of fixed stop-loss level strategy utilizes average true range (ATR) multiplied by user given number subtracted from the position entry price as a dynamic stop loss level.
Configurable Trading Periods: Users can tailor the strategy to specific market windows, adapting to different market conditions.
Two layers trade filtering system: Strategy utilizes MACD and Stochastic indicators measure the current momentum and overbought condition and use 200-period EMA to filter trades against major trend.
Trailing take profit level: After reaching the trailing profit activation level script activates the trailing of long trade using EMA. More information in methodology.
Wide opportunities for strategy optimization: Flexible strategy settings allows users to optimize the strategy entries and exits for chosen trading pair and time frame.
Methodology
The strategy opens long trade when the following price met the conditions:
RSI is above 50 level.
MACD line shall be above the signal line
Both lines of Stochastic shall be not higher than 80 (overbought territory)
Candle’s low shall be above the 200 period EMA
When long trade is executed, strategy set the stop-loss level at the price ATR multiplied by user-given value below the entry price. This level is recalculated on every next candle close, adjusting to the current market volatility.
At the same time strategy set up the trailing stop validation level. When the price crosses the level equals entry price plus ATR multiplied by user-given value script starts to trail the price with trailing EMA(by default = 20 period). If price closes below EMA long trade is closed. When the trailing starts, script prints the label “Trailing Activated”.
Strategy settings
In the inputs window user can setup the following strategy settings:
ATR Stop Loss (by default = 1.75)
ATR Trailing Profit Activation Level (by default = 2.25)
MACD Fast Length (by default = 12, period of averaging fast MACD line)
MACD Fast Length (by default = 26, period of averaging slow MACD line)
MACD Signal Smoothing (by default = 9, period of smoothing MACD signal line)
Oscillator MA Type (by default = EMA, available options: SMA, EMA)
Signal Line MA Type (by default = EMA, available options: SMA, EMA)
RSI Length (by default = 14, period for RSI calculation)
Trailing EMA Length (by default = 20, period for EMA, which shall be broken close the trade after trailing profit activation)
Justification of Methodology
This trading strategy is designed to leverage a combination of technical indicators—Relative Strength Index (RSI), Moving Average Convergence Divergence (MACD), Stochastic Oscillator, and the 200-period Exponential Moving Average (EMA)—to determine optimal entry points for long trades. Additionally, the strategy uses the Average True Range (ATR) for dynamic risk management to adapt to varying market conditions. Let's look in details for which purpose each indicator is used for and why it is used in this combination.
Relative Strength Index (RSI) is a momentum indicator used in technical analysis to measure the speed and change of price movements in a financial market. It helps traders identify whether an asset is potentially overbought (overvalued) or oversold (undervalued), which can indicate a potential reversal or continuation of the current trend.
How RSI Works? RSI tracks the strength of recent price changes. It compares the average gains and losses over a specific period (usually 14 periods) to assess the momentum of an asset. Average gain is the average of all positive price changes over the chosen period. It reflects how much the price has typically increased during upward movements. Average loss is the average of all negative price changes over the same period. It reflects how much the price has typically decreased during downward movements.
RSI calculates these average gains and losses and compares them to create a value between 0 and 100. If the RSI value is above 70, the asset is generally considered overbought, meaning it might be due for a price correction or reversal downward. Conversely, if the RSI value is below 30, the asset is considered oversold, suggesting it could be poised for an upward reversal or recovery. RSI is a useful tool for traders to determine market conditions and make informed decisions about entering or exiting trades based on the perceived strength or weakness of an asset's price movements.
This strategy uses RSI as a short-term trend approximation. If RSI crosses over 50 it means that there is a high probability of short-term trend change from downtrend to uptrend. Therefore RSI above 50 is our first trend filter to look for a long position.
The MACD (Moving Average Convergence Divergence) is a popular momentum and trend-following indicator used in technical analysis. It helps traders identify changes in the strength, direction, momentum, and duration of a trend in an asset's price.
The MACD consists of three components:
MACD Line: This is the difference between a short-term Exponential Moving Average (EMA) and a long-term EMA, typically calculated as: MACD Line = 12 period EMA − 26 period EMA
Signal Line: This is a 9-period EMA of the MACD Line, which helps to identify buy or sell signals. When the MACD Line crosses above the Signal Line, it can be a bullish signal (suggesting a buy); when it crosses below, it can be a bearish signal (suggesting a sell).
Histogram: The histogram shows the difference between the MACD Line and the Signal Line, visually representing the momentum of the trend. Positive histogram values indicate increasing bullish momentum, while negative values indicate increasing bearish momentum.
This strategy uses MACD as a second short-term trend filter. When MACD line crossed over the signal line there is a high probability that uptrend has been started. Therefore MACD line above signal line is our additional short-term trend filter. In conjunction with RSI it decreases probability of following false trend change signals.
The Stochastic Indicator is a momentum oscillator that compares a security's closing price to its price range over a specific period. It's used to identify overbought and oversold conditions. The indicator ranges from 0 to 100, with readings above 80 indicating overbought conditions and readings below 20 indicating oversold conditions.
It consists of two lines:
%K: The main line, calculated using the formula (CurrentClose−LowestLow)/(HighestHigh−LowestLow)×100 . Highest and lowest price taken for 14 periods.
%D: A smoothed moving average of %K, often used as a signal line.
This strategy uses stochastic to define the overbought conditions. The logic here is the following: we want to avoid long trades in the overbought territory, because when indicator reaches it there is a high probability that the potential move is gonna be restricted.
The 200-period EMA is a widely recognized indicator for identifying the long-term trend direction. The strategy only trades in the direction of this primary trend to increase the probability of successful trades. For instance, when the price is above the 200 EMA, only long trades are considered, aligning with the overarching trend direction.
Therefore, strategy uses combination of RSI and MACD to increase the probability that price now is in short-term uptrend, Stochastic helps to avoid the trades in the overbought (>80) territory. To increase the probability of opening long trades in the direction of a main trend and avoid local bounces we use 200 period EMA.
ATR is used to adjust the strategy risk management to the current market volatility. If volatility is low, we don’t need the large stop loss to understand the there is a high probability that we made a mistake opening the trade. User can setup the settings ATR Stop Loss and ATR Trailing Profit Activation Level to realize his own risk to reward preferences, but the unique feature of a strategy is that after reaching trailing profit activation level strategy is trying to follow the trend until it is likely to be finished instead of using fixed risk management settings. It allows sometimes to be involved in the large movements.
Backtest Results
Operating window: Date range of backtests is 2023.01.01 - 2024.08.01. It is chosen to let the strategy to close all opened positions.
Commission and Slippage: Includes a standard Binance commission of 0.1% and accounts for possible slippage over 5 ticks.
Initial capital: 10000 USDT
Percent of capital used in every trade: 30%
Maximum Single Position Loss: -3.94%
Maximum Single Profit: +15.78%
Net Profit: +1359.21 USDT (+13.59%)
Total Trades: 111 (36.04% win rate)
Profit Factor: 1.413
Maximum Accumulated Loss: 625.02 USDT (-5.85%)
Average Profit per Trade: 12.25 USDT (+0.40%)
Average Trade Duration: 40 hours
These results are obtained with realistic parameters representing trading conditions observed at major exchanges such as Binance and with realistic trading portfolio usage parameters.
How to Use
Add the script to favorites for easy access.
Apply to the desired timeframe and chart (optimal performance observed on 2h BTC/USDT).
Configure settings using the dropdown choice list in the built-in menu.
Set up alerts to automate strategy positions through web hook with the text: {{strategy.order.alert_message}}
Disclaimer:
Educational and informational tool reflecting Skyrex commitment to informed trading. Past performance does not guarantee future results. Test strategies in a simulated environment before live implementation

ChartArt-Bankniftybuying5minName: ChartArt-BankNifty Buying Strategy (5-Minute)
Timeframe: 5-Minute Candles
Asset: BankNifty (Indian Stock Market Index)
Trading Hours: 9:30 AM - 2:45 PM IST (Indian Standard Time)
This strategy is designed for BankNifty intraday traders who want to capitalize on short-term price movements within a defined trading window. It combines technical indicators like Simple Moving Averages (SMA), Relative Strength Index (RSI), and candlestick patterns to identify potential buy signals during intraday downtrends. The strategy employs specific entry, stop-loss, and target conditions to manage trades effectively and minimize risk.
Technical Indicators Used
Simple Moving Averages (SMA):
EMA7: 7-period SMA on closing price.
EMA5: 5-period SMA on closing price.
Purpose: Used to identify the intraday trend by comparing short-term moving averages. The strategy focuses on situations where the market is in a minor downtrend, indicated by EMA5 being below EMA7.
Relative Strength Index (RSI):
RSI14: 14-period RSI, a momentum oscillator that measures the speed and change of price movements.
SMA14: 14-period SMA of the RSI.
Purpose: RSI is used to identify potential reversal points. The strategy looks for situations where the RSI is below its own moving average, suggesting weakening momentum in the downtrend.
Candlestick Patterns:
Relaxed Hammer or Doji (2nd Candle): A pattern where the second candle in a 3-candle sequence shows a potential reversal signal (Hammer or Doji), indicating indecision or a potential turning point.
Bearish 1st Candle: The first candle is bearish, setting up the context for a potential reversal.
Bullish 3rd Candle: The third candle must be bullish with specific characteristics (closing near the high, surpassing the previous high), confirming the reversal.
Strategy Conditions
Time Condition:
The strategy is only active during specific hours (9:30 AM to 2:45 PM IST). This ensures that trades are only taken during the most liquid hours of the trading day, avoiding potential volatility or lack of liquidity towards market close.
Intraday Downtrend Condition:
EMA5 < EMA7: Indicates that the market is in a minor downtrend. The strategy looks for reversal opportunities within this trend.
RSI Condition:
RSI14 <= SMA14: Indicates that the current RSI value is below its 14-period SMA, suggesting potential weakening momentum, which can precede a reversal.
Candlestick Patterns:
1st Candle: Must be bearish, setting up the context for a potential reversal.
2nd Candle: Must either be a Hammer or Doji, indicating a potential reversal pattern.
3rd Candle: Must be bullish, with specific characteristics (closing near the high, breaking the previous high, etc.), confirming the reversal.
RSI Crossover Condition:
A crossover of the RSI over its SMA in the last 5 periods is also checked, adding further confirmation to the reversal signal.
Entry and Exit Rules
Entry Signal:
A buy signal is generated when all the conditions (time, intraday downtrend, bearish 1st candle, hammer/doji 2nd candle, bullish 3rd candle, and RSI condition) are met. The trade is entered at the high of the bullish third candle.
Stop Loss:
The stop loss is calculated based on the difference between the entry price and the low of the second candle. If this difference is greater than 90 points, the stop loss is placed at the midpoint of the second candle's range (average of high and low). Otherwise, it is placed at the low of the second candle.
Target 1:
The first target is set at 1.8 times the difference between the entry price and the stop loss. When this target is hit, half of the position is exited to lock in partial profits.
Target 2:
The second target is set at 3 times the difference between the entry price and the stop loss. The remaining position is exited at this point, or if the price hits the stop loss.
Originality and Usefulness
This strategy is original in its combination of multiple technical indicators and candlestick patterns to identify potential reversals in a specific intraday timeframe. By focusing on minor downtrends and utilizing a 3-candle reversal pattern, the strategy seeks to capture quick price movements with a structured approach to risk management.
Key Benefits:
High Precision: The strategy’s multi-step filtering process (time condition, trend confirmation, candlestick pattern analysis, and momentum evaluation via RSI) increases the likelihood of accurate trade signals.
Risk Management: The use of a dynamic stop-loss based on candle characteristics, combined with partial profit-taking, allows traders to lock in profits while still giving the trade room to develop further.
Structured Approach: The strategy provides a clear, rule-based system for entering and exiting trades, which can help remove emotional decision-making from the trading process.
Charts and Signals
The strategy produces signals in the form of labels on the chart:
Buy Signal: A green label is plotted below the candle that meets all entry conditions, indicating a potential buy opportunity.
Stop Loss (SL): A red dashed line is drawn at the stop-loss level with a label indicating "SL".
Target 1 (1st TG): A blue dashed line is drawn at the first target level with a label indicating "1st TG".
Target 2 (2nd TG): Another blue dashed line is drawn at the second target level with a label indicating "2nd TG".
These visual aids help traders quickly identify entry points, stop loss levels, and target levels on the chart, making the strategy easy to follow and implement.
Backtesting and Optimization
Backtesting: The strategy can be backtested on TradingView using historical data to evaluate its performance. Traders should consider testing across different market conditions to ensure the strategy's robustness.
Optimization: Parameters such as the RSI period, moving averages, and target multipliers can be optimized based on backtesting results to refine the strategy further.
Conclusion
The ChartArt-BankNifty Buying Strategy offers a well-rounded approach to intraday trading, focusing on capturing reversals in minor downtrends. With a strong emphasis on technical analysis, precise entry and exit rules, and robust risk management, this strategy provides a solid framework for traders looking to engage in intraday trading on BankNifty.

RunRox - Backtesting System (ASMC)Introducing RunRox - Backtesting System (ASMC), a specially designed backtesting system built on the robust structure of our Advanced SMC indicator. This innovative tool evaluates various Smart Money Concept (SMC) trading setups and serves as an automatic optimizer, displaying which entry and exit points have historically shown the best results. With cutting-edge technology, RunRox - Backtesting System (ASMC) provides you with effective strategies, maximizing your trading potential and taking your trading to the next level
🟠 HOW OUR BACKTESTING SYSTEM WORKS
Our backtesting system for the Advanced SMC (ASMC) indicator is meticulously designed to provide traders with a thorough analysis of their Smart Money Concept (SMC) strategies. Here’s an overview of how it works:
🔸 Advanced SMC Structure
Our ASMC indicator is built upon an enhanced SMC structure that integrates the Institutional Distribution Model (IDM), precise retracements, and five types of order blocks (CHoCH OB, IDM OB, Local OB, BOS OB, Extreme OB). These components allow for a detailed understanding of market dynamics and the identification of key trading opportunities.
🔸 Data Integration and Analysis
1. Historical Data Testing:
Our system tests various entry and exit points using historical market data.
The ASMC indicator is used to simulate trades based on predefined SMC setups, evaluating their effectiveness over a specified time period.
Traders can select different parameters such as entry points, stop-loss, and take-profit levels to see how these setups would have performed historically.
2. Entry and Exit Events:
The backtester can simulate trades based on 12 different entry events, 14 target events, and 14 stop-loss events, providing a comprehensive testing framework.
It allows for testing with multiple combinations of entry and exit strategies, ensuring a robust evaluation of trading setups.
3. Order Block Sensitivity:
The system uses the sensitivity settings from the ASMC indicator to determine the most relevant order blocks and fair value gaps (FVGs) for entry and exit points.
It distinguishes between different types of order blocks, helping traders identify strong institutional zones versus local zones.
🔸 Optimization Capabilities
1. Auto-Optimizer:
The backtester includes an auto-optimizer feature that evaluates various setups to find those with the best historical performance.
It automatically adjusts parameters to identify the most effective strategies for both trend-following and counter-trend trading.
2. Stop Loss and Take Profit Optimization:
It optimizes stop-loss and take-profit levels by testing different settings and identifying those that provided the best historical results.
This helps traders refine their risk management and maximize potential returns.
3. Trailing Stop Optimization:
The system also optimizes trailing stops, ensuring that traders can maximize their profits by adjusting their stops dynamically as the market moves.
🔸 Comprehensive Reporting
1. Performance Metrics:
The backtesting system provides detailed reports, including key performance metrics such as Net Profit, Win Rate, Profit Factor, and Max Drawdown.
These metrics help traders understand the historical performance of their strategies and make data-driven decisions.
2. Flexible Settings:
Traders can adjust initial balance, commission rates, and risk per trade settings to simulate real-world trading conditions.
The system supports testing with different leverage settings, allowing for realistic assessments even with tight stop-loss levels.
🔸 Conclusion
The RunRox Backtesting System (ASMC) is a powerful tool for traders seeking to validate and optimize their SMC strategies. By leveraging historical data and sophisticated optimization algorithms, it provides insights into the most effective setups, enhancing trading performance and decision-making.
🟠 HERE ARE THE AVAILABLE FEATURES
Historical backtesting for any setup – Select any entry point, exit point, and various stop-loss options to see the results of your setup on historical data.
Auto-optimizer for finding the best setups – The indicator displays settings that have shown the best results historically, providing valuable insights.
Auto-optimizer for counter-trend setups – Discover entry and exit points for counter-trend trading based on historical performance.
Auto-optimizer for stop-loss – The indicator shows stop-loss points that have been most effective historically.
Auto-optimizer for take-profit – The indicator identifies take-profit points that have performed well in historical trading data.
Auto-optimizer for trailing stop – The indicator presents trailing stop settings that have shown the best historical results.
And much more within our indicator, all of which we will cover in this post. Next, we will showcase the possible entry points, targets, and stop-loss options available for testing your strategies
🟠 ENTRY SETTINGS
12 Event Triggers for Trade Entry
Extr. ChoCh OB
Extr. ChoCh FVG
ChoCh
ChoCh OB
ChoCh FVG
IDM OB
IDM FVG
BoS FVG
BoS OB
BoS
Extr. BoS FVG
Extr. BoS OB
3 Trade Direction Options
Long Only: Enter long positions only
Short Only: Enter short positions only
Long and Short: Enter both long and short positions based on trend
3 Levels for Order Block/FVG Entries
Beginning: Enter the trade at the first touch of the Order Block/FVG
Middle: Enter the trade when the middle of the Order Block/FVG is reached
End: Enter the trade upon full filling of the Order Block/FVG
*Three levels work only for Order Blocks and FVG. For trade entries based on BOS or CHoCH, these settings do not apply as these parameters are not available for these types of entries
You can choose any combination of trade entries imaginable.
🟠 TARGET SETTINGS
14 Target Events, Including Fixed % and Fixed RR (Risk/Reward):
Fixed - % change in price
Fixed RR - Risk Reward per trade
Extr. ChoCh OB
Extr. ChoCh FVG
ChoCh
ChoCh OB
ChoCh FVG
IDM OB
IDM FVG
BoS FVG
BoS OB
BoS
Extr. BoS FVG
Extr. BoS OB
3 Levels of Order Block/FVG for Target
Beginning: Close the trade at the first touch of your target.
Middle: Close the trade at the midpoint of your chosen target.
End: Close the trade when your target is fully filled.
Customizable Parameters
Easily set your Fixed % and Fixed RR targets with a user-friendly input field. This field works only for the Fixed and Fixed RR entry parameters. When selecting a different entry point, this field is ignored
Choose any combination of target events to suit your trading strategy.
🟠 STOPLOSS SETTINGS
14 Possible StopLoss Events Including Entry Orderblock/FVG
Fixed - Fix the loss on the trade when the price moves by N%
Entry Block
Extr. ChoCh OB
Extr. ChoCh FVG
ChoCh
ChoCh OB
ChoCh FVG
IDM OB
IDM FVG
BoS FVG
BoS OB
BoS
Extr. BoS FVG
Extr. BoS OB
3 Levels for Order Blocks/FVG Exits
Beginning: Exit the trade at the first touch of the order block/FVG.
Middle: Exit the trade at the middle of the order block/FVG.
End: Exit the trade at the full completion of the order block/FVG.
Dedicated Field for Setting Fixed % Value
Set a fixed % value in a dedicated field for the Fixed parameter. This field works only for the Fixed parameter. When selecting other exit parameters, this field is ignored.
🟠 ADDITIONAL SETTINGS
Trailing Stop, %
Set a Trailing Stop as a percentage of your trade to potentially increase profit based on historical data.
Move SL to Breakeven, bars
Move your StopLoss to breakeven after exiting the entry zone for a specified number of bars. This can enhance your potential WinRate based on historical performance.
Skip trade if RR less than
This feature allows you to skip trades where the potential Risk-to-Reward ratio is less than the number set in this field.
🟠 EXAMPLE OF MANUAL SETUP
For example, let me show you how it works on the chart. You select entry parameters, stop loss parameters, and take profit parameters for your trades, and the strategy automatically tests this setup on historical data, allowing you to see the results of this strategy.
In the screenshot above, the parameters were as follows:
Trade Entry: CHoCH OB (Beginning)
Stop Loss: Entry Block
Take Profit: Break of BOS
The indicator will automatically test all possible trades on the chart and display the results for this setup.
🟠 AUTO OPTIMIZATION SETTINGS
In the screenshot above, you can see the optimization table displaying various entry points, exits, and stop-loss settings, along with their historical performance results and other parameters. This feature allows you to identify trading setups that have shown the best historical outcomes.
This functionality will enhance your trading approach, providing you with valuable insights based on historical data. You’ll be aware of the Smart Money Concept settings that have historically worked best for any specific chart and timeframe.
Our indicator includes various optimization options designed to help you find the most effective settings based on historical data. There are 5 optimization modes, each offering unique benefits for every trader
Trend Entry - Optimization of the best settings for trend-following trades. The strategy will enter trades only in the direction of the trend. If the trend is upward, it will look for long entry points and vice versa.
Counter Trend Entry - Finding setups against the trend. If the trend is upward, the script will search for short entry points. This is the opposite of trend entry optimization.
Stop Loss - Identifying stop-loss points that showed the best historical performance for the specific setup you have configured. This helps in finding effective exit points to minimize losses.
Take Profit - Determining targets for the configured setup based on historical performance, helping to identify potentially profitable take profit levels.
Trailing Stop - Finding optimal percentages for the trailing stop function based on historical data, which can potentially increase the profit of your trades.
Ability to set parameters for auto-optimization within a specified range. For example, if you choose FixRR TP from 1 to 10, the indicator will automatically test all possible Risk Reward Take Profit variations from 1 to 10 and display the results for each parameter individually.
Ability to set initial deposit parameters, position commissions, and risk per trade as a fixed percentage or fixed amount. Additionally, you can set the maximum leverage for a trade.
There are times when the stop loss is very close to the entry point, and adhering to the risk per trade values set in the settings may not allow for such a loss in any situation. That’s why we added the ability to set the maximum possible leverage, allowing you to test your trading strategy even with very tight stop losses.
Duplicated Smart Money Structure settings from our Advanced SMC indicator that you can adjust to match your trading style flexibly. All these settings will be taken into account during the optimization process or when manually calculating settings.
Additionally, you can test your strategy based on higher timeframe order blocks. For example, you can test a strategy on a 1-minute chart while displaying order blocks from a 15-minute timeframe. The auto-optimizer will consider all these parameters, including higher timeframe order blocks, and will enter trades based on these order blocks.
Highly flexible dashboard and results optimization settings allow you to display the tables you need and sort results by six different criteria: Profit Factor, Profit, Winrate, Max Drawdown, Wins, and Trades. This enables you to find the exact setup you desire, based on these comprehensive data points.
🟠 ALERT CUSTOMIZATION
With this indicator, you can set up buy and sell alerts based on the test results, allowing you to create a comprehensive trading strategy. This feature enables you to receive real-time signals, making it a powerful tool for implementing your trading strategies.
🟠 STRATEGY PROPERTIES
For backtesting, we used realistic initial data for entering trades, such as:
Starting balance: $1000
Commission: 0.01%
Risk per trade: 1%
To ensure realistic data, we used the above settings. We offer two methods for calculating your order size, and in our case, we used a 1% risk per trade. Here’s what it means:
Risk per trade: This is the maximum loss from your deposit if the trade goes against you. The trade volume can change depending on your stop-loss distance from the entry point. Here’s the formula we use to calculate the possible volume for a single trade:
1. quantity = percentage_risk * balance / loss_per_1_contract (incl. fee)
Then, we calculate the maximum allowed volume based on the specified maximum leverage:
2. max_quantity = maxLeverage * balance / entry_price
3. If quantity < max_quantity, meaning the leverage is less than the maximum allowed, we keep quantity. If quantity > max_quantity, we use max_quantity (the maximum allowed volume according to the set leverage).
This way, depending on the stop-loss distance, the position size can vary and be up to 100% of your deposit, but the loss in each trade will not exceed the set percentage, which in our case is 1% for this backtest. This is a standard risk calculation method based on your stop-loss distance.
🔸 Statistical Significance of Trade Data
In our strategy, you may notice there weren’t enough trades to form statistically significant data. This is inherent to the Smart Money Concept (SMC) strategy, where the focus is not on the number of trades but rather on the risk-to-reward ratio per trade. In SMC strategies, it’s crucial to avoid taking numerous uncertain setups and instead perform a comprehensive analysis of the market situation.
Therefore, our strategy results show fewer than 100 trades. It’s important to understand that this small sample size isn’t statistically significant and shouldn’t be relied upon for strategy analysis. Backtesting with a small number of trades should not be used to draw conclusions about the effectiveness of a strategy.
🔸 Versatile Use Cases
The methods of using this indicator are numerous, ranging from identifying potentially the best-performing order blocks on the chart to creating a comprehensive trading strategy based on the data provided by our indicator. We believe that every trader will find a valuable application for this tool, enhancing their entry and exit points in trades.
Disclaimer
Past performance is not indicative of future results. The results shown by this indicator do not guarantee similar outcomes in the future. Use this tool as part of a comprehensive trading strategy, considering all market conditions and risks.
How to access
For access to this indicator, please read the author’s instructions below this post

Average SL% Calculator with TP Levels by GorkiAverage Stop Loss And Take Profit Calculator For Futures Trading by Gorki
Description
The "Average SL% Calculator with TP Levels" script, is a simple tool for traders to plan the trades and check how much loss they are going to receive if they run this strategy. This script calculates the average price of up to four entry points, determines the percentage distance to the stop-loss level, and provides potential loss information based on margin and leverage. Additionally, it includes multiple take-profit levels to help traders systematically capture profits. Visual elements such as horizontal lines and labels make it easy to monitor key levels directly on the chart.
Why To Use This Indicator?
Risk Management: Automatically calculates the percentage distance to the stop-loss level, helping you to understand potential losses.
Profit Optimization: Supports up to four take-profit levels, enabling a structured approach to capturing gains.
Visual Clarity: Displays key levels and important information directly on the chart for easy monitoring.
Alerts: Generates alerts when the price crosses specified levels, ensuring you never miss critical trading signals.
How to Use the Script
Add the Script to Your Chart: Apply the script to your TradingView chart.
Set Input Values: Entry Points: Define up to four limit prices (LIMIT 1, LIMIT 2, LIMIT 3, LIMIT 4).
Stop-Loss: Set your stop-loss price (STOP LOSS).
Take Profits: Specify up to four take-profit levels (Take Profit 1, Take Profit 2, Take Profit 3, Take Profit 4).
Leverage: Input your leverage factor.
Margin: Enter the total margin amount for the trade.
View Calculations: The script will calculate the average entry price, the percentage distance to the stop-loss, and the potential loss based on margin and leverage.
Monitor Levels: Horizontal lines and labels will appear on the chart, showing entry points, stop-loss, and take-profit levels.
Set Alerts: Alerts will trigger when the price crosses your defined levels, helping you to take timely action.
Calculation Details
Average Price: Calculated as the mean of the specified limit prices.
Distance to Stop-Loss: Determined as the percentage difference between the average price and the stop-loss level.
Leveraged Distance: The stop-loss distance percentage multiplied by the leverage factor.
Potential Loss: Calculated by applying the leveraged distance percentage to the margin amount.
Take Profit Percentages: The percentage difference between the average price and each take-profit level.
This comprehensive indicator is a must-have for any trader looking to manage risks effectively while maximizing potential profits. Happy trading!

GKD-BT Multi-Ticker CC Backtest [Loxx]The Giga Kaleidoscope GKD-BT Multi-Ticker CC Backtest is a backtest module included in Loxx's "Giga Kaleidoscope Modularized Trading System."
█ Giga Kaleidoscope GKD-BT Multi-Ticker CC Backtest
This backtest allows you to test GKD-C Confirmation 1 and GKD-C Confirmation 2 indicators together without the hassle of adding additional confluence indicators. The backtest includes 1 take profit and 1 SL and various types of volatility. The backtest results on the chart are using 10% equity of 1 million total equity and $5 commission per trade.
To use this indicator:
1. Import the value "Input into NEW GKD-BT Backtest" from the GKD-C Confirmation 1 indicator into the GKD-BT Multi-Ticker CC Backtest.
2. Import the value "Input into NEW GKD-BT Backtest" from the GKD-C Confirmation 2 indicator into the GKD-BT Multi-Ticker CC Backtest.
This backtest includes the following metrics:
1. Net profit: Overall profit or loss achieved.
2. Total Closed Trades: Total number of closed trades, both winning and losing.
3. Total Percent Wins: Total wins, whether long or short, for the selected time interval regardless of commissions and other profit-modifying addons.
4. Percent Profitable: Total wins, whether long or short, that are also profitable, taking commissions into account.
5. Profit Factor: The ratio of gross profits to gross losses, indicating how much money the strategy made for every unit of money it lost.
6. Average Profit per Trade: The average gain or loss per trade, calculated by dividing the net profit by the total number of closed trades.
7. Average Number of Bars in Trade: The average number of bars that elapsed during trades for all closed trades.
Summary of notable settings:
Input Tickers separated by commas: Allows the user to input tickers separated by commas, specifying the symbols or tickers of financial instruments used in the backtest. The tickers should follow the format "EXCHANGE:TICKER" (e.g., "NASDAQ:AAPL, NYSE:MSFT").
Import GKD-B Baseline: Imports the "GKD-B Baseline" indicator.
Import GKD-V Volatility/Volume: Imports the "GKD-V Volatility/Volume" indicator.
Import GKD-C Confirmation: Imports the "GKD-C Confirmation" indicator.
Import GKD-C Continuation: Imports the "GKD-C Continuation" indicator.
Initial Capital: Represents the starting account balance for the backtest, denominated in the base currency of the trading account.
Order Size: Determines the quantity of contracts traded in each trade.
Order Type: Specifies the type of order used in the backtest, either "Contracts" or "% Equity."
Commission: Represents the commission per order or transaction cost incurred in each trade.
█ Giga Kaleidoscope Modularized Trading System
Core components of an NNFX algorithmic trading strategy
The NNFX algorithm is built on the principles of trend, momentum, and volatility. There are six core components in the NNFX trading algorithm:
1. Volatility - price volatility; e.g., Average True Range, True Range Double, Close-to-Close, etc.
2. Baseline - a moving average to identify price trend
3. Confirmation 1 - a technical indicator used to identify trends
4. Confirmation 2 - a technical indicator used to identify trends
5. Continuation - a technical indicator used to identify trends
6. Volatility/Volume - a technical indicator used to identify volatility/volume breakouts/breakdown
7. Exit - a technical indicator used to determine when a trend is exhausted
8. Metamorphosis - a technical indicator that produces a compound signal from the combination of other GKD indicators*
*(not part of the NNFX algorithm)
What is Volatility in the NNFX trading system?
In the NNFX (No Nonsense Forex) trading system, ATR (Average True Range) is typically used to measure the volatility of an asset. It is used as a part of the system to help determine the appropriate stop loss and take profit levels for a trade. ATR is calculated by taking the average of the true range values over a specified period.
True range is calculated as the maximum of the following values:
-Current high minus the current low
-Absolute value of the current high minus the previous close
-Absolute value of the current low minus the previous close
ATR is a dynamic indicator that changes with changes in volatility. As volatility increases, the value of ATR increases, and as volatility decreases, the value of ATR decreases. By using ATR in NNFX system, traders can adjust their stop loss and take profit levels according to the volatility of the asset being traded. This helps to ensure that the trade is given enough room to move, while also minimizing potential losses.
Other types of volatility include True Range Double (TRD), Close-to-Close, and Garman-Klass
What is a Baseline indicator?
The baseline is essentially a moving average, and is used to determine the overall direction of the market.
The baseline in the NNFX system is used to filter out trades that are not in line with the long-term trend of the market. The baseline is plotted on the chart along with other indicators, such as the Moving Average (MA), the Relative Strength Index (RSI), and the Average True Range (ATR).
Trades are only taken when the price is in the same direction as the baseline. For example, if the baseline is sloping upwards, only long trades are taken, and if the baseline is sloping downwards, only short trades are taken. This approach helps to ensure that trades are in line with the overall trend of the market, and reduces the risk of entering trades that are likely to fail.
By using a baseline in the NNFX system, traders can have a clear reference point for determining the overall trend of the market, and can make more informed trading decisions. The baseline helps to filter out noise and false signals, and ensures that trades are taken in the direction of the long-term trend.
What is a Confirmation indicator?
Confirmation indicators are technical indicators that are used to confirm the signals generated by primary indicators. Primary indicators are the core indicators used in the NNFX system, such as the Average True Range (ATR), the Moving Average (MA), and the Relative Strength Index (RSI).
The purpose of the confirmation indicators is to reduce false signals and improve the accuracy of the trading system. They are designed to confirm the signals generated by the primary indicators by providing additional information about the strength and direction of the trend.
Some examples of confirmation indicators that may be used in the NNFX system include the Bollinger Bands, the MACD (Moving Average Convergence Divergence), and the MACD Oscillator. These indicators can provide information about the volatility, momentum, and trend strength of the market, and can be used to confirm the signals generated by the primary indicators.
In the NNFX system, confirmation indicators are used in combination with primary indicators and other filters to create a trading system that is robust and reliable. By using multiple indicators to confirm trading signals, the system aims to reduce the risk of false signals and improve the overall profitability of the trades.
What is a Continuation indicator?
In the NNFX (No Nonsense Forex) trading system, a continuation indicator is a technical indicator that is used to confirm a current trend and predict that the trend is likely to continue in the same direction. A continuation indicator is typically used in conjunction with other indicators in the system, such as a baseline indicator, to provide a comprehensive trading strategy.
What is a Volatility/Volume indicator?
Volume indicators, such as the On Balance Volume (OBV), the Chaikin Money Flow (CMF), or the Volume Price Trend (VPT), are used to measure the amount of buying and selling activity in a market. They are based on the trading volume of the market, and can provide information about the strength of the trend. In the NNFX system, volume indicators are used to confirm trading signals generated by the Moving Average and the Relative Strength Index. Volatility indicators include Average Direction Index, Waddah Attar, and Volatility Ratio. In the NNFX trading system, volatility is a proxy for volume and vice versa.
By using volume indicators as confirmation tools, the NNFX trading system aims to reduce the risk of false signals and improve the overall profitability of trades. These indicators can provide additional information about the market that is not captured by the primary indicators, and can help traders to make more informed trading decisions. In addition, volume indicators can be used to identify potential changes in market trends and to confirm the strength of price movements.
What is an Exit indicator?
The exit indicator is used in conjunction with other indicators in the system, such as the Moving Average (MA), the Relative Strength Index (RSI), and the Average True Range (ATR), to provide a comprehensive trading strategy.
The exit indicator in the NNFX system can be any technical indicator that is deemed effective at identifying optimal exit points. Examples of exit indicators that are commonly used include the Parabolic SAR, the Average Directional Index (ADX), and the Chandelier Exit.
The purpose of the exit indicator is to identify when a trend is likely to reverse or when the market conditions have changed, signaling the need to exit a trade. By using an exit indicator, traders can manage their risk and prevent significant losses.
In the NNFX system, the exit indicator is used in conjunction with a stop loss and a take profit order to maximize profits and minimize losses. The stop loss order is used to limit the amount of loss that can be incurred if the trade goes against the trader, while the take profit order is used to lock in profits when the trade is moving in the trader's favor.
Overall, the use of an exit indicator in the NNFX trading system is an important component of a comprehensive trading strategy. It allows traders to manage their risk effectively and improve the profitability of their trades by exiting at the right time.
What is an Metamorphosis indicator?
The concept of a metamorphosis indicator involves the integration of two or more GKD indicators to generate a compound signal. This is achieved by evaluating the accuracy of each indicator and selecting the signal from the indicator with the highest accuracy. As an illustration, let's consider a scenario where we calculate the accuracy of 10 indicators and choose the signal from the indicator that demonstrates the highest accuracy.
The resulting output from the metamorphosis indicator can then be utilized in a GKD-BT backtest by occupying a slot that aligns with the purpose of the metamorphosis indicator. The slot can be a GKD-B, GKD-C, or GKD-E slot, depending on the specific requirements and objectives of the indicator. This allows for seamless integration and utilization of the compound signal within the GKD-BT framework.
How does Loxx's GKD (Giga Kaleidoscope Modularized Trading System) implement the NNFX algorithm outlined above?
Loxx's GKD v2.0 system has five types of modules (indicators/strategies). These modules are:
1. GKD-BT - Backtesting module (Volatility, Number 1 in the NNFX algorithm)
2. GKD-B - Baseline module (Baseline and Volatility/Volume, Numbers 1 and 2 in the NNFX algorithm)
3. GKD-C - Confirmation 1/2 and Continuation module (Confirmation 1/2 and Continuation, Numbers 3, 4, and 5 in the NNFX algorithm)
4. GKD-V - Volatility/Volume module (Confirmation 1/2, Number 6 in the NNFX algorithm)
5. GKD-E - Exit module (Exit, Number 7 in the NNFX algorithm)
6. GKD-M - Metamorphosis module (Metamorphosis, Number 8 in the NNFX algorithm, but not part of the NNFX algorithm)
(additional module types will added in future releases)
Each module interacts with every module by passing data to A backtest module wherein the various components of the GKD system are combined to create a trading signal.
That is, the Baseline indicator passes its data to Volatility/Volume. The Volatility/Volume indicator passes its values to the Confirmation 1 indicator. The Confirmation 1 indicator passes its values to the Confirmation 2 indicator. The Confirmation 2 indicator passes its values to the Continuation indicator. The Continuation indicator passes its values to the Exit indicator, and finally, the Exit indicator passes its values to the Backtest strategy.
This chaining of indicators requires that each module conform to Loxx's GKD protocol, therefore allowing for the testing of every possible combination of technical indicators that make up the six components of the NNFX algorithm.
What does the application of the GKD trading system look like?
Example trading system:
Backtest: Multi-Ticker CC Backtest as shown on the chart above
Baseline: Hull Moving Average
Volatility/Volume: Hurst Exponent
Confirmation 1: Fisher Transform as shown on the chart above
Confirmation 2: uf2018 as shown on the chart above
Continuation: Coppock Curve
Exit: Rex Oscillator
Metamorphosis: Baseline Optimizer
Each GKD indicator is denoted with a module identifier of either: GKD-BT, GKD-B, GKD-C, GKD-V, GKD-M, or GKD-E. This allows traders to understand to which module each indicator belongs and where each indicator fits into the GKD system.
█ Giga Kaleidoscope Modularized Trading System Signals
Standard Entry
1. GKD-C Confirmation gives signal
2. Baseline agrees
3. Price inside Goldie Locks Zone Minimum
4. Price inside Goldie Locks Zone Maximum
5. Confirmation 2 agrees
6. Volatility/Volume agrees
1-Candle Standard Entry
1a. GKD-C Confirmation gives signal
2a. Baseline agrees
3a. Price inside Goldie Locks Zone Minimum
4a. Price inside Goldie Locks Zone Maximum
Next Candle
1b. Price retraced
2b. Baseline agrees
3b. Confirmation 1 agrees
4b. Confirmation 2 agrees
5b. Volatility/Volume agrees
Baseline Entry
1. GKD-B Baseline gives signal
2. Confirmation 1 agrees
3. Price inside Goldie Locks Zone Minimum
4. Price inside Goldie Locks Zone Maximum
5. Confirmation 2 agrees
6. Volatility/Volume agrees
7. Confirmation 1 signal was less than 'Maximum Allowable PSBC Bars Back' prior
1-Candle Baseline Entry
1a. GKD-B Baseline gives signal
2a. Confirmation 1 agrees
3a. Price inside Goldie Locks Zone Minimum
4a. Price inside Goldie Locks Zone Maximum
5a. Confirmation 1 signal was less than 'Maximum Allowable PSBC Bars Back' prior
Next Candle
1b. Price retraced
2b. Baseline agrees
3b. Confirmation 1 agrees
4b. Confirmation 2 agrees
5b. Volatility/Volume agrees
Volatility/Volume Entry
1. GKD-V Volatility/Volume gives signal
2. Confirmation 1 agrees
3. Price inside Goldie Locks Zone Minimum
4. Price inside Goldie Locks Zone Maximum
5. Confirmation 2 agrees
6. Baseline agrees
7. Confirmation 1 signal was less than 7 candles prior
1-Candle Volatility/Volume Entry
1a. GKD-V Volatility/Volume gives signal
2a. Confirmation 1 agrees
3a. Price inside Goldie Locks Zone Minimum
4a. Price inside Goldie Locks Zone Maximum
5a. Confirmation 1 signal was less than 'Maximum Allowable PSVVC Bars Back' prior
Next Candle
1b. Price retraced
2b. Volatility/Volume agrees
3b. Confirmation 1 agrees
4b. Confirmation 2 agrees
5b. Baseline agrees
Confirmation 2 Entry
1. GKD-C Confirmation 2 gives signal
2. Confirmation 1 agrees
3. Price inside Goldie Locks Zone Minimum
4. Price inside Goldie Locks Zone Maximum
5. Volatility/Volume agrees
6. Baseline agrees
7. Confirmation 1 signal was less than 7 candles prior
1-Candle Confirmation 2 Entry
1a. GKD-C Confirmation 2 gives signal
2a. Confirmation 1 agrees
3a. Price inside Goldie Locks Zone Minimum
4a. Price inside Goldie Locks Zone Maximum
5a. Confirmation 1 signal was less than 'Maximum Allowable PSC2C Bars Back' prior
Next Candle
1b. Price retraced
2b. Confirmation 2 agrees
3b. Confirmation 1 agrees
4b. Volatility/Volume agrees
5b. Baseline agrees
PullBack Entry
1a. GKD-B Baseline gives signal
2a. Confirmation 1 agrees
3a. Price is beyond 1.0x Volatility of Baseline
Next Candle
1b. Price inside Goldie Locks Zone Minimum
2b. Price inside Goldie Locks Zone Maximum
3b. Confirmation 1 agrees
4b. Confirmation 2 agrees
5b. Volatility/Volume agrees
Continuation Entry
1. Standard Entry, 1-Candle Standard Entry, Baseline Entry, 1-Candle Baseline Entry, Volatility/Volume Entry, 1-Candle Volatility/Volume Entry, Confirmation 2 Entry, 1-Candle Confirmation 2 Entry, or Pullback entry triggered previously
2. Baseline hasn't crossed since entry signal trigger
4. Confirmation 1 agrees
5. Baseline agrees
6. Confirmation 2 agrees
█ Connecting to Backtests
All GKD indicators are chained indicators meaning you export the value of the indicators to specialized backtest to creat your GKD trading system. Each indicator contains a proprietary signal generation algo that will only work with GKD backtests. You can find these backtests using the links below.
GKD-BT Giga Confirmation Stack Backtest
GKD-BT Giga Stacks Backtest
GKD-BT Full Giga Kaleidoscope Backtest
GKD-BT Solo Confirmation Super Complex Backtest
GKD-BT Solo Confirmation Complex Backtest
GKD-BT Solo Confirmation Simple Backtest
GKD-M Baseline Optimizer
GKD-M Accuracy Alchemist
GKD-BT Multi-Ticker SCC Backtest
GKD-BT Multi-Ticker SCS Backtest
GKD-BT Multi-Ticker SCS Backtest
GKD-BT Multi-Ticker Full GKD Backtest
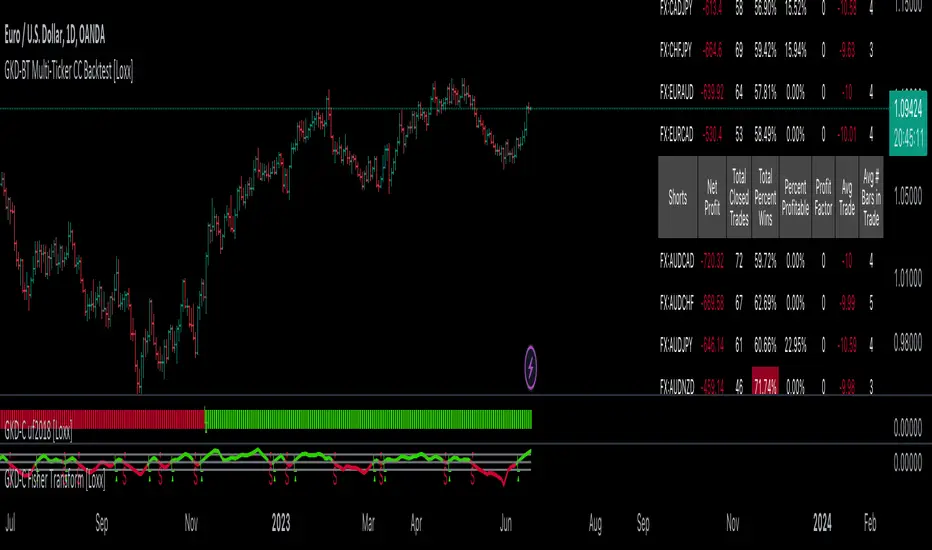
Premium Smart Exit HMA [ByteBoost]The Premium Smart Exit HMA strategy is designed for fast-paced trend detection and is well-suited for small trades in highly volatile markets. It utilizes the Hull Moving Average (HMA) as a signal to execute trades and offers customizable inputs for price calculation, period settings, and stop loss/take profit levels. The strategy aims to reduce lag associated with traditional moving averages, allowing it to catch trends quickly.
Development Notes
This Strategy was developed with the PineScript language, version 5. The aim of the strategy is to provide a trading system that catches fast trend reversals and uses a modified version of the Hull Moving Average. The HMA adeptly adapts to swift variations in price movements while offering better smoothing and utilizes a user selected moving averages, mitigating the smoothing effect and is controlled with a custom weight design.
Features
Customizable trading periods.
Customizable stop loss and take profit levels.
Adjustable date range for backtesting.
Allows setting of initial capital, commission type and value.
Provides visual aids for better understanding of the market trends.
Customize the visuals of the strategy.
Strategy Description
The Smart Exit HMA strategy offers the flexibility to use various types of moving averages, allowing customization of inputs for price calculation, period settings, and stop loss/take profit levels. The strategy relies on the Hull Moving Average (HMA) as a signal to execute trades. However, you have control over the signal frequency by selecting your preferred period value, which determines the number of candles used in the average calculation. This allows you to adapt the strategy to market tendencies and increase its effectiveness during clear trends.
The Smart Exit HMA strategy is designed to minimize lag associated with traditional moving averages, enabling it to respond more quickly to recent price movements based on your chosen period. It's worth noting that the strategy plots two lines on the graph: the average line and the square root line. Buy and sell signals are generated when both lines intersect, indicating favorable trading opportunities.
Inputs/Settings
Capital - If using any leverage multiply the amount of money to invest by the leverage, else input the amount to be invested in every trade.
Start date - The date from which the strategy should begin its analysis. Leave unchanged to start from the earliest available date based on your account's plan.
End date - The date until which the strategy should conduct its analysis. Leave unchanged to continue until the current date.
Period - The lookback period for the moving average calculation, a longer period will translate into fewer trades that last longer.
Stop loss - Allows the use of a stop loss for all trades.
Take profit - Activates the use of a take profit for all trades.
Stop loss value - The distance from the entry price at which the strategy should exit to prevent further losses.
Take profit value - The distance from the entry price at which the strategy should exit to secure profits.
Take profit % - The percentage of the capital to take as profit.
Stop loss % - The percentage of the capital to set as the maximum loss.
Candles exit - The minimum number of candles before the strategy is allowed to close a trade.
Candles change - The minimum number of candles before the strategy is allowed to change the current trend.
Moving average type - Determines the preprocessing method applied prior to utilizing the HMA.
Custom weight - Enables the utilization of a personalized weighting system for the HMA. If chosen, ensure that the sum of all weights equals 1.
Open weight - Determines the weight assigned to the candle's open value.
Close weight - Specifies the weight assigned to the candle's close value.
High weight - Sets the weight attributed to the candle's high value.
Low weight - Determines the weight assigned to the candle's low value.
Highlighter - Light coloring between the trend and average price of each bar.
Signal labels - View the labels indicating a new long or short position.
Exit labels - Displays the labels indicating exit points.
Color long - Sets the color scheme for a new long position.
Color short - Sets the color scheme for a new short position.
Color exit - Decides the color scheme for the exit tag and cross shown.
Indicator Visuals
The strategy plots the two trendlines on the chart and changes its color based on its direction. It also plots shapes on the chart to denote potential buy (Long) and sell (Short) points where the signals of short and long will appear, as well as crosses for the exit points.
Strategy Alerts
The strategy does not include built-in alerts. However, alerts can be added using the TradingView interface based on the strategy's buy, sell and exit conditions. This way you will be able to receive notifications on your computer or phone when a new signal goes out.
Details
Repainting: It is important to mention that the strategy can mark an uptrend signal during a candle and disappear at the end of it, so please just put long or short when the buy/sell conditions are followed and marked by the strategy at the end of each candle.
Conclusion
The Premium Smart Exit HMA is a versatile strategy that combines the benefits of the Hull Moving Average with adjustable parameters to suit individual trading styles. It offers a combination of speed and smoothness, which can be beneficial in volatile markets.
Disclaimer
This strategy is provided as-is, with no guarantee of profits or responsibility for losses. Trading involves risk, and you should only trade with money you can afford to lose. Always conduct your own research and consider your financial situation before engaging in trading.

GKD-M Accuracy Alchemist [Loxx]Giga Kaleidoscope GKD-M Accuracy Alchemist is a Metamorphosis module included in Loxx's "Giga Kaleidoscope Modularized Trading System".
█ GKD-M Accuracy Alchemist
What is the Accuracy Alchemist?
The Accuracy Alchemist is designed to process up to 10 GKD-C indicators and create a compound signal that can be utilized in a GKD-BT backtest. It achieves this by applying an individual Solo Confirmation Simple backtest to each GKD-C indicator provided. The compound signal is derived from the cumulative accuracy rate of each candle within a specified date range.
To illustrate this process, consider the following scenario:
The Fisher Transform indicator has a 65% win rate for long positions on the current ticker.
The Vortex indicator has a 45% success rate on the current candle.
Suppose a long signal is generated by the Vortex indicator. However, this signal is disregarded because its accuracy is lower than that of the Fisher Transform. Now, imagine that the subsequent candle produces a long signal from the Fisher Transform indicator. This signal will be exported to the backtest. The GKD-C indicator that exhibits the highest accuracy for the current candle is chosen to generate the signal. The dominant indicator, determined by its accuracy, will always be used to generate signals. However, it is important to note that the current dominant indicator might not retain its dominance in the future if its accuracy rate falls below that of other indicators connected within the Accuracy Alchemist indicator.
The Accuracy Alchemist provides a comprehensive table that displays the dominant indicator based on accuracy, highlighted in green for the highest long accuracy rate and in red for the highest short accuracy rate. Additionally, the table presents the cumulative long and short accuracy rates for all indicators.
The functionality of the Accuracy Alchemist extends to several GKD-BT backtests, allowing for seamless integration. These backtests include:
-Solo Confirmation Simple
-Solo Confirmation Complex
-Solo Confirmation Super Complex
-Full GKD (as a Confirmation 1 indicator only)
-Confirmation Stack (as a Confirmation 1 indicator only)
By incorporating the Accuracy Alchemist, you gain the ability to evaluate and compare GKD-C Confirmation indicators within your full GKD trading system. It serves as an ideal tool to assess the performance of different confirmation indicators and aids in the selection process for determining which indicators to incorporate into your trading strategy.
Take Profit and Stoploss
The GKD system utilizes volatility-based take profits and stop losses, where each take profit and stop loss is calculated as a multiple of volatility. Users have the flexibility to adjust the multiplier values in the settings to suit their preferences. Accuracy Alchemist tests the accuracy of GKD-C Confirmation indicators and therefore has only 1 take profit and 1 stoploss. You can adjust the multipliers of both in the settings
Setting up Accuracy Alchemist
To use this indicator, you must import GKD-C Confirmation indicators and then activate them in the Accuracy Alchemist settings. Import the value "Input into NEW GKD-BT Backtest" from a GKD-C indicator and then activate it by checking the box next to the import. See below:
Volatility Types Included
17 types of volatility are included in this indicator
Close-to-Close
Parkinson
Garman-Klass
Rogers-Satchell
Yang-Zhang
Garman-Klass-Yang-Zhang
Exponential Weighted Moving Average
Standard Deviation of Log Returns
Pseudo GARCH(2,2)
Average True Range
True Range Double
Standard Deviation
Adaptive Deviation
Median Absolute Deviation
Efficiency-Ratio Adaptive ATR
Mean Absolute Deviation
Static Percent
Close-to-Close
Close-to-Close volatility is a classic and widely used volatility measure, sometimes referred to as historical volatility.
Volatility is an indicator of the speed of a stock price change. A stock with high volatility is one where the price changes rapidly and with a larger amplitude. The more volatile a stock is, the riskier it is.
Close-to-close historical volatility is calculated using only a stock's closing prices. It is the simplest volatility estimator. However, in many cases, it is not precise enough. Stock prices could jump significantly during a trading session and return to the opening value at the end. That means that a considerable amount of price information is not taken into account by close-to-close volatility.
Despite its drawbacks, Close-to-Close volatility is still useful in cases where the instrument doesn't have intraday prices. For example, mutual funds calculate their net asset values daily or weekly, and thus their prices are not suitable for more sophisticated volatility estimators.
Parkinson
Parkinson volatility is a volatility measure that uses the stock’s high and low price of the day.
The main difference between regular volatility and Parkinson volatility is that the latter uses high and low prices for a day, rather than only the closing price. This is useful as close-to-close prices could show little difference while large price movements could have occurred during the day. Thus, Parkinson's volatility is considered more precise and requires less data for calculation than close-to-close volatility.
One drawback of this estimator is that it doesn't take into account price movements after the market closes. Hence, it systematically undervalues volatility. This drawback is addressed in the Garman-Klass volatility estimator.
Garman-Klass
Garman-Klass is a volatility estimator that incorporates open, low, high, and close prices of a security.
Garman-Klass volatility extends Parkinson's volatility by taking into account the opening and closing prices. As markets are most active during the opening and closing of a trading session, it makes volatility estimation more accurate.
Garman and Klass also assumed that the process of price change follows a continuous diffusion process (Geometric Brownian motion). However, this assumption has several drawbacks. The method is not robust for opening jumps in price and trend movements.
Despite its drawbacks, the Garman-Klass estimator is still more effective than the basic formula since it takes into account not only the price at the beginning and end of the time interval but also intraday price extremes.
Researchers Rogers and Satchell have proposed a more efficient method for assessing historical volatility that takes into account price trends. See Rogers-Satchell Volatility for more detail.
Rogers-Satchell
Rogers-Satchell is an estimator for measuring the volatility of securities with an average return not equal to zero.
Unlike Parkinson and Garman-Klass estimators, Rogers-Satchell incorporates a drift term (mean return not equal to zero). As a result, it provides better volatility estimation when the underlying is trending.
The main disadvantage of this method is that it does not take into account price movements between trading sessions. This leads to an underestimation of volatility since price jumps periodically occur in the market precisely at the moments between sessions.
A more comprehensive estimator that also considers the gaps between sessions was developed based on the Rogers-Satchel formula in the 2000s by Yang-Zhang. See Yang Zhang Volatility for more detail.
Yang-Zhang
Yang Zhang is a historical volatility estimator that handles both opening jumps and the drift and has a minimum estimation error.
Yang-Zhang volatility can be thought of as a combination of the overnight (close-to-open volatility) and a weighted average of the Rogers-Satchell volatility and the day’s open-to-close volatility. It is considered to be 14 times more efficient than the close-to-close estimator.
Garman-Klass-Yang-Zhang
Garman-Klass-Yang-Zhang (GKYZ) volatility estimator incorporates the returns of open, high, low, and closing prices in its calculation.
GKYZ volatility estimator takes into account overnight jumps but not the trend, i.e., it assumes that the underlying asset follows a Geometric Brownian Motion (GBM) process with zero drift. Therefore, the GKYZ volatility estimator tends to overestimate the volatility when the drift is different from zero. However, for a GBM process, this estimator is eight times more efficient than the close-to-close volatility estimator.
Exponential Weighted Moving Average
The Exponentially Weighted Moving Average (EWMA) is a quantitative or statistical measure used to model or describe a time series. The EWMA is widely used in finance, with the main applications being technical analysis and volatility modeling.
The moving average is designed such that older observations are given lower weights. The weights decrease exponentially as the data point gets older – hence the name exponentially weighted.
The only decision a user of the EWMA must make is the parameter lambda. The parameter decides how important the current observation is in the calculation of the EWMA. The higher the value of lambda, the more closely the EWMA tracks the original time series.
Standard Deviation of Log Returns
This is the simplest calculation of volatility. It's the standard deviation of ln(close/close(1)).
Pseudo GARCH(2,2)
This is calculated using a short- and long-run mean of variance multiplied by ?.
?avg(var;M) + (1 ? ?) avg(var;N) = 2?var/(M+1-(M-1)L) + 2(1-?)var/(M+1-(M-1)L)
Solving for ? can be done by minimizing the mean squared error of estimation; that is, regressing L^-1var - avg(var; N) against avg(var; M) - avg(var; N) and using the resulting beta estimate as ?.
Average True Range
The average true range (ATR) is a technical analysis indicator, introduced by market technician J. Welles Wilder Jr. in his book New Concepts in Technical Trading Systems, that measures market volatility by decomposing the entire range of an asset price for that period.
The true range indicator is taken as the greatest of the following: current high less the current low; the absolute value of the current high less the previous close; and the absolute value of the current low less the previous close. The ATR is then a moving average, generally using 14 days, of the true ranges.
True Range Double
A special case of ATR that attempts to correct for volatility skew.
Standard Deviation
Standard deviation is a statistic that measures the dispersion of a dataset relative to its mean and is calculated as the square root of the variance. The standard deviation is calculated as the square root of variance by determining each data point's deviation relative to the mean. If the data points are further from the mean, there is a higher deviation within the data set; thus, the more spread out the data, the higher the standard deviation.
Adaptive Deviation
By definition, the Standard Deviation (STD, also represented by the Greek letter sigma ? or the Latin letter s) is a measure that is used to quantify the amount of variation or dispersion of a set of data values. In technical analysis, we usually use it to measure the level of current volatility.
Standard Deviation is based on Simple Moving Average calculation for mean value. This version of standard deviation uses the properties of EMA to calculate what can be called a new type of deviation, and since it is based on EMA, we can call it EMA deviation. Additionally, Perry Kaufman's efficiency ratio is used to make it adaptive (since all EMA type calculations are nearly perfect for adapting).
The difference when compared to the standard is significant--not just because of EMA usage, but the efficiency ratio makes it a "bit more logical" in very volatile market conditions.
Median Absolute Deviation
The median absolute deviation is a measure of statistical dispersion. Moreover, the MAD is a robust statistic, being more resilient to outliers in a data set than the standard deviation. In the standard deviation, the distances from the mean are squared, so large deviations are weighted more heavily, and thus outliers can heavily influence it. In the MAD, the deviations of a small number of outliers are irrelevant.
Because the MAD is a more robust estimator of scale than the sample variance or standard deviation, it works better with distributions without a mean or variance, such as the Cauchy distribution.
Efficiency-Ratio Adaptive ATR
Average True Range (ATR) is a widely used indicator for many occasions in technical analysis. It is calculated as the RMA of the true range. This version adds a "twist": it uses Perry Kaufman's Efficiency Ratio to calculate adaptive true range.
Mean Absolute Deviation
The mean absolute deviation (MAD) is a measure of variability that indicates the average distance between observations and their mean. MAD uses the original units of the data, which simplifies interpretation. Larger values signify that the data points spread out further from the average. Conversely, lower values correspond to data points bunching closer to it. The mean absolute deviation is also known as the mean deviation and average absolute deviation.
This definition of the mean absolute deviation sounds similar to the standard deviation (SD). While both measure variability, they have different calculations. In recent years, some proponents of MAD have suggested that it replace the SD as the primary measure because it is a simpler concept that better fits real life.
Static Percent
Static Percent allows the user to insert their own constant percent that will then be used to create take profits and stoploss
█ Giga Kaleidoscope Modularized Trading System
Core components of an NNFX algorithmic trading strategy
The NNFX algorithm is built on the principles of trend, momentum, and volatility. There are six core components in the NNFX trading algorithm:
1. Volatility - price volatility; e.g., Average True Range, True Range Double, Close-to-Close, etc.
2. Baseline - a moving average to identify price trend
3. Confirmation 1 - a technical indicator used to identify trends
4. Confirmation 2 - a technical indicator used to identify trends
5. Continuation - a technical indicator used to identify trends
6. Volatility/Volume - a technical indicator used to identify volatility/volume breakouts/breakdown
7. Exit - a technical indicator used to determine when a trend is exhausted
8. Metamorphosis - a technical indicator that produces a compound signal from the combination of other GKD indicators*
*(not part of the NNFX algorithm)
What is Volatility in the NNFX trading system?
In the NNFX (No Nonsense Forex) trading system, ATR (Average True Range) is typically used to measure the volatility of an asset. It is used as a part of the system to help determine the appropriate stop loss and take profit levels for a trade. ATR is calculated by taking the average of the true range values over a specified period.
True range is calculated as the maximum of the following values:
-Current high minus the current low
-Absolute value of the current high minus the previous close
-Absolute value of the current low minus the previous close
ATR is a dynamic indicator that changes with changes in volatility. As volatility increases, the value of ATR increases, and as volatility decreases, the value of ATR decreases. By using ATR in NNFX system, traders can adjust their stop loss and take profit levels according to the volatility of the asset being traded. This helps to ensure that the trade is given enough room to move, while also minimizing potential losses.
Other types of volatility include True Range Double (TRD), Close-to-Close, and Garman-Klass
What is a Baseline indicator?
The baseline is essentially a moving average, and is used to determine the overall direction of the market.
The baseline in the NNFX system is used to filter out trades that are not in line with the long-term trend of the market. The baseline is plotted on the chart along with other indicators, such as the Moving Average (MA), the Relative Strength Index (RSI), and the Average True Range (ATR).
Trades are only taken when the price is in the same direction as the baseline. For example, if the baseline is sloping upwards, only long trades are taken, and if the baseline is sloping downwards, only short trades are taken. This approach helps to ensure that trades are in line with the overall trend of the market, and reduces the risk of entering trades that are likely to fail.
By using a baseline in the NNFX system, traders can have a clear reference point for determining the overall trend of the market, and can make more informed trading decisions. The baseline helps to filter out noise and false signals, and ensures that trades are taken in the direction of the long-term trend.
What is a Confirmation indicator?
Confirmation indicators are technical indicators that are used to confirm the signals generated by primary indicators. Primary indicators are the core indicators used in the NNFX system, such as the Average True Range (ATR), the Moving Average (MA), and the Relative Strength Index (RSI).
The purpose of the confirmation indicators is to reduce false signals and improve the accuracy of the trading system. They are designed to confirm the signals generated by the primary indicators by providing additional information about the strength and direction of the trend.
Some examples of confirmation indicators that may be used in the NNFX system include the Bollinger Bands, the MACD (Moving Average Convergence Divergence), and the MACD Oscillator. These indicators can provide information about the volatility, momentum, and trend strength of the market, and can be used to confirm the signals generated by the primary indicators.
In the NNFX system, confirmation indicators are used in combination with primary indicators and other filters to create a trading system that is robust and reliable. By using multiple indicators to confirm trading signals, the system aims to reduce the risk of false signals and improve the overall profitability of the trades.
What is a Continuation indicator?
In the NNFX (No Nonsense Forex) trading system, a continuation indicator is a technical indicator that is used to confirm a current trend and predict that the trend is likely to continue in the same direction. A continuation indicator is typically used in conjunction with other indicators in the system, such as a baseline indicator, to provide a comprehensive trading strategy.
What is a Volatility/Volume indicator?
Volume indicators, such as the On Balance Volume (OBV), the Chaikin Money Flow (CMF), or the Volume Price Trend (VPT), are used to measure the amount of buying and selling activity in a market. They are based on the trading volume of the market, and can provide information about the strength of the trend. In the NNFX system, volume indicators are used to confirm trading signals generated by the Moving Average and the Relative Strength Index. Volatility indicators include Average Direction Index, Waddah Attar, and Volatility Ratio. In the NNFX trading system, volatility is a proxy for volume and vice versa.
By using volume indicators as confirmation tools, the NNFX trading system aims to reduce the risk of false signals and improve the overall profitability of trades. These indicators can provide additional information about the market that is not captured by the primary indicators, and can help traders to make more informed trading decisions. In addition, volume indicators can be used to identify potential changes in market trends and to confirm the strength of price movements.
What is an Exit indicator?
The exit indicator is used in conjunction with other indicators in the system, such as the Moving Average (MA), the Relative Strength Index (RSI), and the Average True Range (ATR), to provide a comprehensive trading strategy.
The exit indicator in the NNFX system can be any technical indicator that is deemed effective at identifying optimal exit points. Examples of exit indicators that are commonly used include the Parabolic SAR, the Average Directional Index (ADX), and the Chandelier Exit.
The purpose of the exit indicator is to identify when a trend is likely to reverse or when the market conditions have changed, signaling the need to exit a trade. By using an exit indicator, traders can manage their risk and prevent significant losses.
In the NNFX system, the exit indicator is used in conjunction with a stop loss and a take profit order to maximize profits and minimize losses. The stop loss order is used to limit the amount of loss that can be incurred if the trade goes against the trader, while the take profit order is used to lock in profits when the trade is moving in the trader's favor.
Overall, the use of an exit indicator in the NNFX trading system is an important component of a comprehensive trading strategy. It allows traders to manage their risk effectively and improve the profitability of their trades by exiting at the right time.
What is an Metamorphosis indicator?
The concept of a metamorphosis indicator involves the integration of two or more GKD indicators to generate a compound signal. This is achieved by evaluating the accuracy of each indicator and selecting the signal from the indicator with the highest accuracy. As an illustration, let's consider a scenario where we calculate the accuracy of 10 indicators and choose the signal from the indicator that demonstrates the highest accuracy.
The resulting output from the metamorphosis indicator can then be utilized in a GKD-BT backtest by occupying a slot that aligns with the purpose of the metamorphosis indicator. The slot can be a GKD-B, GKD-C, or GKD-E slot, depending on the specific requirements and objectives of the indicator. This allows for seamless integration and utilization of the compound signal within the GKD-BT framework.
How does Loxx's GKD (Giga Kaleidoscope Modularized Trading System) implement the NNFX algorithm outlined above?
Loxx's GKD v2.0 system has five types of modules (indicators/strategies). These modules are:
1. GKD-BT - Backtesting module (Volatility, Number 1 in the NNFX algorithm)
2. GKD-B - Baseline module (Baseline and Volatility/Volume, Numbers 1 and 2 in the NNFX algorithm)
3. GKD-C - Confirmation 1/2 and Continuation module (Confirmation 1/2 and Continuation, Numbers 3, 4, and 5 in the NNFX algorithm)
4. GKD-V - Volatility/Volume module (Confirmation 1/2, Number 6 in the NNFX algorithm)
5. GKD-E - Exit module (Exit, Number 7 in the NNFX algorithm)
6. GKD-M - Metamorphosis module (Metamorphosis, Number 8 in the NNFX algorithm, but not part of the NNFX algorithm)
(additional module types will added in future releases)
Each module interacts with every module by passing data to A backtest module wherein the various components of the GKD system are combined to create a trading signal.
That is, the Baseline indicator passes its data to Volatility/Volume. The Volatility/Volume indicator passes its values to the Confirmation 1 indicator. The Confirmation 1 indicator passes its values to the Confirmation 2 indicator. The Confirmation 2 indicator passes its values to the Continuation indicator. The Continuation indicator passes its values to the Exit indicator, and finally, the Exit indicator passes its values to the Backtest strategy.
This chaining of indicators requires that each module conform to Loxx's GKD protocol, therefore allowing for the testing of every possible combination of technical indicators that make up the six components of the NNFX algorithm.
What does the application of the GKD trading system look like?
Example trading system:
Backtest: Full GKD Backtest
Baseline: Hull Moving Average
Volatility/Volume: Hurst Exponent
Confirmation 1: Composite RSI
Confirmation 2: uf2018
Continuation: Vortex
Exit: Rex Oscillator
Metamorphosis: Fisher Transform, Universal Oscillator, Aroon, Vortex .. combined
Each GKD indicator is denoted with a module identifier of either: GKD-BT, GKD-B, GKD-C, GKD-V, or GKD-E. This allows traders to understand to which module each indicator belongs and where each indicator fits into the GKD system.
█ Giga Kaleidoscope Modularized Trading System Signals
Standard Entry
1. GKD-C Confirmation gives signal
2. Baseline agrees
3. Price inside Goldie Locks Zone Minimum
4. Price inside Goldie Locks Zone Maximum
5. Confirmation 2 agrees
6. Volatility/Volume agrees
1-Candle Standard Entry
1a. GKD-C Confirmation gives signal
2a. Baseline agrees
3a. Price inside Goldie Locks Zone Minimum
4a. Price inside Goldie Locks Zone Maximum
Next Candle
1b. Price retraced
2b. Baseline agrees
3b. Confirmation 1 agrees
4b. Confirmation 2 agrees
5b. Volatility/Volume agrees
Baseline Entry
1. GKD-B Basline gives signal
2. Confirmation 1 agrees
3. Price inside Goldie Locks Zone Minimum
4. Price inside Goldie Locks Zone Maximum
5. Confirmation 2 agrees
6. Volatility/Volume agrees
7. Confirmation 1 signal was less than 'Maximum Allowable PSBC Bars Back' prior
1-Candle Baseline Entry
1a. GKD-B Baseline gives signal
2a. Confirmation 1 agrees
3a. Price inside Goldie Locks Zone Minimum
4a. Price inside Goldie Locks Zone Maximum
5a. Confirmation 1 signal was less than 'Maximum Allowable PSBC Bars Back' prior
Next Candle
1b. Price retraced
2b. Baseline agrees
3b. Confirmation 1 agrees
4b. Confirmation 2 agrees
5b. Volatility/Volume agrees
Volatility/Volume Entry
1. GKD-V Volatility/Volume gives signal
2. Confirmation 1 agrees
3. Price inside Goldie Locks Zone Minimum
4. Price inside Goldie Locks Zone Maximum
5. Confirmation 2 agrees
6. Baseline agrees
7. Confirmation 1 signal was less than 7 candles prior
1-Candle Volatility/Volume Entry
1a. GKD-V Volatility/Volume gives signal
2a. Confirmation 1 agrees
3a. Price inside Goldie Locks Zone Minimum
4a. Price inside Goldie Locks Zone Maximum
5a. Confirmation 1 signal was less than 'Maximum Allowable PSVVC Bars Back' prior
Next Candle
1b. Price retraced
2b. Volatility/Volume agrees
3b. Confirmation 1 agrees
4b. Confirmation 2 agrees
5b. Baseline agrees
Confirmation 2 Entry
1. GKD-C Confirmation 2 gives signal
2. Confirmation 1 agrees
3. Price inside Goldie Locks Zone Minimum
4. Price inside Goldie Locks Zone Maximum
5. Volatility/Volume agrees
6. Baseline agrees
7. Confirmation 1 signal was less than 7 candles prior
1-Candle Confirmation 2 Entry
1a. GKD-C Confirmation 2 gives signal
2a. Confirmation 1 agrees
3a. Price inside Goldie Locks Zone Minimum
4a. Price inside Goldie Locks Zone Maximum
5a. Confirmation 1 signal was less than 'Maximum Allowable PSC2C Bars Back' prior
Next Candle
1b. Price retraced
2b. Confirmation 2 agrees
3b. Confirmation 1 agrees
4b. Volatility/Volume agrees
5b. Baseline agrees
PullBack Entry
1a. GKD-B Baseline gives signal
2a. Confirmation 1 agrees
3a. Price is beyond 1.0x Volatility of Baseline
Next Candle
1b. Price inside Goldie Locks Zone Minimum
2b. Price inside Goldie Locks Zone Maximum
3b. Confirmation 1 agrees
4b. Confirmation 2 agrees
5b. Volatility/Volume agrees
Continuation Entry
1. Standard Entry, 1-Candle Standard Entry, Baseline Entry, 1-Candle Baseline Entry, Volatility/Volume Entry, 1-Candle Volatility/Volume Entry, Confirmation 2 Entry, 1-Candle Confirmation 2 Entry, or Pullback entry triggered previously
2. Baseline hasn't crossed since entry signal trigger
4. Confirmation 1 agrees
5. Baseline agrees
6. Confirmation 2 agrees
█ Connecting to Backtests
All GKD indicators are chained indicators meaning you export the value of the indicators to specialized backtest to creat your GKD trading system. Each indicator contains a proprietary signal generation algo that will only work with GKD backtests. You can find these backtests using the links below.
GKD-BT Giga Confirmation Stack Backtest:
GKD-BT Giga Stacks Backtest:
GKD-BT Full Giga Kaleidoscope Backtest:
GKD-BT Solo Confirmation Super Complex Backtest:
GKD-BT Solo Confirmation Complex Backtest:
GKD-BT Solo Confirmation Simple Backtest:

CryptoGraph StrategizerA complete system to backtest and automate comprehensive trading strategies
═════════════════════════════════════════════════════════════════════════
🟣 How it works
This indicator allows you to use buy & sell signals from external CryptoGraph indicators, and fully backtest these signals in the TradingView strategy tester. After configuring buy & sell signals, the trader can look into exit criteria with this indicator. The indicator offers percentage based an ATR based take profit/stop losses, as well as safety orders (DCA) in order to get a better average entry price.
Once your strategy is fully set up to your desired results, it's possible to set up alerts and connect the indicator through an automation platform ( API connection), to your broker. Alertatron & Wick Hunter auto configuration is included, meaning everything configured in the indicator settings, will automatically be carried out with Alertatron & Wick Hunter syntaxes.
🟣 Features
• Multiple methods of scaling in entries (Multiple DCA/Pyramiding methods). There will be an option to scale up or down your volume per order and distance between orders.
• Multiple methods of determining order sizes. Methods are percentage risk per trade, dollar risk per trade, position size in contracts, position size in percentage and position size in dollar.
• Multiple methods and levels of taking profits and losses. Both percentage based and ATR based take profit and stop loss.
• Option to use external indicator buy/sell signals for entry.
• Visualised liquidation prices in TradingView (both cross and isolated)
• Information panel on chart with additional information regarding your strategy results
• Bot setup directly from indicator inputs tab with Wick Hunter & Alertatron
🟣 How to use
• Choose a symbol that corresponds to your bot pair and exchange
• Pick a chart time frame
• Always use the regular candle type
• Configure your deal start condition
• Configure your profit target
• Use the Take Profit/Stop Loss feature to set a target for profit and loss
• Configure your safety orders
• Check your backtest parameters
•Make sure that the initial capital and order size make sense. Since you can use pyramiding in your strategy with safety orders, the sum of all deals should not be bigger than the initial capital

Crypto Tipster v2---------------------
Crypto Tipster v2
Hello again! We're back with a drastically improved Crypto Tipster v2 Indicator using over a dozen all new algorithms based around Technical Analysis, Price Action, Momentum Swings and Reversal Detection.
We've taken our time with version 2 of Crypto Tipster, putting all our best practices to work and ensuring it performs superbly across numerous crypto markets and timeframes - we have focused our efforts towards the larger timeframes, 12H, 1D, 2D for example as we believe these to be the most consistent and predictable, and therefore the most profitable.
Trading on longer timeframes also reduces the overal cost of trading fee's as you'll be placing fewer trades over any given time period, whilst catching bigger swings and therefore earning a higher percentage per winning trade. Due to these bigger price swings you can de-leverage your trades too, making them inherintly safer and more controlled.
The final benefit to placing trades on longer timeframes is that you will not be tied down to your PC or laptop for hours on end waiting for a perfect entry or exit point, which increases the odds of placing bad/panic trades or even placing trades due to boredom! If you trade with Crypto Tipster v2 on a 1D timeframe, you will only ever have work to do once per day, at bar close; this is when trades are placed or exited, or stop losses/take profits are updated to new levels - easy!
Crypto Tipster v2 can help consistently catch tops and bottoms of trending markets whilst avoiding placing trades through choppy or ranging areas, this helps to not only maximise profits (what we're all after!) but also to minimise losses (equally important). We've tirelessly tested Crypto Tipster using literally thousands of variables across dozens of built-in algorithms over hundreds of trading pairs - lots of data to process!
The outcome is rather stunning and well worth checking out - we're rather proud of what we've achieved here, and we're pretty sure you're going to love it too!
---------------------
What's Included
- Chart Settings
The first section you'll come across, Chart Settings.
Here you'll find a few options regarding how your chosen market chart will look within TradingView and how Crypto Tipster will interact with this chart.
One of the most important Tick boxes is first on the list - "Show Backtest Results". This will change Crypto Tipster from displaying simple but easy-to-follow "Buy/Sell" labels into Strategy mode in which you can set up more complicated Stop Loss / Take profit settings as well as setting up Alerts for auto trading and other more complex functions (see How It Works for more info!
We've also included a "Trend Strength Bar Color" tick box which changes the color of the chart bars based on how strong Crypto Tipster is perceiving the current trend and in which direction.
- Trend Settings
"Trading Frequency" represents how often Crypto Tipster will be looking for a new trend / change in trend direction, and therefore how often it will be placing trades. By default this is set to "Normal" but can be changed to "Rapid" using the drop down menu.
"Entry Trend Strength" also determines how frequently trades are placed by selecting the strength of trend required before a trade is placed. The scale ranges from "1-5", with 1 being a low trend strength required, 5 being a very strong trend strength required.
Within the Trend Settings section you'll also find an "Avg Trend Strength over Bars" option. This allows you to average (mean) the current trend strength over a pre-determined amount (1-5) of previous chart bars - thus providing a potentially more consistent signal.
- Trade Settings
Trade Settings help Crypto Tipster determine what type of trades you're looking to place.
The overall "Trade Direction" will decide to either target only Long trades, only Short trades, or Both (default).
"Consecutive Trades in Same Direction" allows for pyramiding - whereby you can specify to allow for multiple trades of the same direction. Set to "1" as default allows for no extra pyramiding, max setting of "10".
- Trade Protection
Currently consisting of two functions, our Trade Protection section can help to achieve both the removal of false signals (whipsaws), and the extension of good trades without confusion during minor retracements.
"Chop Removal" can help to remove some whipsaw trades during ranging market conditions, therefore improving overal profitability by only targeting stronger trends. You have an option to choose from either "Weak" or "Strong" Chop Removal.
"Protection Filter" uses current trading criteria as defined by you, and uses it to check against a higher time frame than you're currently viewing. This can help to eliminate some bad trades at the expense of a potential lag on good trades.
- Stop Loss / Take Profit
Stop Losses should be a crucial aspect of everyone's trading system. They help prevent any trade from going too far in the wrong direction and limit losses.
Our "Stop Loss (%)" is quick and easy to set up, simply set the percentage offset from the entry price of trades and a fixed Stop Loss will be in place on all trades.
"Take Profit (%)" works in the same way as the Stop Loss mentioned above - simply set the percentage you'd like to exit a profitable trade at.
The "Trailing Stop (%)" is a little more complicated in that it will follow the trend of the trade a certain percentage away from the current market price - this is great for keeping yourself in a trade for as long as the trade is moving in the right direction.
- Extra Tools & Indicators
This is the section of Crypto Tipster that enables you to add some chart visuals to assist you with your preferred trading style.
"Potential Pivot Points" are not the same as actual pivot points - Potential pivot points will paint on the chart at bar close, giving you an immediate alert to potential tops/bottoms of market trends. You can choose to display only the strongest potential points, or include some of the weaker signals too.
"Actual Pivot Points" are inherintly more accurate than Potential pivot points, but do not paint on the chart until after a pre-determined amount of time has passed. These are great for placing stop losses/take profits or watching the market for breakouts or reversals.
"Support/Resistance Levels" plots up to 6 support and resistance horizontal lines based on recent price tops/bottoms. Use these to determine areas where price could rebound or break-through.
"Bollinger Band Breakout" - Bollinger bands are a tried and tested technical analysis tool, similar to pivot points and support/resistance lines, thee are another great tool to determine where price may retrace, consolidate or breakout.
- Ichimoku Cloud
Somewhat confusing and intimidating when you first come across this technical analysis indicator, the "Ichimoku Cloud" is one of our favorites. Assisting with the detection of Dynamic Support and Resistance levels, Momentum and Trend Direction all in one super indicator.
Although certain aspects of the Ichimoku Cloud are already present within Crypto Tipster v2 algorithms in order to offer you the best possible signals, we've also included a user-definable section of it's own so you can manually set up and use the cloud for your own trading needs, all cloud signals (and there are many) are available to set up as Alerts for your own needs or an Auto-Trading Bot.
- Custom Alerts for Any Signal
We've endeavoured to ensure that all signals, not just the Buy/Sell signals, are ready and available to create Alerts with; giving you the most opportunity to create a fully custom trading engine that suits your exact trading requirements.
This means you can set Alerts for any and all signals you can see on the chart when using Crypto Tipster v2, this includes Buy/Sell Signals, Trend Strength Signals, Choppy Market Signals, Stop Loss/Take Profit Signals, Pivot Points, S/R levels crossed above & below, Bollinger Band Breakout and several Ichimoku Cloud Signals.. the list goes on!
---------------------
We've tried to make Crypto Tipster as comprehensive and easy to understand as possible, we are however always in search of progression; we do really love to hear your feedback :)
For more information and a free 8-day trial please visit the link in our signature
Happy Trading Guys

Channels Strategy [JoseMetal]============
ENGLISH
============
- Description:
This strategy is based on Bollinger Bands / Keltner Channel price "rebounds" (the idea of price bouncing from one band to another).
The strategy has several customizable options, which allows you to refine the strategy for your asset and timeframe.
You can customize settings for ALL indicators, Bollinger Bands (period and standard deviation), Keltner Channel (period and ATR multiplier) and ATR (period).
- AVAILABLE INDICATORS:
You can pick Bollinger Bands or Keltner Channels for the strategy, the chosen indicator will be plotted as well.
- CUSTOM CONDITIONS TO ENTER A POSITION:
1. Price breaks the band (low below lower band for LONG or high above higher band for SHORT).
2. Same as 1 but THEN (next candle) price closes INSIDE the bands.
3. Price breaks the band AND CLOSES OUT of the band (lower band for LONG and higher band for SHORT).
4. Same as 3 but THEN (next candle) price closes INSIDE the bands.
- STOP LOSS OPTIONS:
1. Previous wick (low of previous candle if LONG and high or previous candle if SHORT).
2. Extended band, you can customize settings for a second indicator with larger values to use it as STOP LOSS, for example, Bollinger Bands with 2 standard deviations to open positions and 3 for STOP LOSS.
3. ATR: you can pick average true ratio from a source (like closing price) with a multiplier to calculate STOP LOSS.
- TAKE PROFIT OPTIONS:
1. Opposite band (top band for LONGs, bottom band for SHORTs).
2. Moving average: Bollinger Bands simple moving average or Keltner Channel exponential moving average .
3. ATR: you can pick average true ratio from a source (like closing price) with a multiplier to calculate TAKE PROFIT.
- OTHER OPTIONS:
You can pick to trade only LONGs, only SHORTs, both or none (just indicator).
You can enable DYNAMIC TAKE PROFIT, which updates TAKE PROFIT on each candle, for example, if you pick "opposite band" as TAKE PROFIT, it'll update the TAKE PROFIT based on that, on every single new candle.
- Visual:
Bands shown will depend on the chosen indicator and it's settings.
ATR is only printed if used as STOP LOSS and/or TAKE PROFIT.
- Recommendations:
Recommended on DAILY timeframe , it works better with Keltner Channels rather than Bollinger Bands .
- Customization:
As you can see, almost everything is customizable, for colors and plotting styles check the "Style" tab.
Enjoy!
============
ESPAÑOL
============
- Descripción:
Esta estrategia se basa en los "rebotes" de precios en las Bandas de Bollinger / Canal de Keltner (la idea de que el precio rebote de una banda a otra).
La estrategia tiene varias opciones personalizables, lo que le permite refinar la estrategia para su activo y temporalidad favoritas.
Puedes personalizar la configuración de TODOS los indicadores, Bandas de Bollinger (periodo y desviación estándar), Canal de Keltner (periodo y multiplicador ATR) y ATR (periodo).
- INDICADORES DISPONIBLES:
Puedes elegir las Bandas de Bollinger o los Canales de Keltner para la estrategia, el indicador elegido será mostrado en pantalla.
- CONDICIONES PERSONALIZADAS PARA ENTRAR EN UNA POSICIÓN:
1. El precio rompe la banda (mínimo por debajo de la banda inferior para LONG o máximo por encima de la banda superior para SHORT).
2. Lo mismo que en el punto 1 pero ADEMÁS (en la siguiente vela) el precio cierra DENTRO de las bandas.
3. El precio rompe la banda Y CIERRA FUERA de la banda (banda inferior para LONG y banda superior para SHORT).
4. Igual que el 3 pero ADEMÁS (siguiente vela) el precio cierra DENTRO de las bandas.
- OPCIONES DE STOP LOSS:
1. Mecha anterior (mínimo de la vela anterior si es LONGy máximo de la vela anterior si es SHORT).
2. Banda extendida, puedes personalizar la configuración de un segundo indicador con valores más extensos para utilizarlo como STOP LOSS, por ejemplo, Bandas de Bollinger con 2 desviaciones estándar para abrir posiciones y 3 para STOP LOSS.
3. ATR: puedes elegir el average true ratio de una fuente (como el precio de cierre) con un multiplicador para calcular el STOP LOSS.
- OPCIONES DE TAKE PROFIT:
1. Banda opuesta (banda superior para LONGs, banda inferior para SHORTs).
2. Media móvil: media móvil simple de las Bandas de Bollinger o media móvil exponencial del Canal de Keltner .
3. ATR: se puede escoger el average true ratio de una fuente (como el precio de cierre) con un multiplicador para calcular el TAKE PROFIT.
- OTRAS OPCIONES:
Puedes elegir operar sólo con LONGs, sólo con SHORTs, ambos o ninguno (sólo el indicador).
Puedes activar el TAKE PROFIT DINÁMICO, que actualiza el TAKE PROFIT en cada vela, por ejemplo, si eliges "banda opuesta" como TAKE PROFIT, actualizará el TAKE PROFIT basado en eso, en cada nueva vela.
- Visual:
Las bandas mostradas dependerán del indicador elegido y de su configuración.
El ATR sólo se muestra si se utiliza como STOP LOSS y/o TAKE PROFIT.
- Recomendaciones:
Recomendada para temporalidad de DIARIO, funciona mejor con los Canales de Keltner que con las Bandas de Bollinger .
- Personalización:
Como puedes ver, casi todo es personalizable, para los colores y estilos de dibujo comprueba la pestaña "Estilo".
¡Que lo disfrutes!

MACD Strategy - Backtest [AlgoRider]█ OVERVIEW
Hello dear Tradingviewers !
We are excited to share with you this new indicator which simulates a trading strategy based solely on the well-known technical indicator MACD . We designed it for the sole educational and analytical purposes of showing novice traders and new investors that basing a trading strategy only on one such technical indicator is not necessarily a good thing to do. We do not recommend to apply this strategy for real.
Thanks to this indicator redesigned in our own way by incorporating our simple and easy-to-use Backtest functionality, you will be able to see and report on the performance and results that such a strategy has produced in the past.
The configuration window has also been designed to be easily readable and simple to use. Our goal is to make parameter customization as easy as possible.
█ HOW THE STRATEGY WORKS
• The script will simply trigger Long entries when bullish MACD crossings appear (the Macd line crosses the Signal line upwards) and Short entries when bearish MACD crossings appear (the Macd line crosses below the signal line).
• A Short signal ends a Long trade, a Long signal ends a Short trade.
• The script also allows setting up custom TP and SL.
• An option allows you to trigger early crossings, which will influence entries and exits.
• There is no repaint, once an entry/exit symbol or drawing is displayed it doesn't change anymore. The Short and Long signals appear at the open of the candles, just after the signal was confirmed at the close of the previous candle. The custom TP and custom SL signals can appear when a candle is not yet finished, but once displayed they don't change.
█ HOW TO PROCEED
1 — Once the script is applied to your chart, it already works with its default settings. You can already see the performance of the strategy in the data table directly on the chart (in the top right corner by default).
2 — You can customize the strategy and influence the results/performance by modifying its parameters. 3 types of parameters are present and can be modified.
3 — You can use this indicator in all types of markets.
4 — You can apply the script in every timeframe.
█ PARAMETERS
• Settings For Backtesting
- Strategy : Choose from a drop-down list if the strategy should execute only Long trades or only Short trades or both. Default Both.
- Invest. : Choose the amount you want to invest in the simulation. Default 10000.
- Position : Choose the amount of the position (Size order) that will be used during the simulation. This will be the $ amount staked/involved for each trade entry.
Ex: If you put 20000 in position and 10000 in Invest. We consider that you use at least a leverage x2. Default 10000.
- Slipp. TP : Choose the amount in percentage of average slippage for Take Profits. This parameter makes it possible to predict a potential gap between the theoretical exit price for each TP (On the graph) and the real exit price on an exchange when implementing the strategy for real (slippage may be due to a time lag of a few seconds from execution time of the order on the exchange and/or due to the execution of a market order).
Ex: If a TP exit order of a Long trade, with entry $19000 (on BTCUSDT ), is carried out in theory on the chart at $20000, in practice on the exchange the script have indeed sent an exit order at 20000 , but if the true exit price is 20050, the TP slippage is then +0.25%. Default 0.
- Slipp. SL : Choose the amount in percentage of average slippage for Stop Losses. This parameter makes it possible to predict a potential gap between the theoretical exit price for each SL (On the graph) and the real exit price on an exchange when implementing the strategy for real.
Ex: If an SL exit order of a Long trade, entry $19000 (on BTCUSDT ), is carried out in theory on the chart at $18000, in practice on the exchange the script have indeed sent an exit order at 18000 $, but if the true exit price is 17950, the slippage SL is then +0.278%. Default 0.
- Fees % : Choose the percentage amount of fees applied to each trade to simulate the application of the strategy on the exchange of your choice. Applies to the entry and exit of each trade. Ex: For Binance Futures: 0.04; For Bybit futures: 0.06; For Ftx Futures: 0.075. Default 0.
- Cumulate Trades : If you check this, the Backtest will use 100% of the balance as Order Size (Position) for All or in the next X consecutive trades. Default not checked.
⚠️ Be Careful please, this option is available to show the full extent and possibilities of the algorithm when pushed to its limits thanks to the accumulation of profits (cumulative earnings ), but it is a strategy that involves great risk. If a bad trade suffers a -50% loss, 50% of the account balance is lost, if the position is liquidated, the entire account balance is lost.
- All : If you check this All trades will be accumulated. Default not checked.
- Consecutive Trades : Choose the number of trades to accumulate. After X consecutive trades, the algorithm reassigns the initial order size to the current one and starts again for X consecutive trades. Minimum Value 2, Default 2.
• Settings To Optimize Performances and Risk Management
- Fast_MA : Choose the length of the Fast Moving Average. Default 12.
- Slow_MA : Choose the length of the Slow Moving Average. Default 26.
- Enable Early Crossings : If you check this, when the algorithm will detect an early crossing wethere bullish or bearish , it will trigger the Long or Short entries. Default not checked.
- Oscillator MA Type : Choose if the Macd line should be an Exponential Moving Average or a Simple Moving Average . Default Expo.
- Signal Line MA Type : Choose if the Signal line should be an Exponential Moving Average or a Simple Moving Average . Default Expo.
- Use TP / Use SL : If you check these, the algorithm will trigger personalized trade exit signals when the price evolution has reached the amounts indicated since the trade entry. Default not Checked.
- % TP - SL : Indicate here the personalized amount in percentage that you want for your Take Profit and Stop Loss of each trade. Default 15-5.
• Settings For Appearances
- Small-size Data Table : If you check this, the data table will become smaller to free up more space on the chart to make it visually more pleasing. Default not checked.
Hide Table /
- Hide Labels / : You can check these to get a cleaner chart and focus only on what interests you in the indicator. Default not checked.
Hide Risk-Reward Areas
█ LIMITATIONS
• ⚠️ We repeat it once again, this strategy is not intended to be reproduced in real conditions, we have designed it for educational and analytical purposes only.
• Even if you see good performances when you backtest the strategy, you must take into account that these results are performed in the past and that in no case does this guarantee that these same performances will be repeated again in the future.
• When you run for real a trading strategy you must be aware of the fact that you are solely responsible for the results that you will be able to obtain and you must be aware of the possibility at all times of partial or even total losses of your invested capital.
• Keep in mind that generating profits in trading is difficult. A strategy can perform very well at one time in the past during a period that is favorable to it, then from one day to the next it can give really bad results for several months or years.
• When backtesting a trading strategy, there are many factors to consider, not just trade entries to which you add a Take Profit and sometimes a Stop Loss. You must at least take into account the size of the position in relation to the capital you want to invest, the trading fees, the slippages (which can be really important depending on the exchange on which you are trading and depending on the asset you are trading), trading frequency, risk management, momentum, volumes and even more.
The information published here on TradingView is not prohibited, doesn't constitute investment advice, and isn't created solely for qualified investors.
═════════════════════════════════════════════════════════════════════════
Important to note : our indicators with the same backtesting system are published in separate publications, because putting them together in a single script would considerably slow down the execution of the script. In addition each indicator, even when it is based on a simple technical indicator, has several options, parameters and entry/exit conditions specific to the underlying technical indicator. Finally, we want to keep the simplicity of use, configuration and understanding of our indicator by not mixing strategies that have nothing to do with each other.
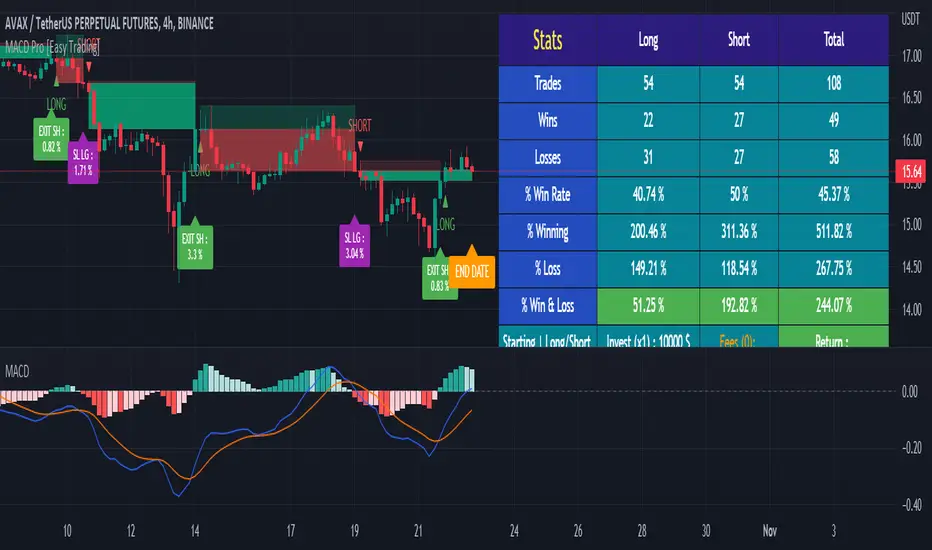
Webhook Starter Kit [HullBuster]
Introduction
This is an open source strategy which provides a framework for webhook enabled projects. It is designed to work out-of-the-box on any instrument triggering on an intraday bar interval. This is a full featured script with an emphasis on actual trading at a brokerage through the TradingView alert mechanism and without requiring browser plugins.
The source code is written in a self documenting style with clearly defined sections. The sections “communicate” with each other through state variables making it easy for the strategy to evolve and improve. This is an excellent place for Pine Language beginners to start their strategy building journey. The script exhibits many Pine Language features which will certainly ad power to your script building abilities.
This script employs a basic trend follow strategy utilizing a forward pyramiding technique. Trend detection is implemented through the use of two higher time frame series. The market entry setup is a Simple Moving Average crossover. Positions exit by passing through conditional take profit logic. The script creates ten indicators including a Zscore oscillator to measure support and resistance levels. The indicator parameters are exposed through 47 strategy inputs segregated into seven sections. All of the inputs are equipped with detailed tool tips to help you get started.
To improve the transition from simulation to execution, strategy.entry and strategy.exit calls show enhanced message text with embedded keywords that are combined with the TradingView placeholders at alert time. Thereby, enabling a single JSON message to generate multiple execution events. This is genius stuff from the Pine Language development team. Really excellent work!
This document provides a sample alert message that can be applied to this script with relatively little modification. Without altering the code, the strategy inputs can alter the behavior to generate thousands of orders or simply a few dozen. It can be applied to crypto, stocks or forex instruments. A good way to look at this script is as a webhook lab that can aid in the development of your own endpoint processor, impress your co-workers and have hours of fun.
By no means is a webhook required or even necessary to benefit from this script. The setups, exits, trend detection, pyramids and DCA algorithms can be easily replaced with more sophisticated versions. The modular design of the script logic allows you to incrementally learn and advance this script into a functional trading system that you can be proud of.
Design
This is a trend following strategy that enters long above the trend line and short below. There are five trend lines that are visible by default but can be turned off in Section 7. Identified, in frequency order, as follows:
1. - EMA in the chart time frame. Intended to track price pressure. Configured in Section 3.
2. - ALMA in the higher time frame specified in Section 2 Signal Line Period.
3. - Linear Regression in the higher time frame specified in Section 2 Signal Line Period.
4. - Linear Regression in the higher time frame specified in Section 2 Signal Line Period.
5. - DEMA in the higher time frame specified in Section 2 Trend Line Period.
The Blue, Green and Orange lines are signal lines are on the same time frame. The time frame selected should be at least five times greater than the chart time frame. The Purple line represents the trend line for which prices above the line suggest a rising market and prices below a falling market. The time frame selected for the trend should be at least five times greater than the signal lines.
Three oscillators are created as follows:
1. Stochastic - In the chart time frame. Used to enter forward pyramids.
2. Stochastic - In the Trend period. Used to detect exit conditions.
3. Zscore - In the Signal period. Used to detect exit conditions.
The Stochastics are configured identically other than the time frame. The period is set in Section 2.
Two Simple Moving Averages provide the trade entry conditions in the form of a crossover. Crossing up is a long entry and down is a short. This is in fact the same setup you get when you select a basic strategy from the Pine editor. The crossovers are configured in Section 3. You can see where the crosses are occurring by enabling Show Entry Regions in Section 7.
The script has the capacity for pyramids and DCA. Forward pyramids are enabled by setting the Pyramid properties tab with a non zero value. In this case add on trades will enter the market on dips above the position open price. This process will continue until the trade exits. Downward pyramids are available in Crypto and Range mode only. In this case add on trades are placed below the entry price in the drawdown space until the stop is hit. To enable downward pyramids set the Pyramid Minimum Span In Section 1 to a non zero value.
This implementation of Dollar Cost Averaging (DCA) triggers off consecutive losses. Each loss in a run increments a sequence number. The position size is increased as a multiple of this sequence. When the position eventually closes at a profit the sequence is reset. DCA is enabled by setting the Maximum DCA Increments In Section 1 to a non zero value.
It should be noted that the pyramid and DCA features are implemented using a rudimentary design and as such do not perform with the precision of my invite only scripts. They are intended as a feature to stress test your webhook endpoint. As is, you will need to buttress the logic for it to be part of an automated trading system. It is for this reason that I did not apply a Martingale algorithm to this pyramid implementation. But, hey, it’s an open source script so there is plenty of room for learning and your own experimentation.
How does it work
The overall behavior of the script is governed by the Trading Mode selection in Section 1. It is the very first input so you should think about what behavior you intend for this strategy at the onset of the configuration. As previously discussed, this script is designed to be a trend follower. The trend being defined as where the purple line is predominately heading. In BiDir mode, SMA crossovers above the purple line will open long positions and crosses below the line will open short. If pyramiding is enabled add on trades will accumulate on dips above the entry price. The value applied to the Minimum Profit input in Section 1 establishes the threshold for a profitable exit. This is not a hard number exit. The conditional exit logic must be satisfied in order to permit the trade to close. This is where the effort put into the indicator calibration is realized. There are four ways the trade can exit at a profit:
1. Natural exit. When the blue line crosses the green line the trade will close. For a long position the blue line must cross under the green line (downward). For a short the blue must cross over the green (upward).
2. Alma / Linear Regression event. The distance the blue line is from the green and the relative speed the cross is experiencing determines this event. The activation thresholds are set in Section 6 and relies on the period and length set in Section 2. A long position will exit on an upward thrust which exceeds the activation threshold. A short will exit on a downward thrust.
3. Exponential event. The distance the yellow line is from the blue and the relative speed the cross is experiencing determines this event. The activation thresholds are set in Section 3 and relies on the period and length set in the same section.
4. Stochastic event. The purple line stochastic is used to measure overbought and over sold levels with regard to position exits. Signal line positions combined with a reading over 80 signals a long profit exit. Similarly, readings below 20 signal a short profit exit.
Another, optional, way to exit a position is by Bale Out. You can enable this feature in Section 1. This is a handy way to reduce the risk when carrying a large pyramid stack. Instead of waiting for the entire position to recover we exit early (bale out) as soon as the profit value has doubled.
There are lots of ways to implement a bale out but the method I used here provides a succinct example. Feel free to improve on it if you like. To see where the Bale Outs occur, enable Show Bale Outs in Section 7. Red labels are rendered below each exit point on the chart.
There are seven selectable Trading Modes available from the drop down in Section 1:
1. Long - Uses the strategy.risk.allow_entry_in to execute long only trades. You will still see shorts on the chart.
2. Short - Uses the strategy.risk.allow_entry_in to execute short only trades. You will still see long trades on the chart.
3. BiDir - This mode is for margin trading with a stop. If a long position was initiated above the trend line and the price has now fallen below the trend, the position will be reversed after the stop is hit. Forward pyramiding is available in this mode if you set the Pyramiding value in the Properties tab. DCA can also be activated.
4. Flip Flop - This is a bidirectional trading mode that automatically reverses on a trend line crossover. This is distinctively different from BiDir since you will get a reversal even without a stop which is advantageous in non-margin trading.
5. Crypto - This mode is for crypto trading where you are buying the coins outright. In this case you likely want to accumulate coins on a crash. Especially, when all the news outlets are talking about the end of Bitcoin and you see nice deep valleys on the chart. Certainly, under these conditions, the market will be well below the purple line. No margin so you can’t go short. Downward pyramids are enabled for Crypto mode when two conditions are met. First the Pyramiding value in the Properties tab must be non zero. Second the Pyramid Minimum Span in Section 1 must be non zero.
6. Range - This is a counter trend trading mode. Longs are entered below the purple trend line and shorts above. Useful when you want to test your webhook in a market where the trend line is bisecting the signal line series. Remember that this strategy is a trend follower. It’s going to get chopped out in a range bound market. By turning on the Range mode you will at least see profitable trades while stuck in the range. However, when the market eventually picks a direction, this mode will sustain losses. This range trading mode is a rudimentary implementation that will need a lot of improvement if you want to create a reliable switch hitter (trend/range combo).
7. No Trade. Useful when setting up the trend lines and the entry and exit is not important.
Once in the trade, long or short, the script tests the exit condition on every bar. If not a profitable exit then it checks if a pyramid is required. As mentioned earlier, the entry setups are quite primitive. Although they can easily be replaced by more sophisticated algorithms, what I really wanted to show is the diminished role of the position entry in the overall life of the trade. Professional traders spend much more time on the management of the trade beyond the market entry. While your trade entry is important, you can get in almost anywhere and still land a profitable exit.
If DCA is enabled, the size of the position will increase in response to consecutive losses. The number of times the position can increase is limited by the number set in Maximum DCA Increments of Section 1. Once the position breaks the losing streak the trade size will return the default quantity set in the Properties tab. It should be noted that the Initial Capital amount set in the Properties tab does not affect the simulation in the same way as a real account. In reality, running out of money will certainly halt trading. In fact, your account would be frozen long before the last penny was committed to a trade. On the other hand, TradingView will keep running the simulation until the current bar even if your funds have been technically depleted.
Entry and exit use the strategy.entry and strategy.exit calls respectfully. The alert_message parameter has special keywords that the endpoint expects to properly calculate position size and message sequence. The alert message will embed these keywords in the JSON object through the {{strategy.order.alert_message}} placeholder. You should use whatever keywords are expected from the endpoint you intend to webhook in to.
Webhook Integration
The TradingView alerts dialog provides a way to connect your script to an external system which could actually execute your trade. This is a fantastic feature that enables you to separate the data feed and technical analysis from the execution and reporting systems. Using this feature it is possible to create a fully automated trading system entirely on the cloud. Of course, there is some work to get it all going in a reliable fashion. Being a strategy type script place holders such as {{strategy.position_size}} can be embedded in the alert message text. There are more than 10 variables which can write internal script values into the message for delivery to the specified endpoint.
Entry and exit use the strategy.entry and strategy.exit calls respectfully. The alert_message parameter has special keywords that my endpoint expects to properly calculate position size and message sequence. The alert message will embed these keywords in the JSON object through the {{strategy.order.alert_message}} placeholder. You should use whatever keywords are expected from the endpoint you intend to webhook in to.
Here is an excerpt of the fields I use in my webhook signal:
"broker_id": "kraken",
"account_id": "XXX XXXX XXXX XXXX",
"symbol_id": "XMRUSD",
"action": "{{strategy.order.action}}",
"strategy": "{{strategy.order.id}}",
"lots": "{{strategy.order.contracts}}",
"price": "{{strategy.order.price}}",
"comment": "{{strategy.order.alert_message}}",
"timestamp": "{{time}}"
Though TradingView does a great job in dispatching your alert this feature does come with a few idiosyncrasies. Namely, a single transaction call in your script may cause multiple transmissions to the endpoint. If you are using placeholders each message describes part of the transaction sequence. A good example is closing a pyramid stack. Although the script makes a single strategy.close() call, the endpoint actually receives a close message for each pyramid trade. The broker, on the other hand, only requires a single close. The incongruity of this situation is exacerbated by the possibility of messages being received out of sequence. Depending on the type of order designated in the message, a close or a reversal. This could have a disastrous effect on your live account. This broker simulator has no idea what is actually going on at your real account. Its just doing the job of running the simulation and sending out the computed results. If your TradingView simulation falls out of alignment with the actual trading account lots of really bad things could happen. Like your script thinks your are currently long but the account is actually short. Reversals from this point forward will always be wrong with no one the wiser. Human intervention will be required to restore congruence. But how does anyone find out this is occurring? In closed systems engineering this is known as entropy. In practice your webhook logic should be robust enough to detect these conditions. Be generous with the placeholder usage and give the webhook code plenty of information to compare states. Both issuer and receiver. Don’t blindly commit incoming signals without verifying system integrity.
Setup
The following steps provide a very brief set of instructions that will get you started on your first configuration. After you’ve gone through the process a couple of times, you won’t need these anymore. It’s really a simple script after all. I have several example configurations that I used to create the performance charts shown. I can share them with you if you like. Of course, if you’ve modified the code then these steps are probably obsolete.
There are 47 inputs divided into seven sections. For the most part, the configuration process is designed to flow from top to bottom. Handy, tool tips are available on every field to help get you through the initial setup.
Step 1. Input the Base Currency and Order Size in the Properties tab. Set the Pyramiding value to zero.
Step 2. Select the Trading Mode you intend to test with from the drop down in Section 1. I usually select No Trade until I’ve setup all of the trend lines, profit and stop levels.
Step 3. Put in your Minimum Profit and Stop Loss in the first section. This is in pips or currency basis points (chart right side scale). Remember that the profit is taken as a conditional exit not a fixed limit. The actual profit taken will almost always be greater than the amount specified. The stop loss, on the other hand, is indeed a hard number which is executed by the TradingView broker simulator when the threshold is breached.
Step 4. Apply the appropriate value to the Tick Scalar field in Section 1. This value is used to remove the pipette from the price. You can enable the Summary Report in Section 7 to see the TradingView minimum tick size of the current chart.
Step 5. Apply the appropriate Price Normalizer value in Section 1. This value is used to normalize the instrument price for differential calculations. Basically, we want to increase the magnitude to significant digits to make the numbers more meaningful in comparisons. Though I have used many normalization techniques, I have always found this method to provide a simple and lightweight solution for less demanding applications. Most of the time the default value will be sufficient. The Tick Scalar and Price Normalizer value work together within a single calculation so changing either will affect all delta result values.
Step 6. Turn on the trend line plots in Section 7. Then configure Section 2. Try to get the plots to show you what’s really happening not what you want to happen. The most important is the purple trend line. Select an interval and length that seem to identify where prices tend to go during non-consolidation periods. Remember that a natural exit is when the blue crosses the green line.
Step 7. Enable Show Event Regions in Section 7. Then adjust Section 6. Blue background fills are spikes and red fills are plunging prices. These measurements should be hard to come by so you should see relatively few fills on the chart if you’ve set this up as intended. Section 6 includes the Zscore oscillator the state of which combines with the signal lines to detect statistically significant price movement. The Zscore is a zero based calculation with positive and negative magnitude readings. You want to input a reasonably large number slightly below the maximum amplitude seen on the chart. Both rise and fall inputs are entered as a positive real number. You can easily use my code to create a separate indicator if you want to see it in action. The default value is sufficient for most configurations.
Step 8. Turn off Show Event Regions and enable Show Entry Regions in Section 7. Then adjust Section 3. This section contains two parts. The entry setup crossovers and EMA events. Adjust the crossovers first. That is the Fast Cross Length and Slow Cross Length. The frequency of your trades will be shown as blue and red fills. There should be a lot. Then turn off Show Event Regions and enable Display EMA Peaks. Adjust all the fields that have the word EMA. This is actually the yellow line on the chart. The blue and red fills should show much less than the crossovers but more than event fills shown in Step 7.
Step 9. Change the Trading Mode to BiDir if you selected No Trades previously. Look on the chart and see where the trades are occurring. Make adjustments to the Minimum Profit and Stop Offset in Section 1 if necessary. Wider profits and stops reduce the trade frequency.
Step 10. Go to Section 4 and 5 and make fine tuning adjustments to the long and short side.
Example Settings
To reproduce the performance shown on the chart please use the following configuration: (Bitcoin on the Kraken exchange)
1. Select XBTUSD Kraken as the chart symbol.
2. On the properties tab set the Order Size to: 0.01 Bitcoin
3. On the properties tab set the Pyramiding to: 12
4. In Section 1: Select “Crypto” for the Trading Model
5. In Section 1: Input 2000 for the Minimum Profit
6. In Section 1: Input 0 for the Stop Offset (No Stop)
7. In Section 1: Input 10 for the Tick Scalar
8. In Section 1: Input 1000 for the Price Normalizer
9. In Section 1: Input 2000 for the Pyramid Minimum Span
10. In Section 1: Check mark the Position Bale Out
11. In Section 2: Input 60 for the Signal Line Period
12. In Section 2: Input 1440 for the Trend Line Period
13. In Section 2: Input 5 for the Fast Alma Length
14. In Section 2: Input 22 for the Fast LinReg Length
15. In Section 2: Input 100 for the Slow LinReg Length
16. In Section 2: Input 90 for the Trend Line Length
17. In Section 2: Input 14 Stochastic Length
18. In Section 3: Input 9 Fast Cross Length
19. In Section 3: Input 24 Slow Cross Length
20. In Section 3: Input 8 Fast EMA Length
21. In Section 3: Input 10 Fast EMA Rise NetChg
22. In Section 3: Input 1 Fast EMA Rise ROC
23. In Section 3: Input 10 Fast EMA Fall NetChg
24. In Section 3: Input 1 Fast EMA Fall ROC
25. In Section 4: Check mark the Long Natural Exit
26. In Section 4: Check mark the Long Signal Exit
27. In Section 4: Check mark the Long Price Event Exit
28. In Section 4: Check mark the Long Stochastic Exit
29. In Section 5: Check mark the Short Natural Exit
30. In Section 5: Check mark the Short Signal Exit
31. In Section 5: Check mark the Short Price Event Exit
32. In Section 5: Check mark the Short Stochastic Exit
33. In Section 6: Input 120 Rise Event NetChg
34. In Section 6: Input 1 Rise Event ROC
35. In Section 6: Input 5 Min Above Zero ZScore
36. In Section 6: Input 120 Fall Event NetChg
37. In Section 6: Input 1 Fall Event ROC
38. In Section 6: Input 5 Min Below Zero ZScore
In this configuration we are trading in long only mode and have enabled downward pyramiding. The purple trend line is based on the day (1440) period. The length is set at 90 days so it’s going to take a while for the trend line to alter course should this symbol decide to node dive for a prolonged amount of time. Your trades will still go long under those circumstances. Since downward accumulation is enabled, your position size will grow on the way down.
The performance example is Bitcoin so we assume the trader is buying coins outright. That being the case we don’t need a stop since we will never receive a margin call. New buy signals will be generated when the price exceeds the magnitude and speed defined by the Event Net Change and Rate of Change.
Feel free to PM me with any questions related to this script. Thank you and happy trading!
CFTC RULE 4.41
These results are based on simulated or hypothetical performance results that have certain inherent limitations. Unlike the results shown in an actual performance record, these results do not represent actual trading. Also, because these trades have not actually been executed, these results may have under-or over-compensated for the impact, if any, of certain market factors, such as lack of liquidity. Simulated or hypothetical trading programs in general are also subject to the fact that they are designed with the benefit of hindsight. No representation is being made that any account will or is likely to achieve profits or losses similar to these being shown.

Zignaly TutorialThis strategy serves as a beginner's guide to connect TradingView signals to Zignaly Crypto Trading Platform.
It was originally tested at BTCUSDT pair and 1D timeframe.
Before using this documentation it's recommended that you:
Use default TradingView strategy script or another script and setup its associated alert manually. Just make the alert pop-up in the screen.
Create a 'Copy-Trader provider' (or Signal Provider) in Zignaly and send signals to it either thanks to your browser or with some basic programming.
SETTINGS
__ SETTINGS - Capital
(CAPITAL) Capital quote invested per order in USDT units {100.0}. This setting is only used when '(ZIG) Provider type' is set to 'Signal Provider'.
(CAPITAL) Capital percentage invested per order (%) {25.0}. This setting is only used when '(ZIG) Provider type' is set to 'Copy Trader Provider'.
__ SETTINGS - Misc
(ZIG) Enable Alert message {True}: Whether to enable alert message or not.
(DEBUG) Enable debug on order comments {True}: Whether to show alerts on order comments or not.
Number of decimal digits for Prices {2}.
(DECIMAL) Maximum number of decimal for contracts {3}.
__ SETTINGS - Zignaly
(ZIG) Integration type {TradingView only}: Hybrid : Both TradingView and Zignaly handle take profit, trailing stops and stop losses. Useful if you are scared about TradingView not firing an alert. It might arise problems if TradingView and Zignaly get out of sync. TradingView only : TradingView sends entry and exit orders to Zignaly so that Zignaly only buys or sells. Zignaly won't handle stop loss or other settings on its own.
(ZIG) Zignaly Alert Type {WebHook}: 'Email' or 'WebHook'.
(ZIG) Provider type {Copy Trader Provider}: 'Copy Trader Provider' or 'Signal Provider'. 'Copy Trader Provider' sends a percentage to manage. 'Signal Provider' sends a quote to manage.
(ZIG) Exchange: 'Binance' or 'Kucoin'.
(ZIG) Exchange Type {Spot}: 'Spot' or 'Futures'.
(ZIG) Leverage {1}. Set it to '1' when '(ZIG) Exchange Type' is set to 'Spot'.
__ SETTINGS - Strategy
(STRAT) Strategy Type: 'Long and Short', 'Long Only' or 'Short Only'.
(STOPTAKE) Take Profit? {false}: Whether to enable Take Profit.
(STOPTAKE) Stop Loss? {True}: Whether to enable Stop Loss.
(TRAILING) Enable Trailing Take Profit (%) {True}: Whether to enable Trailing Take Profit.
(STOPTAKE) Take Profit % {3.0}: Take profit percentage. This setting is only used when '(STOPTAKE) Take Profit?' setting is set to true.
(STOPTAKE) Stop Loss % {2.0}: Stop loss percentage. This setting is only used when '(STOPTAKE) Stop Loss?' setting is set to true.
(TRAILING) Trailing Take Profit Trigger (%) {2.5}: Trailing Stop Trigger Percentage. This setting is only used when '(TRAILING) Enable Trailing Take Profit (%)' setting is set to true.
(TRAILING) Trailing Take Profit as a percentage of Trailing Take Profit Trigger (%) {25.0}: Trailing Stop Distance Percentage. This setting is only used when '(TRAILING) Enable Trailing Take Profit (%)' setting is set to true.
(RECENT) Number of minutes to wait to open a new order after the previous one has been opened {6}.
DEFAULT SETTINGS
By default this strategy has been setup with these beginner settings:
'(ZIG) Integration type' : TradingView only
'(ZIG) Provider type' : 'Copy Trader Provider'
'(ZIG) Exchange' : 'Binance'
'(ZIG) Exchange Type' : 'Spot'
'(STRAT) Strategy Type' : 'Long Only'
'(ZIG) Leverage' : '1' (Or no leverage)
but you can change those settings if needed.
FIRST STEP
For both future of spot markets you should make sure to change '(ZIG) Zignaly Alert Type' to match either WebHook or Email. If you have a non paid account in TradingView as in October 2020 you would have to use Email which it's free to use.
RECOMMENDED SETTINGS
__ RECOMMENDED SETTINGS - Spot markets
'(ZIG) Exchange Type' setting should be set to 'Spot'
'(STRAT) Strategy Type' setting should be set to 'Long Only'
'(ZIG) Leverage' setting should be set to '1'
__ RECOMMENDED SETTINGS - Future markets
'(ZIG) Exchange Type' setting should be set to 'Futures'
'(STRAT) Strategy Type' setting should be set to 'Long and Short'
'(ZIG) Leverage' setting might be changed if desired.
__ RECOMMENDED SETTINGS - Signal Providers
'(ZIG) Provider type' setting should be set to 'Signal Provider'
'(CAPITAL) Capital quote invested per order in USDT units' setting might be changed if desired.
__ RECOMMENDED SETTINGS - Copy Trader Providers
'(ZIG) Provider type' setting should be set to 'Copy Trader Provider'
'(CAPITAL) Capital percentage invested per order (%)' setting might be changed if desired.
Strategy Properties setting: 'Initial Capital' might be changed if desired.
INTEGRATION TYPE EXPLANATION
'Hybrid': Both TradingView and Zignaly handle take profit, trailing stops and stop losses. Useful if you are scared about TradingView not firing an alert. It might arise problems if TradingView and Zignaly get out of sync.
'TradingView only': TradingView sends entry and exit orders to Zignaly so that Zignaly only buys or sells. Zignaly won't handle stop loss or other settings on its own.
HOW TO USE THIS STRATEGY
Beginner: Copy and paste the strategy and change it to your needs. Turn off '(DEBUG) Enable debug on order comments' setting.
Medium: Reuse functions and inputs from this strategy into your own as if it was a library.
Advanced: Check Strategy Tester. List of trades. Copy and paste the different suggested 'alert_message' variable contents to your script.
Expert: I needed a way to pass data from TradingView script to the alert. Now I know it's the 'alert_message' variable. I can do this own my own.
ALERTS SETUP
This is the important piece of information that allows you to connect TradingView to Zignaly in a semi-automatic manner.
__ ALERTS SETUP - WebHook
Webhook URL: https : // zignaly . com / api / signals.php?key=MYSECRETKEY
Message: { {{strategy.order.alert_message}} , "key" : "MYSECRETKEY" }
__ ALERTS SETUP - Email
Setup a new Hotmail account
Add it as an 'SMS email' in TradingView Profile settings page.
Confirm your own the email address
Create a rule in your Hotmail account that 'Redirects' (not forwards) emails to 'signals @ zignaly . email' when (1): 'Subject' includes 'Alert', (2): 'Email body' contains string 'MYZIGNALYREDIRECTTRIGGER' and (3): 'From' contains 'noreply @ tradingview . com'.
In 'More Actions' check: Send Email-to-SMS
Message: ||{{strategy.order.alert_message}}||key=MYSECRETKEY||
MYZIGNALYREDIRECTTRIGGER
'(DEBUG) Enable debug on order comments' is turned on by default so that you can see in the Strategy Tester. List of Trades. The different orders alert_message that would have been sent to your alert. You might want to turn it off it some many letters in the screen is problem.
STRATEGY ADVICE
If you turn on 'Take Profit' then turn off 'Trailing Take Profit'.
ZIGNALY SIDE ADVICE
If you are a 'Signal Provider' make sure that 'Allow reusing the same signalId if there isn't any open position using it?' setting in the profile tab is set to true.
You can find your 'MYSECRETKEY' in your 'Copy Trader/Signal' provider Edit tab at 'Signal URL'.
ADDITIONAL ZIGNALY DOCUMENTATION
docs . zignaly . com / signals / how-to -- How to send signals to Zignaly
3 Ways to send signals to Zignaly
SIGNALS
FINAL REMARKS
This strategy tries to match the Pine Script Coding Conventions as best as possible.
