Mean Reversion Cloud (Ornstein-Uhlenbeck) // AlgoFyreThe Mean Reversion Cloud (Ornstein-Uhlenbeck) indicator detects mean-reversion opportunities by applying the Ornstein-Uhlenbeck process. It calculates a dynamic mean using an Exponential Weighted Moving Average, surrounded by volatility bands, signaling potential buy/sell points when prices deviate.
TABLE OF CONTENTS
🔶 ORIGINALITY
🔸Adaptive Mean Calculation
🔸Volatility-Based Cloud
🔸Speed of Reversion (θ)
🔶 FUNCTIONALITY
🔸Dynamic Mean and Volatility Bands
🞘 How it works
🞘 How to calculate
🞘 Code extract
🔸Visualization via Table and Plotshapes
🞘 Table Overview
🞘 Plotshapes Explanation
🞘 Code extract
🔶 INSTRUCTIONS
🔸Step-by-Step Guidelines
🞘 Setting Up the Indicator
🞘 Understanding What to Look For on the Chart
🞘 Possible Entry Signals
🞘 Possible Take Profit Strategies
🞘 Possible Stop-Loss Levels
🞘 Additional Tips
🔸Customize settings
🔶 CONCLUSION
▅▅▅▅▅▅▅▅▅▅▅▅▅▅▅▅▅▅▅▅▅▅▅▅▅▅▅▅▅▅▅▅▅▅▅▅▅▅▅▅▅▅▅▅▅▅
🔶 ORIGINALITY The Mean Reversion Cloud (Ornstein-Uhlenbeck) is a unique indicator that applies the Ornstein-Uhlenbeck stochastic process to identify mean-reverting behavior in asset prices. Unlike traditional moving average-based indicators, this model uses an Exponentially Weighted Moving Average (EWMA) to calculate the long-term mean, dynamically adjusting to recent price movements while still considering all historical data. It also incorporates volatility bands, providing a "cloud" that visually highlights overbought or oversold conditions. By calculating the speed of mean reversion (θ) through the autocorrelation of log returns, this indicator offers traders a more nuanced and mathematically robust tool for identifying mean-reversion opportunities. These innovations make it especially useful for markets that exhibit range-bound characteristics, offering timely buy and sell signals based on statistical deviations from the mean.
🔸Adaptive Mean Calculation Traditional MA indicators use fixed lengths, which can lead to lagging signals or over-sensitivity in volatile markets. The Mean Reversion Cloud uses an Exponentially Weighted Moving Average (EWMA), which adapts to price movements by dynamically adjusting its calculation, offering a more responsive mean.
🔸Volatility-Based Cloud Unlike simple moving averages that only plot a single line, the Mean Reversion Cloud surrounds the dynamic mean with volatility bands. These bands, based on standard deviations, provide traders with a visual cue of when prices are statistically likely to revert, highlighting potential reversal zones.
🔸Speed of Reversion (θ) The indicator goes beyond price averages by calculating the speed at which the price reverts to the mean (θ), using the autocorrelation of log returns. This gives traders an additional tool for estimating the likelihood and timing of mean reversion, making the signals more reliable in practice.
🔶 FUNCTIONALITY The Mean Reversion Cloud (Ornstein-Uhlenbeck) indicator is designed to detect potential mean-reversion opportunities in asset prices by applying the Ornstein-Uhlenbeck stochastic process. It calculates a dynamic mean through the Exponentially Weighted Moving Average (EWMA) and plots volatility bands based on the standard deviation of the asset's price over a specified period. These bands create a "cloud" that represents expected price fluctuations, helping traders to identify overbought or oversold conditions. By calculating the speed of reversion (θ) from the autocorrelation of log returns, the indicator offers a more refined way of assessing how quickly prices may revert to the mean. Additionally, the inclusion of volatility provides a comprehensive view of market conditions, allowing for more accurate buy and sell signals.
Let's dive into the details:
🔸Dynamic Mean and Volatility Bands The dynamic mean (μ) is calculated using the EWMA, giving more weight to recent prices but considering all historical data. This process closely resembles the Ornstein-Uhlenbeck (OU) process, which models the tendency of a stochastic variable (such as price) to revert to its mean over time. Volatility bands are plotted around the mean using standard deviation, forming the "cloud" that signals overbought or oversold conditions. The cloud adapts dynamically to price fluctuations and market volatility, making it a versatile tool for mean-reversion strategies. 🞘 How it works Step one: Calculate the dynamic mean (μ) The Ornstein-Uhlenbeck process describes how a variable, such as an asset's price, tends to revert to a long-term mean while subject to random fluctuations. In this indicator, the EWMA is used to compute the dynamic mean (μ), mimicking the mean-reverting behavior of the OU process. Use the EWMA formula to compute a weighted mean that adjusts to recent price movements. Assign exponentially decreasing weights to older data while giving more emphasis to current prices. Step two: Plot volatility bands Calculate the standard deviation of the price over a user-defined period to determine market volatility. Position the upper and lower bands around the mean by adding and subtracting a multiple of the standard deviation. 🞘 How to calculate Exponential Weighted Moving Average (EWMA)
The EWMA dynamically adjusts to recent price movements:
mu_t = lambda * mu_{t-1} + (1 - lambda) * P_t
Where mu_t is the mean at time t, lambda is the decay factor, and P_t is the price at time t. The higher the decay factor, the more weight is given to recent data.
Autocorrelation (ρ) and Standard Deviation (σ)
To measure mean reversion speed and volatility: rho = correlation(log(close), log(close ), length) Where rho is the autocorrelation of log returns over a specified period.
To calculate volatility:
sigma = stdev(close, length)
Where sigma is the standard deviation of the asset's closing price over a specified length.
Upper and Lower Bands
The upper and lower bands are calculated as follows:
upper_band = mu + (threshold * sigma)
lower_band = mu - (threshold * sigma)
Where threshold is a multiplier for the standard deviation, usually set to 2. These bands represent the range within which the price is expected to fluctuate, based on current volatility and the mean.
🞘 Code extract // Calculate Returns
returns = math.log(close / close )
// Calculate Long-Term Mean (μ) using EWMA over the entire dataset
var float ewma_mu = na // Initialize ewma_mu as 'na'
ewma_mu := na(ewma_mu ) ? close : decay_factor * ewma_mu + (1 - decay_factor) * close
mu = ewma_mu
// Calculate Autocorrelation at Lag 1
rho1 = ta.correlation(returns, returns , corr_length)
// Ensure rho1 is within valid range to avoid errors
rho1 := na(rho1) or rho1 <= 0 ? 0.0001 : rho1
// Calculate Speed of Mean Reversion (θ)
theta = -math.log(rho1)
// Calculate Volatility (σ)
sigma = ta.stdev(close, corr_length)
// Calculate Upper and Lower Bands
upper_band = mu + threshold * sigma
lower_band = mu - threshold * sigma
🔸Visualization via Table and Plotshapes
The table shows key statistics such as the current value of the dynamic mean (μ), the number of times the price has crossed the upper or lower bands, and the consecutive number of bars that the price has remained in an overbought or oversold state.
Plotshapes (diamonds) are used to signal buy and sell opportunities. A green diamond below the price suggests a buy signal when the price crosses below the lower band, and a red diamond above the price indicates a sell signal when the price crosses above the upper band.
The table and plotshapes provide a comprehensive visualization, combining both statistical and actionable information to aid decision-making.
🞘 Code extract // Reset consecutive_bars when price crosses the mean
var consecutive_bars = 0
if (close < mu and close >= mu) or (close > mu and close <= mu)
consecutive_bars := 0
else if math.abs(deviation) > 0
consecutive_bars := math.min(consecutive_bars + 1, dev_length)
transparency = math.max(0, math.min(100, 100 - (consecutive_bars * 100 / dev_length)))
🔶 INSTRUCTIONS
The Mean Reversion Cloud (Ornstein-Uhlenbeck) indicator can be set up by adding it to your TradingView chart and configuring parameters such as the decay factor, autocorrelation length, and volatility threshold to suit current market conditions. Look for price crossovers and deviations from the calculated mean for potential entry signals. Use the upper and lower bands as dynamic support/resistance levels for setting take profit and stop-loss orders. Combining this indicator with additional trend-following or momentum-based indicators can improve signal accuracy. Adjust settings for better mean-reversion detection and risk management.
🔸Step-by-Step Guidelines
🞘 Setting Up the Indicator
Adding the Indicator to the Chart:
Go to your TradingView chart.
Click on the "Indicators" button at the top.
Search for "Mean Reversion Cloud (Ornstein-Uhlenbeck)" in the indicators list.
Click on the indicator to add it to your chart.
Configuring the Indicator:
Open the indicator settings by clicking on the gear icon next to its name on the chart.
Decay Factor: Adjust the decay factor (λ) to control the responsiveness of the mean calculation. A higher value prioritizes recent data.
Autocorrelation Length: Set the autocorrelation length (θ) for calculating the speed of mean reversion. Longer lengths consider more historical data.
Threshold: Define the number of standard deviations for the upper and lower bands to determine how far price must deviate to trigger a signal.
Chart Setup:
Select the appropriate timeframe (e.g., 1-hour, daily) based on your trading strategy.
Consider using other indicators such as RSI or MACD to confirm buy and sell signals.
🞘 Understanding What to Look For on the Chart
Indicator Behavior:
Observe how the price interacts with the dynamic mean and volatility bands. The price staying within the bands suggests mean-reverting behavior, while crossing the bands signals potential entry points.
The indicator calculates overbought/oversold conditions based on deviation from the mean, highlighted by color-coded cloud areas on the chart.
Crossovers and Deviation:
Look for crossovers between the price and the mean (μ) or the bands. A bullish crossover occurs when the price crosses below the lower band, signaling a potential buying opportunity.
A bearish crossover occurs when the price crosses above the upper band, suggesting a potential sell signal.
Deviations from the mean indicate market extremes. A large deviation indicates that the price is far from the mean, suggesting a potential reversal.
Slope and Direction:
Pay attention to the slope of the mean (μ). A rising slope suggests bullish market conditions, while a declining slope signals a bearish market.
The steepness of the slope can indicate the strength of the mean-reversion trend.
🞘 Possible Entry Signals
Bullish Entry:
Crossover Entry: Enter a long position when the price crosses below the lower band with a positive deviation from the mean.
Confirmation Entry: Use additional indicators like RSI (above 50) or increasing volume to confirm the bullish signal.
Bearish Entry:
Crossover Entry: Enter a short position when the price crosses above the upper band with a negative deviation from the mean.
Confirmation Entry: Look for RSI (below 50) or decreasing volume to confirm the bearish signal.
Deviation Confirmation:
Enter trades when the deviation from the mean is significant, indicating that the price has strayed far from its expected value and is likely to revert.
🞘 Possible Take Profit Strategies
Static Take Profit Levels:
Set predefined take profit levels based on historical volatility, using the upper and lower bands as guides.
Place take profit orders near recent support/resistance levels, ensuring you're capitalizing on the mean-reversion behavior.
Trailing Stop Loss:
Use a trailing stop based on a percentage of the price deviation from the mean to lock in profits as the trend progresses.
Adjust the trailing stop dynamically along the calculated bands to protect profits as the price returns to the mean.
Deviation-Based Exits:
Exit when the deviation from the mean starts to decrease, signaling that the price is returning to its equilibrium.
🞘 Possible Stop-Loss Levels
Initial Stop Loss:
Place an initial stop loss outside the lower band (for long positions) or above the upper band (for short positions) to protect against excessive deviations.
Use a volatility-based buffer to avoid getting stopped out during normal price fluctuations.
Dynamic Stop Loss:
Move the stop loss closer to the mean as the price converges back towards equilibrium, reducing risk.
Adjust the stop loss dynamically along the bands to account for sudden market movements.
🞘 Additional Tips
Combine with Other Indicators:
Enhance your strategy by combining the Mean Reversion Cloud with momentum indicators like MACD, RSI, or Bollinger Bands to confirm market conditions.
Backtesting and Practice:
Backtest the indicator on historical data to understand how it performs in various market environments.
Practice using the indicator on a demo account before implementing it in live trading.
Market Awareness:
Keep an eye on market news and events that might cause extreme price movements. The indicator reacts to price data and might not account for news-driven events that can cause large deviations.
🔸Customize settings 🞘 Decay Factor (λ): Defines the weight assigned to recent price data in the calculation of the mean. A value closer to 1 places more emphasis on recent prices, while lower values create a smoother, more lagging mean.
🞘 Autocorrelation Length (θ): Sets the period for calculating the speed of mean reversion and volatility. Longer lengths capture more historical data, providing smoother calculations, while shorter lengths make the indicator more responsive.
🞘 Threshold (σ): Specifies the number of standard deviations used to create the upper and lower bands. Higher thresholds widen the bands, producing fewer signals, while lower thresholds tighten the bands for more frequent signals.
🞘 Max Gradient Length (γ): Determines the maximum number of consecutive bars for calculating the deviation gradient. This setting impacts the transparency of the plotted bands based on the length of deviation from the mean.
🔶 CONCLUSION
The Mean Reversion Cloud (Ornstein-Uhlenbeck) indicator offers a sophisticated approach to identifying mean-reversion opportunities by applying the Ornstein-Uhlenbeck stochastic process. This dynamic indicator calculates a responsive mean using an Exponentially Weighted Moving Average (EWMA) and plots volatility-based bands to highlight overbought and oversold conditions. By incorporating advanced statistical measures like autocorrelation and standard deviation, traders can better assess market extremes and potential reversals. The indicator’s ability to adapt to price behavior makes it a versatile tool for traders focused on both short-term price deviations and longer-term mean-reversion strategies. With its unique blend of statistical rigor and visual clarity, the Mean Reversion Cloud provides an invaluable tool for understanding and capitalizing on market inefficiencies.
Pesquisar nos scripts por "stop loss"

Market Structure Break Targets [UAlgo]The "Market Structure Break Targets " indicator is designed to identify and visualize key market structure points such as Market Structure Breaks (MSBs) and Break of Structures (BoS). These points are crucial for understanding market trends and potential reversal zones. By plotting these structures on the chart, traders can easily spot significant support and resistance levels, as well as potential entry and exit points.
This indicator uses a combination of swing highs and lows to determine market structures and calculates targets based on user-defined percentages or Average True Range (ATR) multipliers. It provides visual cues in the form of lines, labels, and boxes to help traders quickly interpret market conditions.
🔶 Key Features
Customizable Swing Length: Users can set the swing length to identify the pivot highs and lows, which are crucial for determining market structure.
Target Duration Bars: Defines the maximum duration (in bars) for which the targets will be considered valid.
Target Calculation Methods: The target levels are crucial for setting potential price objectives. The calculation can be based on a percentage move from the identified pivot or using the ATR to factor in market volatility. These targets help in setting realistic profit-taking levels or identifying stop-loss placements.
Bullish and Bearish Market Structure Break (MSB): Detects and highlights bullish and bearish market structure breaks with customizable colors and target percentages.
Bullish MSB
When the price closes above a significant pivot high, a bullish MSB is identified. The indicator will draw a line at this level and calculate a target based on the chosen method (percentage or ATR). The target is visualized with a dotted line, and a label "MSB" is displayed. Additionally, an order block is created at the level of the bullish MSB. This order block is highlighted with a semi-transparent box, representing a potential area where price might find support in the future.
Bearish MSB
Conversely, when the price closes below a significant pivot low, a bearish MSB is marked. Similar to bullish MSBs, targets are calculated and displayed on the chart. An order block is also generated at the level of the bearish MSB, visualized with a semi-transparent box. This box highlights a potential resistance area where price might face selling pressure.
Bullish and Bearish Break of Structure (BoS): Identifies break of structures for both bullish and bearish scenarios, providing additional target levels.
Bullish BoS
If the price continues to rise and breaks another significant level, a bullish BoS is detected. This break is also marked with lines and labels, providing additional target levels for traders. An order block is created at the BoS level, serving as a potential support zone.
Bearish BoS
If the price falls further after a bearish MSB, a bearish BoS is identified and visualized similarly. The indicator creates an order block at the BoS level, which acts as a potential resistance zone.
🔶 Disclaimer:
Use with Caution: This indicator is provided for educational and informational purposes only and should not be considered as financial advice. Users should exercise caution and perform their own analysis before making trading decisions based on the indicator's signals.
Not Financial Advice: The information provided by this indicator does not constitute financial advice, and the creator (UAlgo) shall not be held responsible for any trading losses incurred as a result of using this indicator.
Backtesting Recommended: Traders are encouraged to backtest the indicator thoroughly on historical data before using it in live trading to assess its performance and suitability for their trading strategies.
Risk Management: Trading involves inherent risks, and users should implement proper risk management strategies, including but not limited to stop-loss orders and position sizing, to mitigate potential losses.
No Guarantees: The accuracy and reliability of the indicator's signals cannot be guaranteed, as they are based on historical price data and past performance may not be indicative of future results.

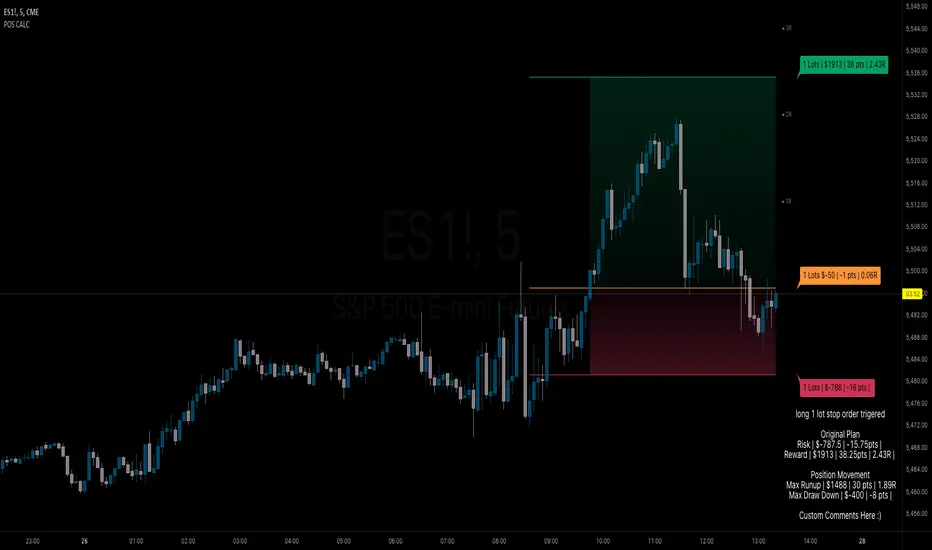
BB Position CalculatorPosition Size Calculator Instructions
Overview
The Position Size Calculator is designed to help traders automatically determine the appropriate lot size based on the dollar amount they are willing to risk. It includes features for automatic lot sizing, fixed lot risk calculations, take profit calculations (both automatic and fixed), max run-up, and max drawdown. Calculated values are displayed in ticks, points, and USD.
Key Features
• Automatic Lot Sizing: Automatically calculates lot size based on the amount of money you are willing to risk.
• Fixed Lot Risk Calculations: Provides risk calculations for fixed lot sizes.
• Take Profit Calculations: Offers both automatic and fixed take profit calculations.
• Max Run-Up and Max Drawdown: Monitors and displays the maximum run-up and drawdown of your trade.
• Detailed Metrics: Displays all calculated values in ticks, points, and USD.
Setup Instructions
1. Add and Remove for Each Position: The calculator is designed to be added to your chart for each new position. Once your preferences are set the first time, save them as your default to retain your settings for future use.
2. Adding the Indicator to Favorites:
• Use the TradingView keyboard shortcut “/” then type “pos.”
• Use the arrow key to select the Position Size Calculator and press enter.
• Close the indicator selection pop-up.
3. Setting the Trigger Price:
• A blue pop-up labeled “SET TRIGGER PRICE” will appear at the bottom of the chart.
• Click on the chart at the price level where you want to enter the trade.
4. Setting the Stop Loss:
• The pop-up will change to “SET STOP LOSS.”
• Click on the chart at the price level where your stop loss will be set.
5. Setting the Take Profit:
• The pop-up will change to “SET TAKE PROFIT.”
• Click on the chart at the price level where you want to take profit. If you have selected the option to overwrite with a set risk/reward ratio (R:R), the calculation will use this price level.
6. Setting the Trade Window Start:
• The pop-up will change to “SET TRADE WINDOW START.”
• Click on the bar in time where you want the indicator to start monitoring for price to trigger the position.
7. Adjusting the Position:
• Clicking on any part of the indicator will display draggable lines, allowing you to fine-tune the position that was previously plotted by the first four chart clicks.
Additional Notes
• Compatibility: This calculator has only been tested with futures trading.
• Customization: Once your preferences are set, save them as your default to make setup quicker for future trades.
• Support: If you have any questions or feature requests, please feel free to reach out.
ICT Concept [TradingFinder] Order Block | FVG | Liquidity Sweeps🔵 Introduction
The "ICT" style is one of the subsets of "Price Action" technical analysis. ICT is a method created by "Michael Huddleston", a professional forex trader and experienced mentor. The acronym ICT stands for "Inner Circle Trader".
The main objective of the ICT trading strategy is to combine "Price Action" and the concept of "Smart Money" to identify optimal entry points into trades. However, finding suitable entry points is not the only strength of this approach. With the ICT style, traders can better understand price behavior and adapt their trading approach to market structure accordingly.
Numerous concepts are discussed in this style, but the key practical concepts for trading in financial markets include "Order Block," "Liquidity," and "FVG".
🔵 How to Use
🟣Order Block
Order blocks are a specific type of "Supply and Demand" zones formed when a series of orders are placed in a block. These orders could be created by banks or other major players. Banks typically execute large orders in blocks during their trading sessions. If they were to enter the market directly with a small quantity, significant price movements would occur before the orders are fully executed, resulting in less profit. To avoid this, they divide their orders into smaller, manageable positions. Traders should look for "buy" opportunities in "demand order blocks" areas and "sell" opportunities in "supply order blocks".
🟣Liquidity
These levels are where traders aim to exit their trades. "Market Makers" or smart money usually collects or distributes their trading positions near levels where many retail traders have placed their "Stop Loss" orders. When the liquidity resulting from these losses is collected, the price often reverses direction.
A "Stop Hunt" is a move designed to neutralize liquidity generated by triggered stop losses. Banks often use significant news events to trigger stop hunts and acquire the liquidity released in the market. If, for example, they intend to execute heavy buy orders, they encourage others to sell through stop hunts.
As a result, if there is liquidity in the market before reaching the order block region, the credibility of that order block is higher. Conversely, if liquidity is near the order block, meaning the price reaches the order block before reaching the liquidity area, the credibility of that order block is lower.
🟣FVG (Fair Value Gap)
To identify the "Fair Value Gap" on the chart, one must analyze candle by candle. Focus on candles with large bodies, examining one candle and the one before it. The candles before and after this central candle should have long shadows, and their bodies should not overlap with the body of the central candle. The distance between the shadows of the first and third candles is called the FVG range.
These zone function in two ways :
•Supply and Demand zone: In this case, the price reacts to these zone, and its trend reverses.
•Liquidity zone: In this scenario, the price "fills" the zone and then reaches the order block.
Important Note: In most cases, FVG zone with very small width act as supply and demand zone, while zone with a significant width act as liquidity zone, absorbing the price.
🔵 Setting
🟣Order Block
Refine Order Block : When the option for refining order blocks is Off, the supply and demand zones encompass the entire length of the order block (from Low to High) in their standard state and remain unaltered. On the option for refining order blocks triggers the improvement of supply and demand zones using the error correction algorithm.
Refine Type : The enhancement of order blocks via the error correction algorithm can be executed through two methods: Defensive and Aggressive. In the Aggressive approach, the widest possible range is taken into account for order blocks.
Show High Levels : If major high levels are to be displayed, set the option for showing high level to Yes.
Show Low Levels : If major low levels are to be displayed, set the option for showing low level to Yes.
Show Last Support : If showing the last support is desired, set the option for showing last support to Yes.
Show Last Resistance : If showing the last resistance is desired, set the option for showing last resistance to Yes.
🟣 FVG
FVG Filter : When FVG filtering is activated, the number of FVG areas undergoes filtration based on the specified algorithm.
FVG Filter Types :
1. Very Aggressive : Apart from the initial condition, an additional condition is introduced. For an upward FVG, the maximum price of the last candle should exceed the maximum price of the middle candle. Similarly, for a downward FVG, the minimum price of the last candle should be lower than the minimum price of the middle candle. This mode eliminates a minimal number of FVGs.
2. Aggressive : In addition to the conditions of the Very Aggressive mode, this mode considers the size of the middle candle; it should not be small. Consequently, a larger number of FVGs are eliminated in this mode.
3. Defensive : Alongside the conditions of the Very Aggressive mode, this mode takes into account the size of the middle candle, which should be relatively large with the majority of it comprising the body. Furthermore, to identify upward FVGs, the second and third candles must be positive, whereas for downward FVGs, the second and third candles must be negative. This mode filters out a considerable number of FVGs, retaining only those of suitable quality.
4. Very Defensive : In addition to the conditions of the Defensive mode, the first and third candles should not be very small-bodied doji candles. This mode filters out the majority of FVGs, leaving only the highest quality ones. Show Demand FVG: Enables the display of demand-related boxes, which can be toggled between off and on. Show Supply FVG: Enables the display of supply-related boxes along the path, which can also be toggled between off and on.
🟣 Liquidity
Statics Liquidity Line Sensitivity : A value ranging from 0 to 0.4. Increasing this value reduces the sensitivity of the "Statics Liquidity Line Detection" function and increases the number of identified lines. The default value is 0.3.
Dynamics Liquidity Line Sensitivity : A value ranging from 0.4 to 1.95. Increasing this value enhances the sensitivity of the "Dynamics Liquidity Line Detection" function and decreases the number of identified lines. The default value is 1.
Statics Period Pivot : Default value is set to 8. By adjusting this value, you can specify the period for static liquidity line pivots.
Dynamics Period Pivot : Default value is set to 3. By adjusting this value, you can specify the period for dynamic liquidity line pivots.
You can activate or deactivate liquidity lines as necessary using the buttons labeled "Show Statics High Liquidity Line," "Show Statics Low Liquidity Line," "Show Dynamics High Liquidity Line," and "Show Dynamics Low Liquidity Line".

Force DashboardScalping Dashboard - Complete User Guide
Overview
This scalping system consists of two complementary TradingView indicators designed for intraday trading with no overnight holds:
Force Dashboard - Single-row table showing real-time market bias and entry signals
Large Order Detection - Visual diamonds showing institutional order flow
Together, they provide a complete at-a-glance view of market conditions optimized for quick entries and exits.
Recommended Timeframes
Primary Scalping Timeframes
1-minute chart: Ultra-fast scalps (30 seconds - 3 minutes hold time)
2-minute chart: Quick scalps (2-5 minutes hold time)
5-minute chart: Standard scalps (5-15 minutes hold time)
Best Practices
Use 1-2 minute for highly liquid instruments (ES, NQ, major forex pairs)
Use 5-minute for less liquid markets or if you prefer fewer signals
Never hold past the last hour of trading to avoid overnight risk
Set hard stop times (e.g., exit all positions by 3:45 PM EST)
Dashboard Components Explained
Core Indicators (Circles ●)
MACD (5/13/5)
Green ● = Bullish momentum (MACD histogram positive)
Red ● = Bearish momentum (MACD histogram negative)
Gray ● = No clear momentum
Use: Confirms trend direction and momentum shifts
EMA (9/20/50)
Green ● = Price > EMA9 > EMA20 (uptrend)
Red ● = Price < EMA9 < EMA20 (downtrend)
Gray ● = Choppy/sideways
Use: Identifies the immediate micro-trend
Stoch (5-period Stochastic)
Green ● = Oversold (<20) - potential reversal up
Red ● = Overbought (>80) - potential reversal down
Gray ● = Neutral zone (20-80)
Use: Spots reversal opportunities at extremes
RSI (7-period)
Green ● = Oversold (<30)
Red ● = Overbought (>70)
Gray ● = Neutral
Use: Confirms overbought/oversold conditions
CVD (Cumulative Volume Delta)
Green ● = CVD above its moving average (buying pressure)
Red ● = CVD below its moving average (selling pressure)
Gray ● = Neutral
Use: Shows overall buying vs selling pressure
ΔCVD (Delta CVD - Rate of Change)
Green ● = CVD accelerating upward (buying acceleration)
Red ● = CVD accelerating downward (selling acceleration)
Gray ● = No acceleration
Use: Detects momentum shifts in order flow
Imbal (Order Flow Imbalance)
Green ● = Buy pressure >2x sell pressure
Red ● = Sell pressure >2x buy pressure
Gray ● = Balanced
Use: Identifies extreme one-sided order flow
Vol (Volume Strength)
Green ● = Volume >1.5x average (strong interest)
Red ● = Volume <0.7x average (low interest)
Gray ● = Normal volume
Yellow background = Volume surge (>2x average) - BIG MOVE ALERT
Use: Confirms conviction behind price moves
Tape (Tape Speed)
Green ● = Fast order flow (>1.3x normal)
Red ● = Slow order flow (<0.7x normal)
Gray ● = Normal speed
Yellow background = Very fast tape (>1.5x) - RAPID EXECUTION ALERT
Use: Measures urgency and speed of orders
Key Levels
Support (Supp)
Shows the nearest high-volume support level below current price
Bright Green background = Price is AT support (within 0.3%) - BOUNCE ZONE
Green background = Price above support (healthy)
Red background = Price below support (broken support, now resistance)
Resistance (Res)
Shows the nearest high-volume resistance level above current price
Bright Orange background = Price is AT resistance (within 0.3%) - REJECTION ZONE
Red background = Price below resistance (facing overhead supply)
Green background = Price above resistance (breakout)
These levels update automatically every 3 bars based on volume profile
Entry Signal Components
Score
Displays format: "6L" (6 long indicators) or "4S" (4 short indicators)
Bright Green = 6-7 indicators aligned for long
Light Green = 5 indicators aligned for long
Yellow = 4 indicators aligned (weaker setup)
Gray = No alignment
Red/Orange colors = Same scale for short setups
Score of 5+ indicates high-probability setup
SCALP (Main Entry Signal)
BRIGHT GREEN "LONG" = High-quality long scalp (Score 5+)
Green "LONG" = Decent long scalp (Score 4)
BRIGHT ORANGE "SHORT" = High-quality short scalp (Score 5+)
Red "SHORT" = Decent short scalp (Score 4)
Gray "WAIT" = No clear setup - STAY OUT
Entry Strategies
Strategy 1: High-Probability Scalps (Conservative)
When to Enter:
SCALP column shows BRIGHT GREEN "LONG" or BRIGHT ORANGE "SHORT"
Score is 5 or higher
Vol or Tape has yellow background (volume surge)
Example Long Setup:
SCALP = BRIGHT GREEN "LONG"
Score = 6L
Vol = Yellow background
Price AT Support (bright green Supp cell)
EMA, MACD, CVD, ΔCVD, Imbal all green
Entry: Enter immediately on next candle
Target: 0.5-1% move or resistance level
Stop: Below support or -0.3%
Hold Time: 2-10 minutes
Strategy 2: Momentum Scalps (Aggressive)
When to Enter:
Tape has yellow background (fast tape)
Vol has yellow background (volume surge)
ΔCVD is green (for longs) or red (for shorts)
Imbal shows strong imbalance in your direction
Score is 4+
Example Short Setup:
Tape & Vol = Yellow backgrounds
ΔCVD = Red, Imbal = Red
Price AT Resistance (bright orange)
Score = 5S
Entry: Enter immediately
Target: Quick 0.3-0.7% move
Stop: Tight -0.2%
Hold Time: 1-5 minutes
Strategy 3: Reversal Scalps (Mean Reversion)
When to Enter:
Stoch shows oversold (green) or overbought (red)
RSI confirms the extreme
Price is AT Support (for longs) or AT Resistance (for shorts)
ΔCVD and Imbal start reversing direction
Score is 4+
Example Long Setup:
Stoch = Green (oversold)
RSI = Green (oversold)
Supp = Bright green (at support)
ΔCVD turns green
Imbal turns green
Score = 4L or 5L
Entry: Wait for confirmation candle
Target: Move back to EMA9 or mid-range
Stop: Below the low
Hold Time: 3-8 minutes
Large Order Detection Usage
Diamond Signals
Green diamonds below bar = Large buy orders (institutional buying)
Red diamonds above bar = Large sell orders (institutional selling)
Size matters: Larger diamonds = larger order flow
How to Use with Dashboard
Confirmation Entries
Dashboard shows "LONG" signal
Green diamond appears
Enter immediately - institutions are buying
Divergence Alerts (CAUTION)
Dashboard shows "LONG" signal
RED diamond appears (institutions selling)
DO NOT ENTER - conflicting order flow
Cluster Patterns
Multiple green diamonds in row = Strong accumulation, stay long
Multiple red diamonds in row = Strong distribution, stay short
Alternating colors = Chop, avoid trading
Risk Management Rules
Position Sizing
Risk 0.5-1% of account per scalp
Maximum 3 concurrent positions
Reduce size after 2 consecutive losses
Stop Loss Guidelines
Tight stops: 0.2-0.3% for 1-2 min charts
Standard stops: 0.3-0.5% for 5 min charts
Always use stop loss - no exceptions
Place stops below support (longs) or above resistance (shorts)
Take Profit Targets
Target 1: 0.3-0.5% (take 50% off)
Target 2: 0.7-1% (take remaining 50%)
Move stop to breakeven after Target 1 hit
Trail stop if Score remains high
Time-Based Exits
Exit immediately if:
SCALP changes from LONG/SHORT to WAIT
Score drops below 3
Large diamond appears in opposite direction
Maximum hold time: 15 minutes (even if profitable)
Hard exit time: 30 minutes before market close
Trading Sessions
Best Times to Scalp
High-Liquidity Sessions
9:30-11:00 AM EST (Market open, highest volume)
2:00-3:30 PM EST (Afternoon session, good moves)
Avoid
11:30 AM-1:30 PM EST (Lunch, low volume)
Last 30 minutes (unpredictable, don't initiate new trades)
News releases (wait 5 minutes for volatility to settle)
Common Patterns & Setups
The Perfect Storm (Highest Probability)
Score = 6L or 7L
SCALP = BRIGHT GREEN
Vol + Tape = Yellow backgrounds
Green diamond appears
Price AT Support
Win rate: ~70-80%
The Fade Setup (Counter-Trend)
Price hits resistance (bright orange)
Stoch + RSI overbought (red)
Red diamond appears
CVD starts turning red
SCALP shows "SHORT"
Win rate: ~60-70%
The Breakout Continuation
Price breaks resistance (Res turns green)
EMA, MACD green
Vol surge (yellow)
Multiple green diamonds
SCALP = "LONG"
Win rate: ~65-75%
Warning Signs - DO NOT TRADE
Red Flags
❌ SCALP shows "WAIT"
❌ Score below 3
❌ Vol and Tape both gray (no volume)
❌ Conflicting signals (dashboard says LONG but red diamonds appearing)
❌ Alternating green/red circles (choppy market)
❌ Support and Resistance very close together (tight range)
Market Conditions to Avoid
Low volume periods
Major news releases (first 5 minutes after)
First 2 minutes after market open
Wide spreads
Consecutive losing trades (take a break after 2 losses)
Quick Reference Checklist
Before Taking ANY Trade:
☑ SCALP shows LONG or SHORT (not WAIT)
☑ Score is 4 or higher
☑ Vol or Tape shows activity
☑ No conflicting diamond signals
☑ Stop loss level identified
☑ Target profit level identified
☑ Not in restricted time periods
After Entering:
☑ Set stop loss immediately
☑ Set profit targets
☑ Watch SCALP column - exit if changes to WAIT
☑ Watch for opposite-colored diamonds
☑ Move stop to breakeven after first target
☑ Exit all by market close
Advanced Tips
Scalping Psychology
Be patient: Wait for Score 5+ setups
Be decisive: When signal appears, act immediately
Be disciplined: Follow your stop loss always
Be flexible: Exit quickly if dashboard reverses
Optimization
Backtest on your specific instrument
Adjust RSI/Stoch levels for your market
Fine-tune volume thresholds
Keep a trade journal to track which setups work best
Multi-Timeframe Confirmation
Use 5-min dashboard as "trend filter"
Take 1-min trades only in direction of 5-min SCALP signal
Increases win rate by ~10-15%
Troubleshooting
Q: Dashboard shows WAIT most of the time
Normal - scalping is about patience. Quality > Quantity
3-8 good setups per day is excellent
Q: Too many false signals
Increase minimum Score requirement to 5 or 6
Only trade with volume surge (yellow backgrounds)
Add large order detection confirmation
Q: Signals too slow
You may be on too high a timeframe
Try 1-minute chart for faster signals
Ensure real-time data feed is active
Q: Support/Resistance not updating
Normal - updates every 3 bars
If completely stuck, remove and re-add indicator
Summary
This scalping system works best when:
✅ Multiple indicators align (Score 5+)
✅ Volume and tape speed confirm the move
✅ Order flow (diamonds) confirms direction
✅ Price is at key levels (support/resistance)
✅ You manage risk strictly
✅ You exit before market close
The golden rule: When SCALP says WAIT, you WAIT. Discipline beats frequency.

chart Pattern & Candle sticks Strategy# **XAUUSD Pattern & Candle Strategy - Complete Description**
## **Overview**
This Pine Script indicator is a comprehensive multi-factor trading system specifically designed for **XAUUSD (Gold) scalping and swing trading**. It combines classical technical analysis methods including candlestick patterns, chart patterns, moving averages, and volume analysis to generate high-probability buy/sell signals with automatic stop-loss and take-profit levels.
***
## **Core Components**
### **1. Moving Average System (Triple MA)**
**Purpose:** Identifies trend direction and momentum
- **Fast MA (20-period)** - Short-term price action
- **Medium MA (50-period)** - Intermediate trend
- **Slow MA (200-period)** - Long-term trend direction
**How it works:**
- **Bullish alignment**: MA20 > MA50 > MA200 (all pointing up)
- **Bearish alignment**: MA20 < MA50 < MA200 (all pointing down)
- **Crossover signals**: When Fast MA crosses Medium MA, it triggers buy/sell signals
- **Choice of SMA or EMA**: Adjustable based on preference
**Visual indicators:**
- Blue line = Fast MA
- Orange line = Medium MA
- Light red line = Slow MA
- Green background tint = Bullish trend
- Red background tint = Bearish trend
---
### **2. Candlestick Pattern Recognition (13 Patterns)**
**Purpose:** Identifies reversal and continuation signals based on price action
#### **Bullish Patterns (Signal potential upward moves):**
1. **Hammer** 🔨
- Long lower wick (2x body size)
- Small body at top
- Indicates rejection of lower prices (buyers stepping in)
- Best at support levels
2. **Inverted Hammer**
- Long upper wick
- Small body at bottom
- Shows buying pressure despite initial selling
3. **Bullish Engulfing** 📈
- Green candle completely engulfs previous red candle
- Strong reversal signal
- Body must be 1.2x larger than previous
4. **Morning Star** ⭐
- 3-candle pattern
- Red candle → Small indecision candle → Large green candle
- Powerful reversal at bottoms
5. **Piercing Line** ⚡
- Green candle closes above 50% of previous red candle
- Indicates strong buying interest
6. **Bullish Marubozu**
- Almost no wicks (95% body)
- Very strong bullish momentum
- Body must be 1.3x average size
#### **Bearish Patterns (Signal potential downward moves):**
7. **Shooting Star** 💫
- Long upper wick
- Small body at bottom
- Indicates rejection of higher prices (sellers in control)
- Best at resistance levels
8. **Hanging Man**
- Similar to hammer but appears at top
- Warning of potential reversal down
9. **Bearish Engulfing** 📉
- Red candle completely engulfs previous green candle
- Strong reversal signal
10. **Evening Star** 🌙
- 3-candle pattern (opposite of Morning Star)
- Green → Small → Large red candle
- Powerful top reversal
11. **Dark Cloud Cover** ☁️
- Red candle closes below 50% of previous green candle
- Indicates strong selling pressure
12. **Bearish Marubozu**
- Almost no wicks, pure red body
- Very strong bearish momentum
#### **Neutral Pattern:**
13. **Doji**
- Open and close nearly equal (tiny body)
- Indicates indecision
- Often precedes major moves
**Detection Logic:**
- Compares body size, wick ratios, and position relative to previous candles
- Uses 14-period average body size as reference
- All patterns validated against volume confirmation
***
### **3. Chart Pattern Recognition**
**Purpose:** Identifies major support/resistance and reversal patterns
#### **Patterns Detected:**
**Double Bottom** 📊 (Bullish)
- Two lows at approximately same level
- Indicates strong support
- Breakout above neckline triggers buy signal
- Most reliable at major support zones
**Double Top** 📊 (Bearish)
- Two highs at approximately same level
- Indicates strong resistance
- Breakdown below neckline triggers sell signal
- Most reliable at major resistance zones
**Support & Resistance Levels**
- Automatically plots recent pivot highs (resistance)
- Automatically plots recent pivot lows (support)
- Uses 3-bar strength for validation
- Levels shown as dashed horizontal lines
**Price Action Patterns**
- **Uptrend detection**: Higher highs + higher lows
- **Downtrend detection**: Lower highs + lower lows
- Confirms overall market structure
***
### **4. Volume Analysis**
**Purpose:** Confirms signal strength and filters false signals
**Metrics tracked:**
- **Volume MA (20-period)**: Baseline average volume
- **High volume threshold**: 1.5x the volume average
- **Volume increase**: Current volume > previous 2 bars
**How it's used:**
- All buy/sell signals **require volume confirmation**
- High volume = institutional participation
- Low volume signals are filtered out
- Prevents whipsaw trades during quiet periods
**Visual indicator:**
- Dashboard shows "High" volume in orange when active
- "Normal" shown in gray during low volume
***
### **5. Signal Generation Logic**
**BUY SIGNALS triggered when ANY of these occur:**
1. **Candlestick + Volume**
- Bullish candle pattern detected
- High volume confirmation
- Price above Fast MA
2. **MA Crossover + Volume**
- Fast MA crosses above Medium MA
- High volume confirmation
3. **Double Bottom Breakout**
- Price breaks above support level
- Volume confirmation present
4. **Trend Continuation**
- Uptrend structure intact (higher highs/lows)
- All MAs in bullish alignment
- Price above Fast MA
- Volume confirmation
**SELL SIGNALS triggered when ANY of these occur:**
1. **Candlestick + Volume**
- Bearish candle pattern detected
- High volume confirmation
- Price below Fast MA
2. **MA Crossunder + Volume**
- Fast MA crosses below Medium MA
- High volume confirmation
3. **Double Top Breakdown**
- Price breaks below resistance level
- Volume confirmation present
4. **Trend Continuation**
- Downtrend structure intact (lower highs/lows)
- All MAs in bearish alignment
- Price below Fast MA
- Volume confirmation
***
### **6. Risk Management System**
**Automatic Stop Loss Calculation:**
- Based on ATR (Average True Range) - 14 periods
- **Formula**: Entry price ± (ATR × SL Multiplier)
- **Default multiplier**: 1.5 (adjustable)
- Adapts to market volatility automatically
**Automatic Take Profit Calculation:**
- **Formula**: Entry price ± (ATR × TP Multiplier)
- **Default multiplier**: 2.5 (adjustable)
- **Default Risk:Reward ratio**: 1:1.67
- Higher TP multiplier = more aggressive targets
**Position Management:**
- Tracks ONE position at a time (no pyramiding)
- Automatically closes position when:
- Stop loss is hit
- Take profit is reached
- Opposite MA crossover occurs
- Prevents revenge trading and over-leveraging
**Visual Representation:**
- **Red horizontal line** = Stop Loss level
- **Green horizontal line** = Take Profit level
- Lines remain on chart while position is active
- Automatically disappear when position closes
***
### **7. Visual Elements**
**On-Chart Displays:**
1. **Moving Average Lines**
- Fast MA (Blue, thick)
- Medium MA (Orange, thick)
- Slow MA (Red, thin)
2. **Support/Resistance**
- Green crosses = Support levels
- Red crosses = Resistance levels
3. **Buy/Sell Arrows**
- Large GREEN "BUY" label below bars
- Large RED "SELL" label above bars
4. **Pattern Labels** (Small markers)
- "Hammer", "Bull Engulf", "Morning Star" (green, below bars)
- "Shooting Star", "Bear Engulf", "Evening Star" (red, above bars)
- "Double Bottom" / "Double Top" (blue/orange)
5. **Signal Detail Labels** (Medium size)
- Shows signal reason (e.g., "Bullish Candle", "MA Cross Up")
- Displays Entry, SL, and TP prices
- Color-coded (green for long, red for short)
6. **Background Coloring**
- Light green tint = Bullish MA alignment
- Light red tint = Bearish MA alignment
***
### **8. Information Dashboard**
**Top-right corner table showing:**
| Metric | Description |
|--------|-------------|
| **Position** | Current trade status (LONG/SHORT/None) |
| **MA Trend** | Overall trend direction (Bullish/Bearish/Neutral) |
| **Volume** | Current volume status (High/Normal) |
| **Pattern** | Last detected candlestick pattern |
| **ATR** | Current volatility measurement |
**Purpose:**
- Quick at-a-glance market assessment
- Real-time position tracking
- No need to check multiple indicators
***
### **9. Alert System**
**Complete alert coverage for:**
✅ **Entry Alerts**
- "Buy Signal" - Triggers when buy conditions met
- "Sell Signal" - Triggers when sell conditions met
✅ **Exit Alerts**
- "Long TP Hit" - Take profit reached on long position
- "Long SL Hit" - Stop loss triggered on long position
- "Short TP Hit" - Take profit reached on short position
- "Short SL Hit" - Stop loss triggered on short position
**How to use:**
1. Click "Create Alert" button
2. Select desired alert from dropdown
3. Set notification method (popup, email, SMS, webhook)
4. Never miss a trade opportunity
***
## **Recommended Settings**
### **For Scalping (Quick trades):**
- **Timeframe**: 5-minute
- **Fast MA**: 9
- **Medium MA**: 21
- **Slow MA**: 50
- **SL Multiplier**: 1.0
- **TP Multiplier**: 2.0
- **Volume Threshold**: 1.5x
### **For Swing Trading (Longer holds):**
- **Timeframe**: 1-hour or 4-hour
- **Fast MA**: 20
- **Medium MA**: 50
- **Slow MA**: 200
- **SL Multiplier**: 2.0
- **TP Multiplier**: 3.0
- **Volume Threshold**: 1.3x
### **Best Trading Hours for XAUUSD:**
- **Asian Session**: 00:00 - 08:00 GMT (lower volatility)
- **London Session**: 08:00 - 16:00 GMT (high volatility) ⭐
- **New York Session**: 13:00 - 21:00 GMT (highest volume) ⭐
- **London-NY Overlap**: 13:00 - 16:00 GMT (BEST for scalping) 🔥
***
## **How to Use This Strategy**
### **Step 1: Setup**
1. Open TradingView
2. Load XAUUSD chart
3. Select timeframe (5m, 15m, 1H, or 4H)
4. Add indicator from Pine Editor
5. Adjust settings based on your trading style
### **Step 2: Wait for Signals**
- Watch for GREEN "BUY" or RED "SELL" labels
- Check the signal reason in the detail label
- Verify dashboard shows favorable conditions
- Confirm volume is "High" (not required but preferred)
### **Step 3: Enter Trade**
- Enter at market or limit order near signal price
- Note the displayed Entry, SL, and TP prices
- Set your broker's SL/TP to match indicator levels
### **Step 4: Manage Position**
- Watch for SL/TP lines on chart
- Monitor dashboard for trend changes
- Exit manually if opposite MA crossover occurs
- Let SL/TP do their job (don't move them!)
### **Step 5: Review & Learn**
- Track win rate over 20+ trades
- Adjust multipliers if needed
- Note which patterns work best for you
- Refine entry timing
***
## **Key Advantages**
✅ **Multi-confirmation approach** - Reduces false signals significantly
✅ **Automatic risk management** - No manual calculation needed
✅ **Adapts to volatility** - ATR-based SL/TP adjusts to market conditions
✅ **Volume filtered** - Ensures institutional participation
✅ **Visual clarity** - Easy to understand at a glance
✅ **Complete alert system** - Never miss opportunities
✅ **Pattern education** - Learn patterns as they appear
✅ **Works on all timeframes** - Scalping to swing trading
***
## **Limitations & Considerations**
⚠️ **Not a holy grail** - No strategy wins 100% of trades
⚠️ **Requires practice** - Demo trade first to understand signals
⚠️ **Market conditions matter** - Works best in trending or volatile markets
⚠️ **News events** - Avoid trading during major economic releases
⚠️ **Slippage on 5m** - Fast markets may have execution delays
⚠️ **Pattern subjectivity** - Some patterns may trigger differently than expected
***
## **Risk Management Rules**
1. **Never risk more than 1-2% per trade**
2. **Maximum 3 positions per day** (avoid overtrading)
3. **Don't trade during major news** (NFP, FOMC, etc.)
4. **Use proper position sizing** (0.01 lot per $100 for micro accounts)
5. **Keep trade journal** (track patterns, win rate, mistakes)
6. **Stop trading after 3 consecutive losses** (psychological reset)
7. **Don't move stop loss further away** (accept losses)
8. **Take partial profits** at 1:1 R:R if desired
***
## **Expected Performance**
**Realistic expectations:**
- **Win rate**: 50-65% (depending on market conditions and timeframe)
- **Risk:Reward**: 1:1.67 default (adjustable to 1:2 or 1:3)
- **Signals per day**: 3-8 on 5m, 1-3 on 1H
- **Best months**: High volatility periods (news events, economic uncertainty)
- **Drawdowns**: Expect 3-5 losing trades in a row occasionally
***
## **Customization Options**
All inputs are adjustable in settings panel:
**Moving Averages:**
- Type (SMA or EMA)
- All three period lengths
**Volume:**
- Volume MA length
- High volume multiplier threshold
**Chart Patterns:**
- Pattern strength (bars for pivot detection)
- Show/hide pattern labels
**Risk Management:**
- ATR period
- Stop loss multiplier
- Take profit multiplier
**Display:**
- Toggle pattern labels
- Customize colors (in code)
***
## **Conclusion**
This is a **professional-grade, multi-factor trading system** that combines the best of classical technical analysis with modern risk management. It's designed to give clear, actionable signals while automatically handling the complex calculations of stop loss and take profit levels.
**Best suited for traders who:**
- Understand basic technical analysis
- Can follow rules consistently
- Prefer systematic approach over gut feeling
- Want visual confirmation before entering trades
- Value proper risk management
**Start with demo trading** for at least 20-30 trades to understand how the signals work in different market conditions. Once comfortable and profitable on demo, transition to live trading with minimal risk per trade.
Happy trading! 📈🎯

Price Action Brooks ProPrice Action Brooks Pro (PABP) - Professional Trading Indicator
━━━━━━━━━━━━━━━━━━━━━━━━━━━━━━━━━━━━━━━━━━━━━━━━━━
📊 OVERVIEW
Price Action Brooks Pro (PABP) is a professional-grade TradingView indicator developed based on Al Brooks' Price Action trading methodology. It integrates decades of Al Brooks' trading experience and price action analysis techniques into a comprehensive technical analysis tool, helping traders accurately interpret market structure and identify trading opportunities.
• Applicable Markets: Stocks, Futures, Forex, Cryptocurrencies
• Timeframes: 1-minute to Daily (5-minute chart recommended)
• Theoretical Foundation: Al Brooks Price Action Trading Method
━━━━━━━━━━━━━━━━━━━━━━━━━━━━━━━━━━━━━━━━━━━━━━━━━━
🎯 CORE FEATURES
━━━━━━━━━━━━━━━━━━━━━━━━━━━━━━━━━━━━━━━━━━━━━━━━━━
1️⃣ INTELLIGENT GAP DETECTION SYSTEM
Automatically identifies and marks three critical types of gaps in the market.
TRADITIONAL GAP
• Detects complete price gaps between bars
• Upward gap: Current bar's low > Previous bar's high
• Downward gap: Current bar's high < Previous bar's low
• Hollow border design - doesn't obscure price action
• Color coding: Upward gaps (light green), Downward gaps (light pink)
• Adjustable border: 1-5 pixel width options
TAIL GAP
• Detects price gaps between bar wicks/shadows
• Analyzes across 3 bars for precision
• Identifies hidden market structure
BODY GAP
• Focuses only on gaps between bar bodies (open/close)
• Filters out wick noise
• Disabled by default, enable as needed
Trading Significance:
• Gaps signal strong momentum
• Gap fills provide trading opportunities
• Consecutive gaps indicate trend continuation
✓ Independent alert system for all gap types
━━━━━━━━━━━━━━━━━━━━━━━━━━━━━━━━━━━━━━━━━━━━━━━━━━
2️⃣ RTH BAR COUNT (Trading Session Counter)
Intelligent counting system designed for US stock intraday trading.
FEATURES
• RTH Only Display: Regular Trading Hours (09:30-15:00 EST)
• 5-Minute Chart Optimized: Displays every 3 bars (15-minute intervals)
• Daily Auto-Reset: Counting starts from 1 each trading day
SMART COLOR CODING
• 🔴 Red (Bars 18 & 48): Critical turning moments (1.5h & 4h)
• 🔵 Sky Blue (Multiples of 12): Hourly markers (12, 24, 36...)
• 🟢 Light Green (Bar 6): Half-hour marker (30 minutes)
• ⚫ Gray (Others): Regular 15-minute interval markers
Al Brooks Time Theory:
• Bar 18 (90 min): First 90 minutes determine daily trend
• Bar 48 (4 hours): Important afternoon turning point
• Hourly markers: Track institutional trading rhythm
━━━━━━━━━━━━━━━━━━━━━━━━━━━━━━━━━━━━━━━━━━━━━━━━━━
3️⃣ FOUR-LINE EMA SYSTEM
Professional-grade configurable moving average system.
DEFAULT CONFIGURATION
• EMA 20: Short-term trend (Al Brooks' most important MA)
• EMA 50: Medium-short term reference
• EMA 100: Medium-long term confirmation
• EMA 200: Long-term trend and bull/bear dividing line
FLEXIBLE CUSTOMIZATION
Each EMA can be independently configured:
• On/Off toggle
• Data source selection (close/high/low/open, etc.)
• Custom period length
• Offset adjustment
• Color and transparency
COLOR SCHEME
• EMA 20: Dark brown, opaque (most important)
• EMA 50/100/200: Blue-purple gradient, 70% transparent
TRADING APPLICATIONS
• Bullish Alignment: Price > 20 > 50 > 100 > 200
• Bearish Alignment: 200 > 100 > 50 > 20 > Price
• EMA Confluence: All within <1% = major move precursor
Al Brooks Quote:
"The EMA 20 is the most important moving average. Almost all trading decisions should reference it."
━━━━━━━━━━━━━━━━━━━━━━━━━━━━━━━━━━━━━━━━━━━━━━━━━━
4️⃣ PREVIOUS VALUES (Key Prior Price Levels)
Automatically marks important price levels that often act as support/resistance.
THREE INDEPENDENT CONFIGURATIONS
Each group configurable for:
• Timeframe (1D/60min/15min, etc.)
• Price source (close/high/low/open/CurrentOpen, etc.)
• Line style and color
• Display duration (Today/TimeFrame/All)
SMART OPEN PRICE LABELS ⭐
• Auto-displays "Open" label when CurrentOpen selected
• Label color matches line color
• Customizable label size
TYPICAL SETUP
• 1st Line: Previous close (Support/Resistance)
• 2nd Line: Previous high (Breakout target)
• 3rd Line: Previous low (Support level)
Al Brooks Magnet Price Theory:
• Previous open: Price frequently tests opening price
• Previous high/low: Strongest support/resistance
• Breakout confirmation: Breaking prior levels = trend continuation
━━━━━━━━━━━━━━━━━━━━━━━━━━━━━━━━━━━━━━━━━━━━━━━━━━
5️⃣ INSIDE & OUTSIDE BAR PATTERN RECOGNITION
Automatically detects core candlestick patterns from Al Brooks' theory.
ii PATTERN (Consecutive Inside Bars)
• Current bar contained within previous bar
• Two or more consecutive
• Labels: ii, iii, iiii (auto-accumulates)
• High-probability breakout setup
• Stop loss: Outside both bars
Trading Significance:
"Inside bars are one of the most reliable breakout setups, especially three or more consecutive inside bars." - Al Brooks
OO PATTERN (Consecutive Outside Bars)
• Current bar engulfs previous bar
• Two or more consecutive
• Labels: oo, ooo (auto-accumulates)
• Indicates indecision or volatility increase
ioi PATTERN (Inside-Outside-Inside)
• Three-bar combination: Inside → Outside → Inside
• Auto-detected and labeled
• Tug-of-war pattern
• Breakout direction often very strong
SMART LABEL SYSTEM
• Auto-accumulation counting
• Dynamic label updates
• Customizable size and color
• Positioned above bars
✓ Independent alerts for all patterns
━━━━━━━━━━━━━━━━━━━━━━━━━━━━━━━━━━━━━━━━━━━━━━━━━━
💡 USE CASES
INTRADAY TRADING
✓ Bar Count (timing rhythm)
✓ Traditional Gap (strong signals)
✓ EMA 20 + 50 (quick trend)
✓ ii/ioi Patterns (breakout points)
SWING TRADING
✓ Previous Values (key levels)
✓ EMA 20 + 50 + 100 (trend analysis)
✓ Gaps (trend confirmation)
✓ iii Patterns (entry timing)
TREND FOLLOWING
✓ All four EMAs (alignment analysis)
✓ Gaps (continuation signals)
✓ Previous Values (targets)
BREAKOUT TRADING
✓ iii Pattern (high-reliability setup)
✓ Previous Values (targets)
✓ EMA 20 (trend direction)
━━━━━━━━━━━━━━━━━━━━━━━━━━━━━━━━━━━━━━━━━━━━━━━━━━
🎨 DESIGN FEATURES
PROFESSIONAL COLOR SCHEME
• Gaps: Hollow borders + light colors
• Bar Count: Smart multi-color coding
• EMAs: Gradient colors + transparency hierarchy
• Previous Values: Customizable + smart labels
CLEAR VISUAL HIERARCHY
• Important elements: Opaque (EMA 20, bar count)
• Reference elements: Semi-transparent (other EMAs, gaps)
• Hollow design: Doesn't obscure price action
USER-FRIENDLY INTERFACE
• Clear functional grouping
• Inline layout saves space
• All colors and sizes customizable
━━━━━━━━━━━━━━━━━━━━━━━━━━━━━━━━━━━━━━━━━━━━━━━━━━
📚 AL BROOKS THEORY CORE
READING PRICE ACTION
"Don't try to predict the market, read what the market is telling you."
PABP converts core concepts into visual tools:
• Trend Assessment: EMA system
• Time Rhythm: Bar Count
• Market Structure: Gap analysis
• Trade Setups: Inside/Outside Bars
• Support/Resistance: Previous Values
PROBABILITY THINKING
• ii pattern: Medium probability
• iii pattern: High probability
• iii + EMA 20 support: Very high probability
━━━━━━━━━━━━━━━━━━━━━━━━━━━━━━━━━━━━━━━━━━━━━━━━━━
⚙️ TECHNICAL SPECIFICATIONS
• Pine Script Version: v6
• Maximum Objects: 500 lines, 500 labels, 500 boxes
• Alert Functions: 8 independent alerts
• Supported Timeframes: All (5-min recommended for Bar Count)
• Compatibility: All TradingView plans, Mobile & Desktop
━━━━━━━━━━━━━━━━━━━━━━━━━━━━━━━━━━━━━━━━━━━━━━━━━━
🚀 RECOMMENDED INITIAL SETTINGS
GAPS
• Traditional Gap: ✓
• Tail Gap: ✓
• Border Width: 2
BAR COUNT
• Use Bar Count: ✓
• Label Size: Normal
EMA
• EMA 20: ✓
• EMA 50: ✓
• EMA 100: ✓
• EMA 200: ✓
PREVIOUS VALUES
• 1st: close (Previous close)
• 2nd: high (Previous high)
• 3rd: low (Previous low)
INSIDE & OUTSIDE BAR
• All patterns: ✓
• Label Size: Large
━━━━━━━━━━━━━━━━━━━━━━━━━━━━━━━━━━━━━━━━━━━━━━━━━━
🌟 WHY CHOOSE PABP?
✅ Solid Theoretical Foundation
Based on Al Brooks' decades of trading experience
✅ Complete Professional Features
Systematizes complex price action analysis
✅ Highly Customizable
Every feature adjustable to personal style
✅ Excellent Performance
Optimized code ensures smooth experience
✅ Continuous Updates
Constantly improving based on feedback
✅ Suitable for All Levels
Benefits beginners to professionals
━━━━━━━━━━━━━━━━━━━━━━━━━━━━━━━━━━━━━━━━━━━━━━━━━━
📖 RECOMMENDED LEARNING
Al Brooks Books:
• "Trading Price Action Trends"
• "Trading Price Action Trading Ranges"
• "Trading Price Action Reversals"
Learning Path:
1. Understand basic candlestick patterns
2. Learn EMA applications
3. Master market structure analysis
4. Develop trading system
5. Continuous practice and optimization
━━━━━━━━━━━━━━━━━━━━━━━━━━━━━━━━━━━━━━━━━━━━━━━━━━
⚠️ RISK DISCLOSURE
IMPORTANT NOTICE:
• For educational and informational purposes only
• Does not constitute investment advice
• Past performance doesn't guarantee future results
• Trading involves risk and may result in capital loss
• Trade according to your risk tolerance
• Test thoroughly in demo account first
RESPONSIBLE TRADING:
• Always use stop losses
• Control position sizes reasonably
• Don't overtrade
• Continuous learning and improvement
• Keep trading journal
━━━━━━━━━━━━━━━━━━━━━━━━━━━━━━━━━━━━━━━━━━━━━━━━━━
📜 COPYRIGHT
Price Action Brooks Pro (PABP)
Author: © JimmC98
License: Mozilla Public License 2.0
Pine Script Version: v6
Acknowledgments:
Thanks to Dr. Al Brooks for his contributions to price action trading. This indicator is developed based on his theories.
━━━━━━━━━━━━━━━━━━━━━━━━━━━━━━━━━━━━━━━━━━━━━━━━━━
Experience professional-grade price action analysis now!
"The best traders read price action, not indicators. But when indicators help you read price action better, use them." - Al Brooks

T3 ATR [DCAUT]█ T3 ATR
📊 ORIGINALITY & INNOVATION
The T3 ATR indicator represents an important enhancement to the traditional Average True Range (ATR) indicator by incorporating the T3 (Tilson Triple Exponential Moving Average) smoothing algorithm. While standard ATR uses fixed RMA (Running Moving Average) smoothing, T3 ATR introduces a configurable volume factor parameter that allows traders to adjust the smoothing characteristics from highly responsive to heavily smoothed output.
This innovation addresses a fundamental limitation of traditional ATR: the inability to adapt smoothing behavior without changing the calculation period. With T3 ATR, traders can maintain a consistent ATR period while adjusting the responsiveness through the volume factor, making the indicator adaptable to different trading styles, market conditions, and timeframes through a single unified implementation.
The T3 algorithm's triple exponential smoothing with volume factor control provides improved signal quality by reducing noise while maintaining better responsiveness compared to traditional smoothing methods. This makes T3 ATR particularly valuable for traders who need to adapt their volatility measurement approach to varying market conditions without switching between multiple indicator configurations.
📐 MATHEMATICAL FOUNDATION
The T3 ATR calculation process involves two distinct stages:
Stage 1: True Range Calculation
The True Range (TR) is calculated using the standard formula:
TR = max(high - low, |high - close |, |low - close |)
This captures the greatest of the current bar's range, the gap from the previous close to the current high, or the gap from the previous close to the current low, providing a comprehensive measure of price movement that accounts for gaps and limit moves.
Stage 2: T3 Smoothing Application
The True Range values are then smoothed using the T3 algorithm, which applies six exponential moving averages in succession:
First Layer: e1 = EMA(TR, period), e2 = EMA(e1, period)
Second Layer: e3 = EMA(e2, period), e4 = EMA(e3, period)
Third Layer: e5 = EMA(e4, period), e6 = EMA(e5, period)
Final Calculation: T3 = c1×e6 + c2×e5 + c3×e4 + c4×e3
The coefficients (c1, c2, c3, c4) are derived from the volume factor (VF) parameter:
a = VF / 2
c1 = -a³
c2 = 3a² + 3a³
c3 = -6a² - 3a - 3a³
c4 = 1 + 3a + a³ + 3a²
The volume factor parameter (0.0 to 1.0) controls the weighting of these coefficients, directly affecting the balance between responsiveness and smoothness:
Lower VF values (approaching 0.0): Coefficients favor recent data, resulting in faster response to volatility changes with minimal lag but potentially more noise
Higher VF values (approaching 1.0): Coefficients distribute weight more evenly across the smoothing layers, producing smoother output with reduced noise but slightly increased lag
📊 COMPREHENSIVE SIGNAL ANALYSIS
Volatility Level Interpretation:
High Absolute Values: Indicate strong price movements and elevated market activity, suggesting larger position risks and wider stop-loss requirements, often associated with trending markets or significant news events
Low Absolute Values: Indicate subdued price movements and quiet market conditions, suggesting smaller position risks and tighter stop-loss opportunities, often associated with consolidation phases or low-volume periods
Rapid Increases: Sharp spikes in T3 ATR often signal the beginning of significant price moves or market regime changes, providing early warning of increased trading risk
Sustained High Levels: Extended periods of elevated T3 ATR indicate sustained trending conditions with persistent volatility, suitable for trend-following strategies
Sustained Low Levels: Extended periods of low T3 ATR indicate range-bound conditions with suppressed volatility, suitable for mean-reversion strategies
Volume Factor Impact on Signals:
Low VF Settings (0.0-0.3): Produce responsive signals that quickly capture volatility changes, suitable for short-term trading but may generate more frequent color changes during minor fluctuations
Medium VF Settings (0.4-0.7): Provide balanced signal quality with moderate responsiveness, filtering out minor noise while capturing significant volatility changes, suitable for swing trading
High VF Settings (0.8-1.0): Generate smooth, stable signals that filter out most noise and focus on major volatility trends, suitable for position trading and long-term analysis
🎯 STRATEGIC APPLICATIONS
Position Sizing Strategy:
Determine your risk per trade (e.g., 1% of account capital - adjust based on your risk tolerance and experience)
Decide your stop-loss distance multiplier (e.g., 2.0x T3 ATR - this varies by market and strategy, test different values)
Calculate stop-loss distance: Stop Distance = Multiplier × Current T3 ATR
Calculate position size: Position Size = (Account × Risk %) / Stop Distance
Example: $10,000 account, 1% risk, T3 ATR = 50 points, 2x multiplier → Position Size = ($10,000 × 0.01) / (2 × 50) = $100 / 100 points = 1 unit per point
Important: The ATR multiplier (1.5x - 3.0x) should be determined through backtesting for your specific instrument and strategy - using inappropriate multipliers may result in stops that are too tight (frequent stop-outs) or too wide (excessive losses)
Adjust the volume factor to match your trading style: lower VF for responsive stop distances in short-term trading, higher VF for stable stop distances in position trading
Dynamic Stop-Loss Placement:
Determine your risk tolerance multiplier (typically 1.5x to 3.0x T3 ATR)
For long positions: Set stop-loss at entry price minus (multiplier × current T3 ATR value)
For short positions: Set stop-loss at entry price plus (multiplier × current T3 ATR value)
Trail stop-losses by recalculating based on current T3 ATR as the trade progresses
Adjust the volume factor based on desired stop-loss stability: higher VF for less frequent adjustments, lower VF for more adaptive stops
Market Regime Identification:
Calculate a reference volatility level using a longer-period moving average of T3 ATR (e.g., 50-period SMA)
High Volatility Regime: Current T3 ATR significantly above reference (e.g., 120%+) - favor trend-following strategies, breakout trades, and wider targets
Normal Volatility Regime: Current T3 ATR near reference (e.g., 80-120%) - employ standard trading strategies appropriate for prevailing market structure
Low Volatility Regime: Current T3 ATR significantly below reference (e.g., <80%) - favor mean-reversion strategies, range trading, and prepare for potential volatility expansion
Monitor T3 ATR trend direction and compare current values to recent history to identify regime transitions early
Risk Management Implementation:
Establish your maximum portfolio heat (total risk across all positions, typically 2-6% of capital)
For each position: Calculate position size using the formula Position Size = (Account × Individual Risk %) / (ATR Multiplier × Current T3 ATR)
When T3 ATR increases: Position sizes automatically decrease (same risk %, larger stop distance = smaller position)
When T3 ATR decreases: Position sizes automatically increase (same risk %, smaller stop distance = larger position)
This approach maintains constant dollar risk per trade regardless of market volatility changes
Use consistent volume factor settings across all positions to ensure uniform risk measurement
📋 DETAILED PARAMETER CONFIGURATION
ATR Length Parameter:
Default Setting: 14 periods
This is the standard ATR calculation period established by Welles Wilder, providing balanced volatility measurement that captures both short-term fluctuations and medium-term trends across most markets and timeframes
Selection Principles:
Shorter periods increase sensitivity to recent volatility changes and respond faster to market shifts, but may produce less stable readings
Longer periods emphasize sustained volatility trends and filter out short-term noise, but respond more slowly to genuine regime changes
The optimal period depends on your holding time, trading frequency, and the typical volatility cycle of your instrument
Consider the timeframe you trade: Intraday traders typically use shorter periods, swing traders use intermediate periods, position traders use longer periods
Practical Approach:
Start with the default 14 periods and observe how well it captures volatility patterns relevant to your trading decisions
If ATR seems too reactive to minor price movements: Increase the period until volatility readings better reflect meaningful market changes
If ATR lags behind obvious volatility shifts that affect your trades: Decrease the period for faster response
Match the period roughly to your typical holding time - if you hold positions for N bars, consider ATR periods in a similar range
Test different periods using historical data for your specific instrument and strategy before committing to live trading
T3 Volume Factor Parameter:
Default Setting: 0.7
This setting provides a reasonable balance between responsiveness and smoothness for most market conditions and trading styles
Understanding the Volume Factor:
Lower values (closer to 0.0) reduce smoothing, allowing T3 ATR to respond more quickly to volatility changes but with less noise filtering
Higher values (closer to 1.0) increase smoothing, producing more stable readings that focus on sustained volatility trends but respond more slowly
The trade-off is between immediacy and stability - there is no universally optimal setting
Selection Principles:
Match to your decision speed: If you need to react quickly to volatility changes for entries/exits, use lower VF; if you're making longer-term risk assessments, use higher VF
Match to market character: Noisier, choppier markets may benefit from higher VF for clearer signals; cleaner trending markets may work well with lower VF for faster response
Match to your preference: Some traders prefer responsive indicators even with occasional false signals, others prefer stable indicators even with some delay
Practical Adjustment Guidelines:
Start with default 0.7 and observe how T3 ATR behavior aligns with your trading needs over multiple sessions
If readings seem too unstable or noisy for your decisions: Try increasing VF toward 0.9-1.0 for heavier smoothing
If the indicator lags too much behind volatility changes you care about: Try decreasing VF toward 0.3-0.5 for faster response
Make meaningful adjustments (0.2-0.3 changes) rather than small increments - subtle differences are often imperceptible in practice
Test adjustments in simulation or paper trading before applying to live positions
📈 PERFORMANCE ANALYSIS & COMPETITIVE ADVANTAGES
Responsiveness Characteristics:
The T3 smoothing algorithm provides improved responsiveness compared to traditional RMA smoothing used in standard ATR. The triple exponential design with volume factor control allows the indicator to respond more quickly to genuine volatility changes while maintaining the ability to filter noise through appropriate VF settings. This results in earlier detection of volatility regime changes compared to standard ATR, particularly valuable for risk management and position sizing adjustments.
Signal Stability:
Unlike simple smoothing methods that may produce erratic signals during transitional periods, T3 ATR's multi-layer exponential smoothing provides more stable signal progression. The volume factor parameter allows traders to tune signal stability to their preference, with higher VF settings producing remarkably smooth volatility profiles that help avoid overreaction to temporary market fluctuations.
Comparison with Standard ATR:
Adaptability: T3 ATR allows adjustment of smoothing characteristics through the volume factor without changing the ATR period, whereas standard ATR requires changing the period length to alter responsiveness, potentially affecting the fundamental volatility measurement
Lag Reduction: At lower volume factor settings, T3 ATR responds more quickly to volatility changes than standard ATR with equivalent periods, providing earlier signals for risk management adjustments
Noise Filtering: At higher volume factor settings, T3 ATR provides superior noise filtering compared to standard ATR, producing cleaner signals for long-term analysis without sacrificing volatility measurement accuracy
Flexibility: A single T3 ATR configuration can serve multiple trading styles by adjusting only the volume factor, while standard ATR typically requires multiple instances with different periods for different trading applications
Suitable Use Cases:
T3 ATR is well-suited for the following scenarios:
Dynamic Risk Management: When position sizing and stop-loss placement need to adapt quickly to changing volatility conditions
Multi-Style Trading: When a single volatility indicator must serve different trading approaches (day trading, swing trading, position trading)
Volatile Markets: When standard ATR produces too many false volatility signals during choppy conditions
Systematic Trading: When algorithmic systems require a single, configurable volatility input that can be optimized for different instruments
Market Regime Analysis: When clear identification of volatility expansion and contraction phases is critical for strategy selection
Known Limitations:
Like all technical indicators, T3 ATR has limitations that users should understand:
Historical Nature: T3 ATR is calculated from historical price data and cannot predict future volatility with certainty
Smoothing Trade-offs: The volume factor setting involves a trade-off between responsiveness and smoothness - no single setting is optimal for all market conditions
Extreme Events: During unprecedented market events or gaps, T3 ATR may not immediately reflect the full scope of volatility until sufficient data is processed
Relative Measurement: T3 ATR values are most meaningful in relative context (compared to recent history) rather than as absolute thresholds
Market Context Required: T3 ATR measures volatility magnitude but does not indicate price direction or trend quality - it should be used in conjunction with directional analysis
Performance Expectations:
T3 ATR is designed to help traders measure and adapt to changing market volatility conditions. When properly configured and applied:
It can help reduce position risk during volatile periods through appropriate position sizing
It can help identify optimal times for more aggressive position sizing during stable periods
It can improve stop-loss placement by adapting to current market conditions
It can assist in strategy selection by identifying volatility regimes
However, volatility measurement alone does not guarantee profitable trading. T3 ATR should be integrated into a comprehensive trading approach that includes directional analysis, proper risk management, and sound trading psychology.
USAGE NOTES
This indicator is designed for technical analysis and educational purposes. T3 ATR provides adaptive volatility measurement but has limitations and should not be used as the sole basis for trading decisions. The indicator measures historical volatility patterns, and past volatility characteristics do not guarantee future volatility behavior. Market conditions can change rapidly, and extreme events may produce volatility readings that fall outside historical norms.
Traders should combine T3 ATR with directional analysis tools, support/resistance analysis, and other technical indicators to form a complete trading strategy. Proper backtesting and forward testing with appropriate risk management is essential before applying T3 ATR-based strategies to live trading. The volume factor parameter should be optimized for specific instruments and trading styles through careful testing rather than assuming default settings are optimal for all applications.

Support & Resistance AriesSupport & Resistance Aries
This indicator automatically identifies support and resistance levels based on the highest and lowest closing prices within a configurable period.
How it works:
The user sets a calculation period (default is 20 candles).
The indicator plots:
Green line = Support: lowest closing price within the period.
Red line = Resistance: highest closing price within the period.
Adjustable parameter:
Calculation Period (1 to 200): defines how many candles are used to find the price extremes.
Purpose:
Helps users quickly visualize dynamic support and resistance zones that adjust as price evolves, making it easier to identify areas for potential entries, exits, and stop placements.
Important:
This indicator should not be used as a standalone buy or sell signal, nor as a trend confirmation tool on its own.
It is recommended to use it in combination with other technical analysis tools such as MACD, RSI, Volume, Moving Averages, among others, for a more complete market view.
Disclaimer:
Investing involves financial risk. Be cautious with both profits and losses. Always define a stop loss to avoid larger losses if the trend reverses.
One of the golden rules in trading is: a trader should not lose more than 3% to 5% of their capital per trade. Protecting your capital should always be the priority.

Risk Calculator PRO — manual lot size + auto lot-suggestionWhy risk management?
90 % of traders blow up because they size positions emotionally. This tool forces Risk-First Thinking: choose the amount you’re willing to lose, and the script reverse-engineers everything else.
Key features
1. Manual or Market Entry – click “Use current price” or type a custom entry.
2. Setup-based ₹-Risk – four presets (A/B/C/D). Edit to your workflow.
3. Lot-Size Input + Auto Lot Suggestion – you tell the contract size ⇒ script tells you how many lots.
4. Auto-SL (optional) – tick to push stop-loss to exactly 1-lot risk.
5. Instant Targets – 1 : 2, 1 : 3, 1 : 4, 1 : 5 plotted and alert-ready.
6. P&L Preview – table shows potential profit at each R-multiple plus real ₹ at SL.
7. Margin Column – enter per-lot margin once; script totals it for any size.
8. Clean Table UI – dark/light friendly; updates every 5 bars.
9. Alert Pack – SL, each target, plus copy-paste journal line on the chart.
How to use
1. Add to chart > “Format”.
2. Type the lot size for the symbol (e.g., 1250 for Natural Gas, 1 for cash equity).
3. Pick Side (Buy / Sell) & Setup grade.
4. ✅ If you want the script to place SL for you, tick Auto-SL (risk = 1 lot).
5. Otherwise type your own Stop-loss.
6. Read the table:
• Suggested lots = how many to trade so risk ≤ setup ₹.
• Risk (currency) = real money lost if SL hits.
7. Set TradingView alerts on the built-in conditions (T1_2, SL_hit, etc.) if you’d like push / email.
8. Copy the orange CSV label to Excel / Sheets for journalling.
Best practices
• Never raise risk to “fit” a trade. Lower size instead.
• Review win-rate vs. R multiple monthly; adjust setups A–D accordingly.
• Test Auto-SL in replay before going live.
Disclaimer
This script is educational. Past performance ≠ future results. The author isn’t responsible for trading losses.

OTE & A-B-C Zone Indicator SwiftEdgeOTE & A-B-C Zone Indicator SwiftEdge
Overview
The OTE & A-B-C Zone Indicator SwiftEdge is a versatile tool designed to help traders identify high-probability trading setups using a combination of Optimal Trade Entry (OTE) zones, Fibonacci levels, and A-B-C price patterns. This indicator is particularly useful for traders who rely on price action and Fibonacci-based strategies to find entry points, set stop-losses, and target potential take-profit levels. By integrating swing point detection, trend analysis, and Fibonacci projections, SwiftEdge provides a clear visual framework for making informed trading decisions across various timeframes.
What It Does
SwiftEdge identifies key price levels and zones to guide your trading:
OTE Zone: Highlights the Optimal Trade Entry zone between swing points A (swing high) and B (swing low) using Fibonacci retracement levels (default: 0.618 to 0.786). This zone represents a high-probability area for price reversals, making it an ideal entry point for trades.
A-B-C Pattern: Marks the latest swing points as A (swing high), B (swing low), and C (projected take-profit level) with dashed lines and labels. A solid line connects A to B to C, visually illustrating the price movement from entry to target.
Take-Profit Zones: Projects three customizable take-profit levels (TP1, TP2, TP3) based on Fibonacci extensions (default: 1.272, 1.618, 2.0) from the A-B swing, helping traders plan exits with favorable risk-reward ratios.
How It Works
SwiftEdge combines several technical components to create a cohesive trading system:
Swing Point Detection: Identifies significant swing highs (A) and swing lows (B) using a dynamic lookback period that adjusts to the selected timeframe. On lower timeframes like 1-minute charts, an ATR-based filter reduces noise by requiring price movements to exceed a threshold (0.5 * ATR(14)).
Trend Analysis: Uses an Exponential Moving Average (EMA) to determine the trend direction (default: 50-period EMA on 1H). The indicator marks uptrends (price above EMA) in green and downtrends (price below EMA) in red, ensuring trades align with the market's direction.
Fibonacci Levels: Applies Fibonacci retracement to define the OTE zone between A and B, and Fibonacci extensions to project take-profit levels (C) beyond the initial swing. This approach leverages the natural tendency of markets to respect Fibonacci ratios for reversals and extensions.
Visual Clarity: Displays only the latest A-B-C pattern with three dashed lines (A, B, C) and a solid connecting line, ensuring the chart remains uncluttered and easy to interpret.
The combination of these elements creates a structured setup where the OTE zone (between A and B) serves as an entry point, while the projected C level offers a target, all within the context of the prevailing trend. This synergy makes SwiftEdge a powerful tool for traders seeking to combine price action, trend analysis, and Fibonacci strategies.
How to Use
Add the Indicator: Apply the indicator to your chart via TradingView's indicator menu.
Identify the Trend: The OTE zone and A-B-C pattern will be colored green in uptrends (price above EMA) or red in downtrends (price below EMA). Use this to determine the market direction.
Entry Point: Look for price reversals within the OTE zone (between A and B). This zone is typically between the 0.618 and 0.786 Fibonacci retracement levels of the A-B swing, making it a high-probability area for entries.
Stop-Loss: Place your stop-loss below the OTE zone in an uptrend (or above in a downtrend) to protect against false breakouts.
Take-Profit Targets: Use the projected take-profit zones (TP1, TP2, TP3) as potential exit levels. These are based on Fibonacci extensions and can be toggled on/off in the settings.
Customization:
Adjust the Fibonacci levels for the OTE zone (Fibonacci Level 1 and Fibonacci Level 2) to suit your strategy.
Modify the take-profit levels (Fibonacci Extension Level for TP1/TP2/TP3) to target different extension ratios.
Change the lookback period (Base Lookback Period) and EMA period (Base EMA Period) to fine-tune swing point detection and trend sensitivity.
Customize colors for uptrends, downtrends, and A-B-C lines to match your preferences.
What Makes It Unique
SwiftEdge stands out by integrating swing point detection, Fibonacci-based OTE zones, and A-B-C price patterns into a single, visually intuitive indicator. Unlike standalone Fibonacci tools or trend indicators, SwiftEdge combines these elements to provide a complete trading setup: it identifies entry zones (OTE), confirms trend direction (EMA), and projects take-profit targets (Fibonacci extensions). The dynamic timeframe adjustment ensures consistent performance across all chart intervals, while the clean A-B-C visualization (with only the latest pattern displayed) prevents chart clutter, making it easier to focus on the most relevant price levels.
Notes
This indicator is designed for traders familiar with price action and Fibonacci strategies. It does not guarantee profits and should be used in conjunction with other analysis tools and proper risk management.
Performance may vary depending on market conditions and timeframe. Test the indicator on a demo account before using it in live trading.
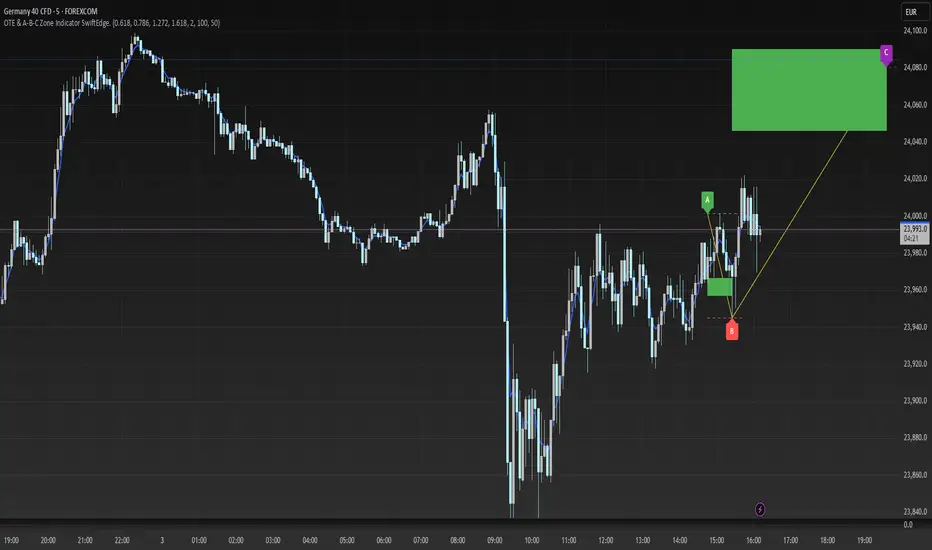
[TehThomas] - ICT Liquidity sweepsThe ICT Liquidity Sweeps Indicator is designed to track liquidity zones in the market areas where stop-losses and pending orders are typically clustered. This indicator marks buyside liquidity (resistance) and sellside liquidity (support), helping traders identify areas where price is likely to manipulate liquidity before making a significant move.
This tool is based on Inner Circle Trader (ICT) Smart Money Concepts, which emphasize how institutional traders, or “Smart Money,” manipulate liquidity to fuel price movements. By identifying these zones, traders can anticipate liquidity sweeps and position themselves accordingly.
⚙️ How It Works
1️⃣ Detects Key Liquidity Zones
The script automatically identifies significant swing highs and swing lows in price action using a pivot-based method.
A swing high (buyside liquidity) is a peak where price struggles to break higher, forming a resistance level.
A swing low (sellside liquidity) is a valley where price struggles to go lower, creating a support level.
These liquidity points are prime targets for liquidity sweeps before a true trend direction is confirmed.
2️⃣ Draws Liquidity Lines
Once a swing high or low is identified, a horizontal line is drawn at that level.
The lines extend to the right, serving as future liquidity targets until they are broken.
The indicator allows customization in terms of color, line width, and maximum number of liquidity lines displayed at once.
3️⃣ Handles Liquidity Sweeps
When price breaks a liquidity level, the indicator reacts based on the chosen action setting:
Dotted/Dashed: The line remains visible but changes style to indicate a sweep.
Delete: The line is completely removed once price has interacted with it.
This feature ensures that traders can easily spot where liquidity has been taken and determine whether a reversal or continuation is likely.
4️⃣ Prevents Chart Clutter
To maintain a clean chart, the script limits the number of liquidity lines displayed at any given time.
When new liquidity zones are formed, the oldest lines are automatically removed, keeping the focus on the most relevant liquidity zones.
🎯 How to Use the ICT Liquidity Sweeps Indicator
🔍 Identifying Liquidity Grabs
This indicator helps you identify areas where Smart Money is targeting liquidity before making a move.
Buyside Liquidity (BSL) Sweeps:
Occur when price spikes above a resistance level before reversing downward.
Indicate that Smart Money has hunted stop-losses and buy stops before driving price lower.
Sellside Liquidity (SSL) Sweeps:
Occur when price drops below a support level before reversing upward.
Indicate that Smart Money has collected liquidity from stop-losses and sell stops before pushing price higher.
📈 Combining with Market Structure Shifts (MSS)
One of the best ways to use this indicator is in conjunction with our Market Structure Shifts Indicator.
Liquidity sweeps + MSS Confirmation give strong high-probability trade setups:
Wait for a liquidity sweep (price takes out a liquidity level).
Look for an MSS in the opposite direction (e.g., price sweeps a high, then breaks a recent low).
Enter the trade in the new direction with stop-loss above/below the liquidity sweep.
📊 Entry & Exit Strategies
Long Trade Example:
Price sweeps a key sellside liquidity level (SSL) → creates a false breakdown.
MSS confirms a reversal (price breaks structure upwards).
Enter long position after confirmation.
Stop-loss below the liquidity grab to minimize risk.
Short Trade Example:
Price sweeps a key buyside liquidity level (BSL) → takes liquidity above resistance.
MSS confirms a bearish move (price breaks a key support level).
Enter short position after confirmation.
Stop-loss above the liquidity grab.
🚀 Why This Indicator is a Game-Changer
✅ Helps Identify Smart Money Manipulation – Understand where institutions are likely to grab liquidity before the real move happens.
✅ Enhances Market Structure Analysis – When paired with MSS, liquidity sweeps become powerful signals for trend reversals.
✅ Filters Out False Breakouts – Many traders get caught in liquidity grabs. This indicator helps avoid bad entries.
✅ Keeps Your Chart Clean – The auto-limiting feature ensures that only the most relevant liquidity levels remain visible.
✅ Works on Any Timeframe – Whether you’re a scalper, day trader, or swing trader, liquidity concepts apply universally.
📌 Final Thoughts
The ICT Liquidity Sweeps Indicator is a must-have tool for traders who follow Smart Money Concepts. By tracking liquidity levels and highlighting sweeps, it allows traders to enter trades with precision while avoiding false breakouts.
When combined with Market Structure Shifts (MSS), this strategy becomes even more powerful, offering traders an edge in spotting reversals and timing entries effectively.
__________________________________________
Thanks for your support!
If you found this idea helpful or learned something new, drop a like 👍 and leave a comment—I’d love to hear your thoughts! 🚀
Make sure to follow me for more price action insights, free indicators, and trading strategies. Let’s grow and trade smarter together! 📈✨

SiCInside Sweep Close (ISC):
This concept captures a specific price action behavior and can help refine trading strategies for better precision. Here's a detailed explanation:
Inside:
The closing price of the candle stays within the range of the previous candle.
This indicates a containment of price action, suggesting indecision or preparation for a significant move.
Sweep:
The wick of the candle takes out (or "sweeps") the low (or high) of the previous candle.
This sweep can trigger stop-losses of retail traders or activate pending orders, often used by smart money strategies.
Close:
The candle ultimately closes inside the range of the previous candle.
This close signifies that the sweep was a liquidity grab rather than a genuine breakout, providing an actionable trading signal.
How ISC Can Be Used in Trading:
Liquidity Grab Recognition:
ISC can indicate when liquidity is swept from the market, making it an ideal entry point for traders anticipating a reversal or continuation.
Smart Money Concept (SMC) Synergy:
If you follow SMC principles, ISC aligns with key concepts like liquidity sweeps, order blocks, and mitigation zones.
Risk Management:
By identifying the ISC setup, you can place tighter stop-loss levels just outside the sweep, optimizing risk-reward ratios.
Entry Signals:
When you spot an ISC, you can enter trades at the close of the candle, anticipating a move in the direction opposite to the sweep.
Example of ISC in Action:
Imagine a bearish candle:
The wick sweeps the low of the previous candle, possibly triggering stop-losses.
However, the close stays inside the previous candle’s range.
This setup might indicate a reversal, where price moves upward after grabbing liquidity.
Why This Name Works:
It’s concise, professional, and directly linked to the trading action you’re describing.
The short form, ISC, is easy to remember and discuss within trading circles or while teaching others.
It ties into widely known concepts like smart money, price action, and liquidity sweeps, making it relatable yet unique.
Does this align with how you envision using the concept? Let me know if you’d like more refinements or visual examples!

Austin's Apex AcceleratorIndicator Name: Austin’s Apex Accelerator
Overview
The Austin’s Apex Accelerator is a highly aggressive trading indicator designed specifically for high-frequency Forex trading. It combines several technical analysis tools to identify rapid entry and exit points, making it well-suited for intraday or even lower timeframe trades. The indicator leverages a combination of exponential moving averages (EMAs), Bollinger Bands, volume filters, and volatility-adjusted ranges to detect breakout opportunities and manage risk with precision.
Core Components
Fast and Slow EMAs: The two EMAs act as trend and momentum indicators. When the shorter EMA crosses the longer EMA, it signals a change in momentum. The crossover of these EMAs often indicates a potential entry point, especially when combined with volume and volatility filters.
ATR-Based Range Filter: Using the Average True Range (ATR) for dynamic range calculation, the indicator adapts to market volatility. Higher ATR values widen the range, helping the indicator adjust for volatile conditions.
Volume Filter: A volume condition ensures that buy and sell signals only trigger when there’s significant market interest, reducing the likelihood of false signals in low-liquidity environments.
Bollinger Bands: The Bollinger Bands provide additional context for potential overbought or oversold conditions, highlighting opportunities for price reversals or trend continuations.
Key Features
Aggressive Buy and Sell Signals:
Buy Signal: A buy signal is generated when the fast EMA crosses above the slow EMA, confirming bullish momentum, and the volume condition is met. If the price is also near the lower Bollinger Band, it adds further confirmation of an oversold condition.
Sell Signal: A sell signal is generated when the fast EMA crosses below the slow EMA, confirming bearish momentum, with sufficient trading volume. If the price is near the upper Bollinger Band, it signals a potential overbought condition, which supports the sell signal.
Dynamic Range with ATR:
The indicator uses a volatility-based range, derived from the ATR, to adjust the signal sensitivity based on recent price fluctuations. This dynamic range ensures that signals are responsive in both high and low volatility conditions.
The range’s upper and lower bands act as thresholds, with trades often occurring when the price breaches these levels, signaling momentum shifts or trend reversals.
Trend Background Color:
A green background highlights bullish trends when the fast EMA is above the slow EMA.
A red background signifies bearish trends when the fast EMA is below the slow EMA, providing a visual indication of the overall market trend direction.
Trend Line:
The indicator plots a dynamic trend line that changes color based on the price's relationship to the EMAs, helping traders quickly assess the current trend’s strength and direction.
Alerts:
The indicator includes configurable alerts for buy and sell signals, allowing traders to be notified of entry opportunities without needing to monitor the chart continuously.
How to Use Austin’s Apex Accelerator
Identify Entry Points:
Buy Entry: When the fast EMA crosses above the slow EMA, a buy signal is triggered. Confirm this signal by checking if the price is near or below the lower Bollinger Band (indicating an oversold condition) and if trading volume meets the set threshold.
Sell Entry: When the fast EMA crosses below the slow EMA, a sell signal is triggered. Confirm the signal by ensuring the price is near or above the upper Bollinger Band (suggesting an overbought condition) and that volume is sufficient.
Exit Strategy:
Take Profit: The take profit level is calculated as 1.5 times the ATR from the entry point. This ensures that each trade aims to achieve a positive risk/reward ratio.
Stop Loss: The stop loss is set at 1 ATR from the entry, providing a tight risk control mechanism that limits potential losses on each trade.
Trend Identification and Background Colors:
Use the background colors to assess the trend direction. A green background indicates a bullish trend, while a red background suggests a bearish trend. These colors can help you filter signals that go against the trend, increasing the chances of a successful trade.
Volume Confirmation:
This indicator has an inbuilt volume filter to prevent trading in low-volume conditions. Look for signals only when volume exceeds the average volume threshold, which is set by the multiplier. This helps avoid trading during quieter times when false signals are more likely.
Alerts:
Set up alerts for buy and sell signals to be notified in real-time whenever a new trading opportunity arises, so you can act on high-quality signals promptly.
Practical Tips for Using Austin’s Apex Accelerator
Timeframe: Best suited for short timeframes such as 5-minute or 15-minute charts for high-frequency trading.
Support and Resistance Breakouts By RICHIESupport and resistance are fundamental concepts in technical analysis used to identify price levels on charts that act as barriers, preventing the price of an asset from getting pushed in a certain direction. Here’s a detailed description of each and how breakout strategies are typically used:
Support
Support is a price level where a downtrend can be expected to pause due to a concentration of demand. As the price of an asset drops, it hits a level where buyers tend to step in, causing the price to rebound.
Support Level Identification: Support levels are identified by looking at historical data where prices have repeatedly fallen to a certain level but have then rebounded.
Strength of Support: The more times an asset price hits a support level without breaking below it, the stronger that support level is considered to be.
Resistance
Resistance is a price level where an uptrend can be expected to pause due to a concentration of selling interest. As the price of an asset increases, it hits a level where sellers tend to step in, causing the price to drop.
Resistance Level Identification: Resistance levels are identified by looking at historical data where prices have repeatedly risen to a certain level but have then fallen back.
Strength of Resistance: The more times an asset price hits a resistance level without breaking above it, the stronger that resistance level is considered to be.
Breakouts
A breakout occurs when the price moves above a resistance level or below a support level with increased volume. Breakouts can be significant because they suggest a change in supply and demand dynamics, often leading to strong price movements.
Breakout Above Resistance: Indicates a bullish market sentiment. Traders often interpret this as a sign to enter a long position (buy).
Breakout Below Support: Indicates a bearish market sentiment. Traders often interpret this as a sign to enter a short position (sell).
Breakout Trading Strategies
Confirmation: Wait for a candle to close beyond the support or resistance level to confirm the breakout.
Volume: Increased volume on a breakout adds credibility, suggesting that the price move is supported by strong buying or selling interest.
Retest: Sometimes, after a breakout, the price will return to the breakout level to test it as a new support or resistance. This retest offers another entry point.
Stop-Loss: Place stop-loss orders just below the resistance (for long positions) or above the support (for short positions) to limit potential losses in case of a false breakout.
Take-Profit: Identify target levels for taking profits. These can be set based on previous support/resistance levels or using tools like Fibonacci retracements.

Enhanced Forex IndicatorDescription of the "Enhanced Forex Indicator"
The "Enhanced Forex Indicator" is designed for traders who want a comprehensive technical analysis tool on the TradingView platform. This script integrates Exponential Moving Averages (EMAs), support and resistance zones, and candlestick pattern recognition to provide actionable trading signals, particularly useful for Forex and other financial markets. The script is suitable for intraday trading and swing trading.
Components of the Indicator
Exponential Moving Averages (EMAs):
Short EMA (Blue Line): Faster responding average, good for identifying recent trend changes.
Long EMA (Red Line): Slower moving average, helps in confirming longer-term trends.
Support and Resistance Zones:
Resistance Zone (Red): Area where potential selling pressure could overcome buying pressure, halting price increases temporarily or reversing them.
Support Zone (Green): Area where potential buying pressure could overcome selling pressure, supporting prices and preventing them from falling further.
Candlestick Patterns:
Bullish Engulfing Pattern (Green Triangle Up 'BE'): Suggests a potential upward reversal or start of a bullish trend.
Bearish Engulfing Pattern (Red Triangle Down 'BE'): Indicates a potential downward reversal or start of a bearish trend.
Buy/Sell Signals:
Buy Signal (Green Label 'BUY'): Triggered when the price is above both EMAs and a bullish engulfing pattern is detected.
Sell Signal (Red Label 'SELL'): Triggered when the price is below both EMAs and a bearish engulfing pattern is detected.
Trading Setup:
Entry: Consider entering a buy position when the 'BUY' signal appears, indicating bullish conditions. Enter a sell position when the 'SELL' signal appears, indicating bearish conditions.
Exit: Look for closing signals opposite your entry or use predefined take profit and stop loss levels. For instance, exit a buy position on a 'SELL' signal or when the price drops below the support zone.
Risk Management:
Set stop losses just below the support zone for buy orders and above the resistance zone for sell orders to protect against significant losses.
Adjust position sizes according to your risk tolerance and account balance.
Considerations:
Use this indicator in conjunction with other analysis tools and fundamental data to confirm signals and strengthen your trading strategy.
Periodically backtest the strategy based on this indicator to ensure its effectiveness in current market conditions.
Optimization:
Adjust the lengths of the EMAs and the buffer size of the support and resistance zones to better fit the asset's volatility and your trading timeframe.

Position Size CalculatorThe provided Pine Script is a custom indicator titled "Position Size Calculator" designed to assist traders in calculating the appropriate size of a trading position based on predefined risk parameters. This script is intended to be overlaid on a trading chart, as indicated by `overlay=true`, allowing traders to visualize and adjust their risk and position size directly within the context of their trading strategy.
What It Does:
The core functionality of this script revolves around calculating the position size a trader should take based on three input parameters:
**Risk in USD (`Risk`)**: This represents the amount of money the trader is willing to risk on a single trade.
**Entry Price (`EntryPrice`)**: The price at which the trader plans to enter the market.
**Stop Loss (`StopLoss`)**: The price at which the trader plans to exit the market should the trade move against them, effectively limiting their loss.
The script calculates the position size using a function named `calculatePositionSize`, which performs the following steps:
It first calculates the `expectedLoss` by taking 90% (`0.9`) of the input risk. This implies that the script factors in a safety margin, assuming traders are willing to risk up to 90% of their stated risk amount per trade.
It then calculates the position size based on the distance between the Entry Price and the Stop Loss. This calculation adjusts based on whether the Entry Price is higher or lower than the Stop Loss, ensuring that the position size fits the risk profile regardless of trade direction.
The function returns several values: `risk`, `entryPrice`, `stopLoss`, `expectedLoss`, and `size`, which are then plotted on the chart.
How It Does It:
**Expected Loss Calculation**: By reducing the risk by 10% before calculating position size, the script provides a buffer to account for slippage or to ensure the trader does not fully utilize their risk budget on a single trade.
**Position Size Calculation**: The script calculates position size by dividing the adjusted risk (`expectedLoss`) by the price difference between the Entry Price and Stop Loss. This gives a quantitative measure of how many units of the asset can be bought or sold while staying within the risk parameters.
What Traders Can Use It For:
Traders can use this Position Size Calculator for several purposes:
- **Risk Management**: By determining the appropriate position size, traders can ensure that they do not overexpose themselves to market risk on a single trade.
- **Trade Planning**: Before entering a trade, the script allows traders to visualize their risk, entry, and exit points, helping them to make more informed decisions.
- **Consistency**: Using a standardized method for calculating position size helps traders maintain consistency in their trading approach, a key aspect of successful trading strategies.
- **Efficiency**: Automating the calculation of position size saves time and reduces the likelihood of manual calculation errors.
Overall, this Pine Script indicator is a practical tool for traders looking to implement strict risk management rules within their trading strategies, ensuring that each trade is sized appropriately according to their risk tolerance and market conditions.

LYFX-GOLD-15MIndicator Operation Method:
The indicator provides a buy signal when the price stabilizes above the moving averages. It should be close to the averages at the same time to ensure a close stop loss.
When the conditions are met, a long trade is opened, and the buy signal appears on the indicator. The stop loss is placed with the red line, and the targets are indicated with the blue balloons. Usually, the first target is twice the stop loss, and the second target is three times the stop loss.
This indicator is one of the most powerful indicators for monitoring price explosions in gold.
For clarification, this indicator is used (according to its default settings) exclusively for gold and only on the 15-minute timeframe. The indicator is created by Mr. Layth Al-Muhandis:
The indicator provides a very close stop loss compared to the first and second targets. I recommend adhering strictly to the stop loss and securing the trade after achieving profits.
This is a simple explanation of how the indicator works.
طريقة عمل المؤشر:
يوفر المؤشر إشارة شراء عند استقرار السعر فوق المتوسطات المتحركة. يجب أن يكون السعر قريبًا من المتوسطات في نفس الوقت لضمان وجود استوب لوس قريب.
عند تحقيق الشروط، يتم فتح صفقة شراء، وتظهر إشارة الشراء على المؤشر. يتم وضع الاستوب لوس بالخط الأحمر، وتوضح البالونات الزرقاء الأهداف. عادةً، يكون الهدف الأول ضعف الاستوب لوس، والهدف الثاني ثلاثة أضعاف الاستوب.
هذا المؤشر من بين أقوى المؤشرات لرصد انفجارات الأسعار في الذهب.
للتنويه، يُستخدم هذا المؤشر (وفقًا لإعداداته الافتراضية) حصريًا للذهب وعلى فاصل زمني 15 دقيقة فقط. تم إنشاء المؤشر بواسطة السيد ليث المهندس.
يوفر المؤشر استوب لوس قريب جداً مقارنة بالهدف الأول والهدف الثاني. أنصح بالالتزام الصارم بالاستوب لوس وتأمين الصفقة بعد تحقيق الأرباح.
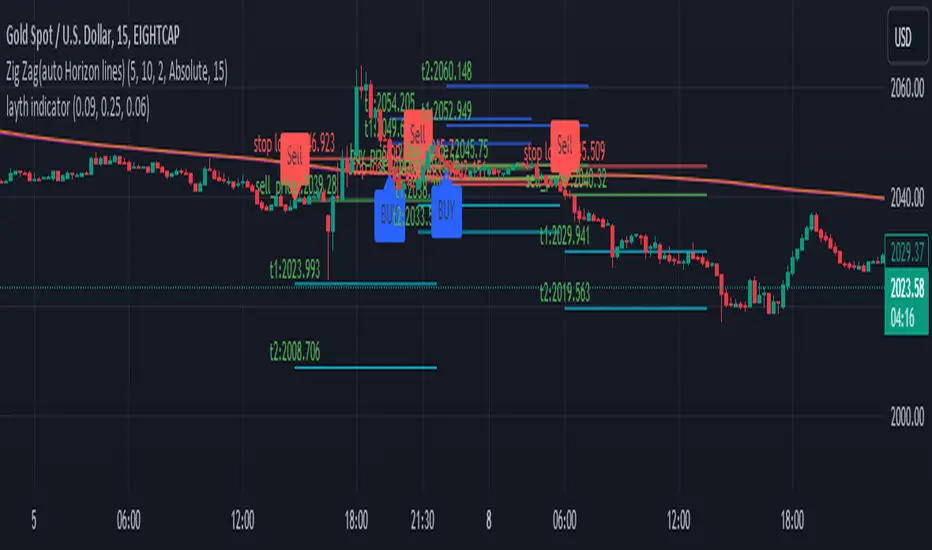
Equity Trade Risk ManagerEquity Trade Risk Manager is a simple indicator that helps you protect your portfolio by going into each trade risk first !
Equity Trade Risk Manager does this by calculating your ideal position size or ideal stop loss based on your account size, purchase price and risk tolerance. This ensures you are never risking more than your predetermined amount on each trade.
Unlike most position size calculators, that will only tell traders how many shares to purchase, Equity Trade Risk Manger allows the trader to choose whether they want to calculate the ideal number of shares to purchase or where to set the trades stop loss based on the number of shares owned. Not only that, but knowing traders need to act fast, the indicator also gives the option to quickly use the current price and low of the day as an entry and stop. Lastly, your stop loss will be plotted onto the chart for a visual aid.
Features:
Dynamic Risk Settings:
Account Customization: Input your account size to get metrics tailored to you.
Calculation Choices: Decide if you want the tool to calculate the number of shares you should buy or where to set your stop-loss.
Custom Risk Parameters: Use preset risk percentages or set your own to match your comfort level.
Price Point Flexibility:
Enter your entry and stop price or opt to use the current price and the low of the day.
Interactive Display Settings:
Customizable Interface: Adjust table positions, text size, and color schemes to match your trading dashboard aesthetic.
On-Chart Stop-Loss Indication: Visualize your stop loss on the chart itself.
Get a snapshot of your dollar risk, position size, shares to buy, and stop-loss.
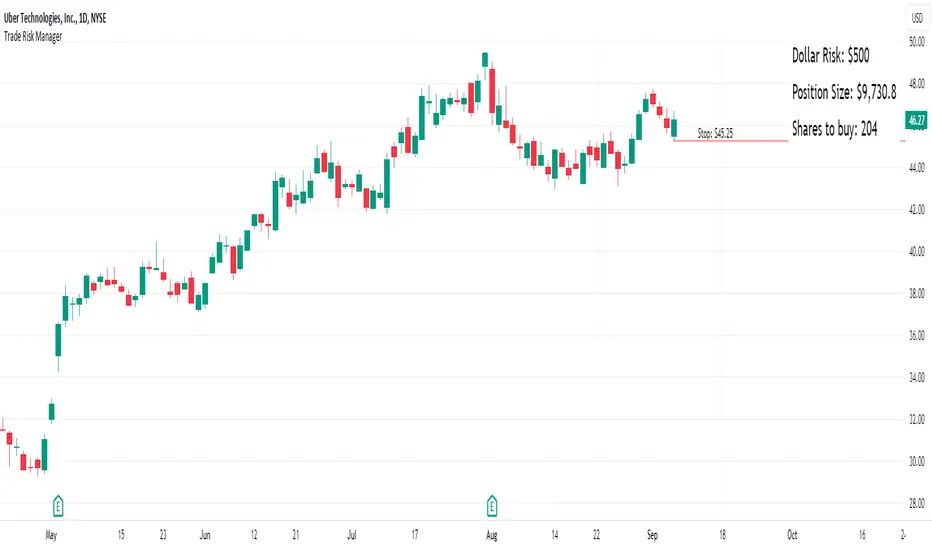
(Simple) Lot Size CalculatorPip Calculator: A Guide for Traders
The Pip Calculator is a powerful tool designed to help traders calculate their lot size based on their account balance, risk percentage, and stop loss in pips. This guide will walk you through using the Pip Calculator script and explain its features.
Features of the Pip Calculator:
User-friendly UI : The Pip Calculator provides a simple and intuitive user interface, making it easy to input your account details and obtain the desired lot size.
Flexible Inputs : The Pip Calculator allows you to enter your account balance, risk percentage, and stop loss in pips. This flexibility enables you to customize the calculation according to your trading strategy.
Dynamic Currency Pair Support : The Pip Calculator supports various currency pairs and their respective pip values. The script automatically detects the currency pair of the chart you're viewing, ensuring accurate calculations.
Real-time Lot Size Display : The Pip Calculator instantly calculates and displays the lot size based on your inputs. The lot size is updated in real-time as you adjust your account balance, risk percentage, or stop loss.
Visual Representation : The Pip Calculator visually presents the calculated lot size on the chart, making it easy to understand and reference during your trading activities.
Using the Pip Calculator:
Install and Apply the Script : To use the Pip Calculator, install it as an extension on your preferred trading platform (such as TradingView). Apply the script to the chart of the desired currency pair.
Enter Account Details : In the script's user interface, enter your account balance, risk percentage, and stop loss in pips. These details are essential for accurate lot size calculation.
Review Currency Pair Support : The Pip Calculator automatically detects the currency pair of the chart. Ensure that the currency pair is supported by checking the "Currency pair not supported" message. Currently, GBPJPY is the supported pair.
Observe Real-time Lot Size : Once you've entered the required information, the script will calculate and display the lot size in real-time. The lot size is adjusted automatically as you modify your inputs.
Visualize the Lot Size : The calculated lot size is displayed on the chart as a label. You can easily view and reference the lot size while analyzing price movements.
Customize the UI : The Pip Calculator allows you to customize the appearance of the lot size label. You can adjust the text color, background color, and choose whether to show or hide the lot size label.
Note: The Pip Calculator script is intended as a tool to assist traders in determining an appropriate lot size based on their account balance, risk percentage, and stop loss. It should be used in conjunction with a comprehensive trading strategy and risk management principles.
Advantages of the Pip Calculator:
Accuracy: The Pip Calculator incorporates accurate pip values for supported currency pairs, ensuring precise lot size calculations.
Simplicity: The user-friendly interface and intuitive design make it easy for traders to calculate their lot size without complex calculations or manual estimations.
Real-time Updates: The Pip Calculator provides instant lot size updates, allowing traders to adapt their position sizing based on changes in account balance, risk percentage, or stop loss.
Visibility: The visual representation of the lot size on the chart helps traders quickly identify their desired position size and monitor it during trading activities.
The Pip Calculator offers a convenient and efficient way to determine lot sizes based on your trading parameters. By using this tool, you can enhance your risk management practices, maintain consistency, and stay aligned with your trading plan.
Disclaimer: The Pip Calculator script is provided for informational purposes only and should not be considered as financial advice. Trading in the financial markets carries inherent risks, and it is essential to perform your own analysis and consult with a qualified financial advisor before making any investment decisions.

Trading PanelWhen trading, position sizing and risk calculation is the key to become successful.
We need to keep the losses small and adjust the position size according to what
risk we are prepared to take for the planned Entry.
Based on the Account Size and the max percentage we want to risk for any trade,
we calculate, for a number of fixed max Loss percentages:
- The Position size, both in percent and in the selected currency.
- Number of shares to buy.
- Where to put the Stop Loss.
We also calculate the numbers based on the ATR times a multiple.
The values are presented in a table format and will hopefully aid in selecting
a suitable Stop Loss (based on the chart situation) and hence the proper Position Size.
We also allow for expressing the Account size in currencies other than USD.
Example:
Account Size in USD and trading US stocks: select USD
Account Size in SEK but trading US stocks: select USDSEK
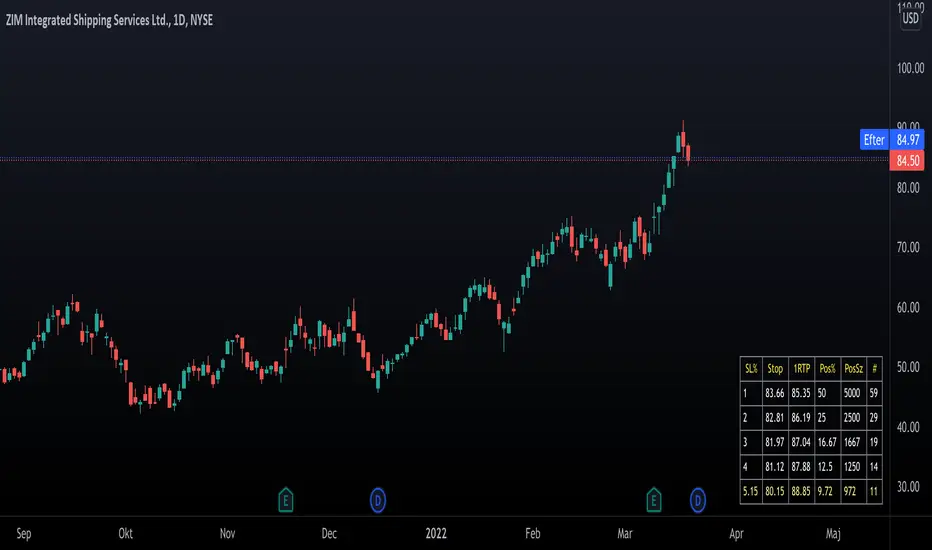
able FRVP Reversal# able FRVP Reversal - Complete User Guide
## 📌 Overview
**able FRVP Reversal** is a professional-grade Volume Profile indicator with an integrated reversal detection system. It combines Fixed Range Volume Profile (FRVP) analysis with a confluence-based reversal scoring system to identify high-probability turning points at key volume levels.
---
## ✨ Key Features
| Feature | Description |
|---------|-------------|
| **Session-Based Volume Profile** | Automatically resets at the beginning of each regular trading session |
| **POC (Point of Control)** | Highest volume price level - strongest support/resistance |
| **VAH (Value Area High)** | Upper boundary of the 70% value area - resistance zone |
| **VAL (Value Area Low)** | Lower boundary of the 70% value area - support zone |
| **Confluence Scoring System** | 5-point scoring system for reversal detection |
| **Smart Cooldown** | Prevents signal spam with customizable cooldown period |
| **Real-time Info Table** | Displays all key metrics in a retro-style dashboard |
---
## 🔧 Installation
1. Open TradingView and go to **Pine Editor**
2. Delete any existing code and paste the indicator code
3. Click **"Add to Chart"**
4. Configure settings as needed
---
## ⚙️ Settings Explained
### 📊 Volume Profile Settings
| Setting | Default | Description |
|---------|---------|-------------|
| **Number of Rows** | 50 | Resolution of the volume profile (more rows = finer detail) |
| **Value Area %** | 70 | Percentage of volume to include in Value Area (industry standard: 70%) |
| **Profile Width** | 40 | Visual width of the histogram on chart |
| **Show Histogram** | ✓ | Display volume histogram bars |
| **Show POC/VAH/VAL** | ✓ | Display the three key levels |
| **Show Labels** | ✓ | Display price labels for each level |
| **Extend Lines** | ✓ | Extend levels to the right of current price |
| **Extend Length** | 100 | How far to extend the lines (in bars) |
### 🔄 Reversal Detection Settings
| Setting | Default | Description |
|---------|---------|-------------|
| **Enable Reversal Detection** | ✓ | Turn reversal signals on/off |
| **Min Confluence Score** | 3 | Minimum score required to trigger signal (1-5) |
| **Cooldown Bars** | 10 | Minimum bars between signals to prevent spam |
#### Understanding Min Confluence Score:
- **Score 1-2**: Very sensitive, many signals (not recommended)
- **Score 3**: Balanced - good for most traders ⭐ Recommended
- **Score 4**: Conservative - fewer but higher quality signals
- **Score 5**: Very strict - only strongest reversals
### 🎨 Color Settings
All colors are fully customizable:
- **POC Line**: Default Gold (#FFD700)
- **VAH Line**: Default Coral Red (#FF6B6B)
- **VAL Line**: Default Teal (#4ECDC4)
- **Bullish Reversal**: Default Green (#00E676)
- **Bearish Reversal**: Default Red (#FF5252)
---
## 📖 How to Read the Indicator
### Volume Profile Histogram
```
█████████████ ← High volume = Strong S/R
████████ ← Medium volume
████ ← Low volume = Weak S/R
██
```
- **Darker/Longer bars** = More trading activity at that price
- **Inside Value Area** = Colored based on session direction (Bull/Bear)
- **Outside Value Area** = Muted gray color
### Key Levels
| Level | Color | Meaning |
|-------|-------|---------|
| **POC** | Yellow | Price with highest volume - Strongest magnet |
| **VAH** | Red | Upper resistance - Look for bearish reversals |
| **VAL** | Teal | Lower support - Look for bullish reversals |
---
## 🔄 Reversal Detection System
### How the Scoring System Works
The indicator uses a **5-point confluence scoring system**. Each condition adds 1 point:
#### 🟢 Bullish Reversal Score (at VAL)
| Condition | Points | Description |
|-----------|--------|-------------|
| Price at VAL Zone | +1 | Price is within VAL ± 0.2 ATR |
| Bullish Candle | +1 | Close > Open (green candle) |
| RSI Oversold | +1 | RSI < 35 |
| Rejection Wick | +1 | Lower wick > 1.5× body size |
| Failed Breakdown | +1 | Touched below VAL but closed above |
#### 🔴 Bearish Reversal Score (at VAH)
| Condition | Points | Description |
|-----------|--------|-------------|
| Price at VAH Zone | +1 | Price is within VAH ± 0.2 ATR |
| Bearish Candle | +1 | Close < Open (red candle) |
| RSI Overbought | +1 | RSI > 65 |
| Rejection Wick | +1 | Upper wick > 1.5× body size |
| Failed Breakout | +1 | Touched above VAH but closed below |
### Signal Quality Ratings
| Score | Rating | Meaning |
|-------|--------|---------|
| 5/5 | ★★★ | Excellent - Highest probability |
| 4/5 | ★★ | Good - High probability |
| 3/5 | ★ | Acceptable - Moderate probability |
| <3 | - | No signal triggered |
---
## 📋 Info Table Explained
```
╔═ able-REV ═╗ 15 ████████ SCR
─────────────────────────────────────
ZONE UPPER VA ▒▒▓▓████ ▲
POC 4272.680 ██████·· ▲
VAH 4322.745 ████···· ·
VAL 4264.977 ██████·· ·
═ SCORE ═════════════════════════════
BULL 0/5 ········ ·
BEAR 1/5 ░······· ·
RSI 49 ▒▒▓▓···· ·
◄SIGNAL► WAIT ········ ·
```
| Row | Description |
|-----|-------------|
| **ZONE** | Current price position relative to Value Area |
| **POC/VAH/VAL** | Price levels with distance indicators |
| **BULL Score** | Current bullish confluence score |
| **BEAR Score** | Current bearish confluence score |
| **RSI** | RSI value with OB/OS status |
| **SIGNAL** | Current signal status (BUY/SELL/WAIT) |
### Zone Types
| Zone | Meaning | Bias |
|------|---------|------|
| ABOVE VAH | Price broke above resistance | Bullish (but watch for rejection) |
| ⚠ AT VAH | Price testing resistance | Watch for bearish reversal |
| UPPER VA | Price in upper value area | Slight bullish bias |
| LOWER VA | Price in lower value area | Slight bearish bias |
| ⚠ AT VAL | Price testing support | Watch for bullish reversal |
| BELOW VAL | Price broke below support | Bearish (but watch for rejection) |
---
## 📈 Trading Strategies
### Strategy 1: VAH Rejection (Bearish Reversal)
**Setup:**
1. Price approaches or touches VAH (red dashed line)
2. BEAR score reaches 3+ (or your minimum setting)
3. REV signal appears above the candle
**Entry:**
- Enter SHORT on signal candle close
- Or wait for confirmation candle
**Stop Loss:**
- Above the signal candle high
- Or above VAH + 0.5 ATR
**Take Profit:**
- First target: POC (yellow line)
- Second target: VAL (teal line)
---
### Strategy 2: VAL Bounce (Bullish Reversal)
**Setup:**
1. Price approaches or touches VAL (teal dashed line)
2. BULL score reaches 3+ (or your minimum setting)
3. REV signal appears below the candle
**Entry:**
- Enter LONG on signal candle close
- Or wait for confirmation candle
**Stop Loss:**
- Below the signal candle low
- Or below VAL - 0.5 ATR
**Take Profit:**
- First target: POC (yellow line)
- Second target: VAH (red line)
---
### Strategy 3: POC Bounce
**Setup:**
1. Price pulls back to POC after trending
2. POC acts as support/resistance
3. Watch for reversal candle patterns
**Entry:**
- Long if bullish candle at POC from below
- Short if bearish candle at POC from above
**Stop Loss:**
- Other side of POC ± buffer
---
## ⚠️ Important Notes
### When Signals Work Best
✅ **High Probability Setups:**
- Score 4-5 with clear rejection wick
- RSI confirms (oversold for long, overbought for short)
- First test of VAH/VAL in the session
- Clear trend before reversal
❌ **Low Probability Setups:**
- Score barely meeting minimum (3/5)
- Multiple tests of same level (level weakening)
- Low volume/choppy market
- News events pending
### Risk Management Rules
1. **Never risk more than 1-2% per trade**
2. **Always use stop loss** - place beyond the level
3. **Wait for candle close** - don't enter on wick touches
4. **Respect the cooldown** - avoid overtrading
5. **Consider the trend** - counter-trend reversals are riskier
---
## 🔔 Alerts
The indicator includes built-in alerts:
| Alert | Trigger |
|-------|---------|
| VAL Bullish Reversal | BULL score meets minimum at VAL |
| VAH Bearish Reversal | BEAR score meets minimum at VAH |
### Setting Up Alerts:
1. Right-click on the chart
2. Select "Add Alert"
3. Choose "able FRVP Reversal" as condition
4. Select desired alert type
5. Configure notification method
---
## 💡 Pro Tips
1. **Combine with trend analysis** - Reversals in trend direction are more reliable
2. **Watch for confluence with other S/R** - If VAH/VAL aligns with round numbers, previous highs/lows, or fib levels, the level is stronger
3. **Volume confirmation** - Higher volume on reversal candle = stronger signal
4. **Time of day matters** - Reversals during active trading hours are more reliable
5. **Adjust sensitivity by market** - Volatile assets may need higher Min Confluence Score
6. **Use multiple timeframes** - Check if reversal level aligns with higher timeframe levels
---
## 🔧 Recommended Settings by Trading Style
| Style | Min Confluence | Cooldown | Best For |
|-------|----------------|----------|----------|
| Scalping | 3 | 5-7 | Quick trades, more signals |
| Day Trading | 3-4 | 10-15 | Balanced approach |
| Swing Trading | 4-5 | 20+ | Fewer, higher quality signals |
---
## ❓ Troubleshooting
| Issue | Solution |
|-------|----------|
| No signals appearing | Lower Min Confluence Score or check if market is ranging |
| Too many signals | Increase Min Confluence Score or Cooldown Bars |
| Levels not showing | Enable Show POC/VAH/VAL in settings |
| Histogram too wide/narrow | Adjust Profile Width setting |
---
## 📞 Support
For questions, suggestions, or bug reports, please contact the developer.
---
**Version:** 1.0
**Last Updated:** 2024
**Platform:** TradingView (Pine Script v6)

APEX TREND: Macro & Hard Stop SystemAPEX TREND: Macro & Hard Stop System
The APEX TREND System is a composite trend-following strategy engineered to solve the "Whipsaw" problem inherent in standard breakout systems. It orchestrates four distinct technical theories—Macro Trend Filtering, Volatility Squeeze, Momentum, and Volatility Stop-Loss—into a single, hierarchical decision-making engine.
This script is not merely a collection of indicators; it is a rules-based trading system designed for Swing Traders (Day/Week timeframes) who aim to capture major trend extensions while strictly managing downside risk through a "Hard Stop" mechanism.
🧠 Underlying Concepts & Originality
Many trend indicators fail because they treat all price movements equally. The APEX TREND differentiates itself by applying an "Institutional Filter" logic derived from classic Dow Theory and Modern Volatility Analysis.
1. The Macro Hard Stop (The 200 EMA Logic)
Origin: Based on the institutional mandate that “Nothing good happens below the 200-day moving average.”
Function: Unlike standard super trends that flip constantly in sideways markets, this system integrates a 200-period Exponential Moving Average (EMA) as a non-negotiable "Hard Stop."
Synergy: This acts as the primary gatekeeper. Even if the volatility engine signals a "Buy," the system suppresses the signal if the price is below the Macro Baseline, effectively filtering out counter-trend traps.
2. The Volatility Engine (Squeeze Theory)
Origin: Derived from John Carter’s TTM Squeeze concept.
Function: The script identifies periods where Bollinger Bands (Standard Deviation) contract inside Keltner Channels (ATR). This indicates a period of potential energy build-up.
Synergy: The system only triggers an entry when this energy is released (Breakout) AND coincides with Linear Regression Momentum, ensuring the breakout is genuine.
3. Anti-Chop Filter (ADX Integration)
Origin: J. Welles Wilder’s Directional Movement Theory.
Function: A common failure point for trend systems is low-volatility chop. This script utilizes the Average Directional Index (ADX).
Synergy: If the ADX is below the threshold (Default: 20), the market is deemed "Choppy." The script visually represents this by painting candles GRAY, signaling a "No-Trade Zone" regardless of price action.
4. The "Run Trend" Stop Loss (Factor 4.0 ATR)
Origin: Adapted from the Turtle Trading rules regarding volatility-based stops.
Function: Standard Trailing Stops (usually Factor 3.0) are too tight for crypto or volatile equities on daily timeframes.
Optimization: This system employs a wider ATR Multiplier of 4.0. This allows the asset to fluctuate naturally within a trend without triggering a premature exit, maximizing the "Run Trend" potential.
🛠 How It Works (The Algorithm)
The script processes data in a specific order to generate a signal:
Check Macro Trend: Is Price > EMA 200? (If No, Longs are disabled).
Check Volatility: Is ADX > 20? (If No, all signals are disabled).
Check Volume: Is Current Volume > 1.2x Average Volume? (Confirmation of institutional participation).
Trigger: Has a Volatility Breakout occurred in the direction of the Macro Trend?
Execution: If ALL above are true -> Generate Signal.
🎯 Strategy Guide
1. Long Setup (Bullish)
Signal: Look for the Green "APEX LONG" Label.
Condition: The price must be ABOVE the White Line (EMA 200).
Execution: Enter at the close of the signal candle.
Stop Loss: Initial stop at the Green Trailing Line.
2. Short Setup (Bearish)
Signal: Look for the Red "APEX SHORT" Label.
Condition: The price must be BELOW the White Line (EMA 200).
Execution: Enter at the close of the signal candle.
Stop Loss: Initial stop at the Red Trailing Line.
3. Exit Rules (Crucial)
This system employs a Dual-Exit Mechanism:
Soft Exit (Profit Taking): Close the position if the price crosses the Trailing Stop Line (Green/Red line). This locks in profits during a trend reversal.
Hard Exit (Emergency): Close the position IMMEDIATELY if the price crosses the White EMA 200 Line against your trade. This prevents holding a position during a major market regime change.
⚙️ Settings
Momentum Engine: Adjust Bollinger Band/Keltner Channel lengths to tune breakout sensitivity.
Apex Filters: Toggle the EMA 200 or ADX filters on/off to adapt to different asset classes.
Risk Management: The ATR Multiplier (Default 4.0) controls the width of the trailing stop. Lower values = Tighter stops (Scalping); Higher values = Looser stops (Swing).
Disclaimer: This script is designed for trend-following on higher timeframes (4H, 1D, 1W). Please backtest on your specific asset before live trading.
